

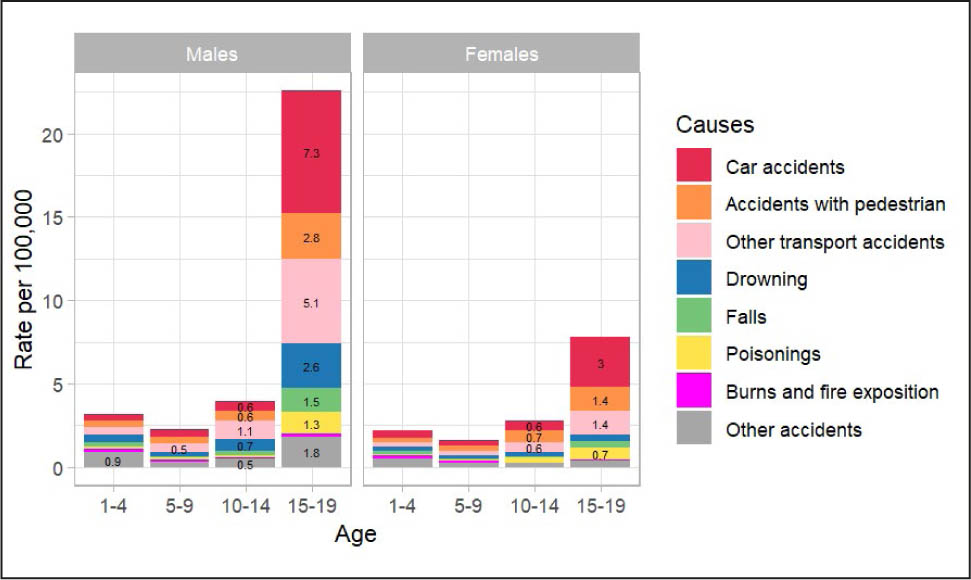
Figure 1:
Period-average mortality rates (2010–2024) by external causes of unintentional injury.
Table 1:
Average crude death rates per 100,000 due to unintentional injuries for years 2010–2024 in Poland by gender, age group, and place of residence.
| Sex | Age group | Urban areas – rate and 95% CI | Rural areas – rate and 95% CI | Poland-rate and 95% CI |
|---|---|---|---|---|
| Overall | Overall | 4.9 (4.7–5.1) | 7.6 (7.3–7.8) | 6.1 (5.9–6.2) |
| Overall | 1–4 | 2.2 (2–2.5) | 3.4 (3.0–3.8) | 2.7 (2.5–2.9) |
| Overall | 5–9 | 1.7 (1.5–1.9) | 2.3 (2–2.6) | 2.0 (1.8–2.1) |
| Overall | 10–14 | 2.9 (2.6–3.1) | 4.0 (3.7–4.3) | 3.4 (3.2–3.6) |
| Overall | 15–19 | 12.3 (11.8–12.9) | 18.9 (18.2–19.7) | 15.4 (14.9–15.8) |
| Males | Overall | 6.4 (6.1–6.7) | 10.7 (10.3–11.1) | 8.3 (8.1–8.6) |
| Males | 1–4 | 2.5 (2.1–2.9) | 4.2 (3.6–4.8) | 3.2 (2.9–3.5) |
| Males | 5–9 | 2.0 (1.7–2.3) | 2.6 (2.3–3.1) | 2.3 (2–2.5) |
| Males | 10–14 | 3.1 (2.7–3.5) | 5.0 (4.5–5.5) | 3.9 (3.6–4.3) |
| Males | 15–19 | 17.4 (16.5–18.3) | 28.5 (27.3–29.8) | 22.5 (21.8–23.3) |
| Females | Overall | 3.3 (3.1–3.6) | 4.2 (4.0–4.5) | 3.7 (3.6–3.9) |
| Females | 1–4 | 2.0 (1.6–2.3) | 2.5 (2.1–3.0) | 2.2 (1.9–2.5) |
| Females | 5–9 | 1.5 (1.2–1.7) | 1.9 (1.6–2.3) | 1.7 (1.5–1.9) |
| Females | 10–14 | 2.7 (2.3–3.1) | 2.9 (2.5–3.4) | 2.8 (2.5–3.1) |
| Females | 15–19 | 7.0 (6.5–7.6) | 8.8 (8.1–9.5) | 1.8 (7.4–8.3) |
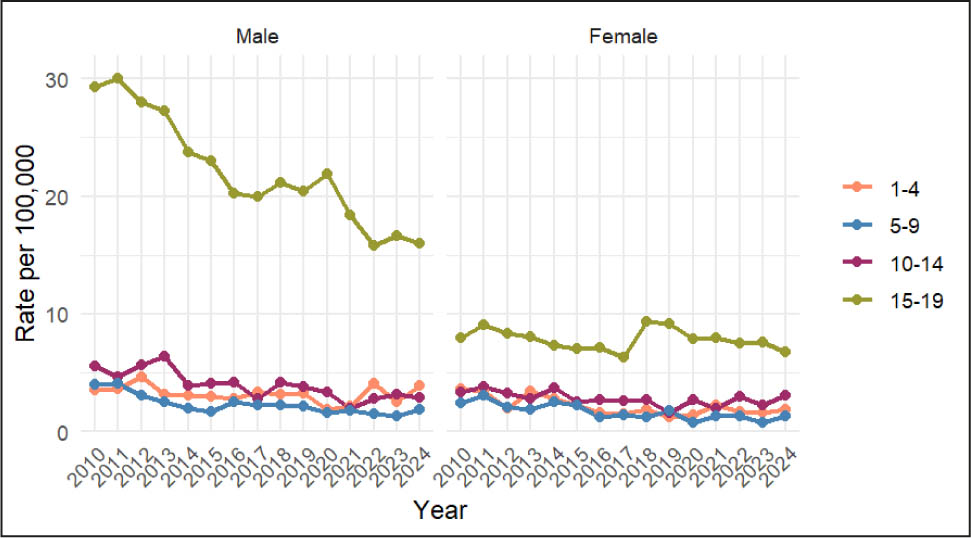
Figure 2:
Crude death rates due to unintentional injuries among children and adolescents in Poland (2010–2024) by age and sex.
Table 2:
Trends of death rates per 100,000 due to unintentional injuries by age and gender in Poland (2010 vs 2024) with Average Percentage Change (APC).
| Gender | Age group | APC (%) and 95% CI | Rate in 2010 | Rate in 2024 |
|---|---|---|---|---|
| Overall | Overall | −4.8 (−5.3; −4.3) | 8.5 | 4.9 |
| Overall | 1–4 | −3.4 (−5.1; −1.6) | 3.6 | 2.9 |
| Overall | 5–9 | −6.7 (−8.5; −4.8) | 3.2 | 1.6 |
| Overall | 10–14 | −4.3 (−5.7; −2.9) | 4.5 | 3.0 |
| Overall | 15–19 | −3.5 (−4.1; −2.9) | 18.8 | 11.5 |
| Males | Overall | −5.6 (−6.2; −4.9) | 12.2 | 6.3 |
| Males | 1–4 | −1.7 (−4; 0.6) | 3.5 | 3.9 |
| Males | 5–9 | −6.5 (−8.9; −4.1) | 4.0 | 1.9 |
| Males | 10–14 | −5.4 (−7.2; −3.6) | 5.5 | 2.9 |
| Males | 15–19 | −4.5 (−5.2; −3.7) | 29.3 | 16.0 |
| Females | Overall | −3.0 (−4.0; −2.0) | 4.6 | 3.4 |
| Females | 1–4 | −5.9 (−8.7; −3.1) | 3.7 | 1.9 |
| Females | 5–9 | −6.8 (−9.6; −3.9) | 2.4 | 1.4 |
| Females | 10–14 | −2.6 (−4.8; −0.4) | 3.4 | 3.0 |
| Females | 15–19 | −0.6 (−1.9; 0.7) | 7.9 | 6.7 |
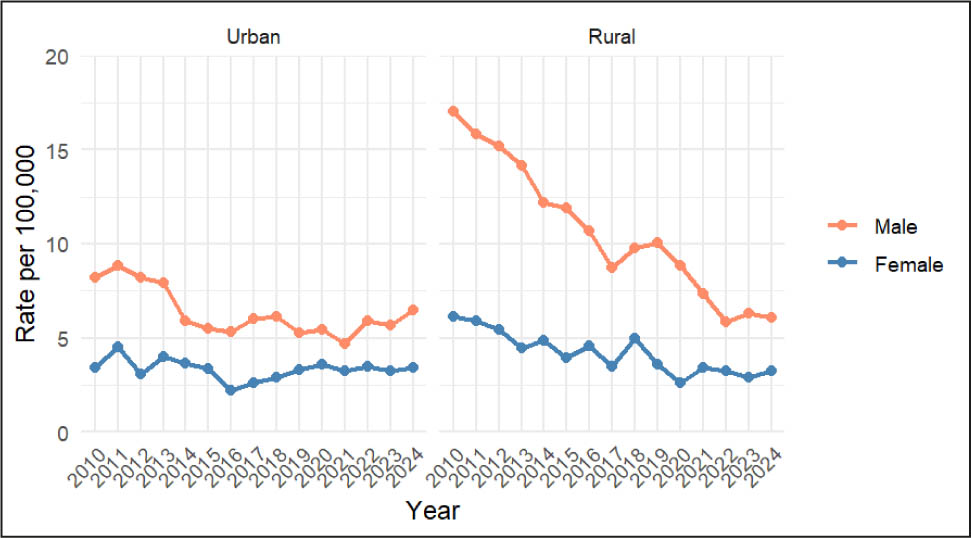
Figure 3:
Crude death rates due to unintentional injuries among children and adolescents in Poland (2010–2024) by setting of residence.
Table 3:
Trends of death rates per 100,000 due to unintentional injuries by gender in Poland (2010 vs 2024) with Average Percentage Change (APC).
| Gender | Setting of Residence | APC (%) and 95% CI | Rate in 2010 | Rate in 2024 |
|---|---|---|---|---|
| Overall | Urban | −2.4 (−3.2; −1.6) | 5.9 | 5.0 |
| Males | Urban | −3.1 (−4.1; −2.2) | 8.2 | 6.5 |
| Females | Urban | −0.9 (−2.3; 0.5) | 3.4 | 3.4 |
| Overall | Rural | −6.7 (−7.4; −6.0) | 11.7 | 4.7 |
| Males | Rural | −7.3 (−8.2; −6.5) | 17.0 | 6.0 |
| Females | Rural | −5.1 (−6.4; −3.7) | 6.1 | 3.3 |
Table 4:
Trends of death rates per 100,000 due to unintentional injuries by category of accidents in Poland (2010 vs 2024) with Average Percentage Change (APC).
| Category of accidents | APC (%) and 95%CI | Rate in 2010 | Rate in 2024 |
|---|---|---|---|
| All accidents | −4.8 (−5.3; −4.3) | 8.5 | 4.9 |
| Car accidents | −5.9 (−6.9; −4.9) | 2.6 | 1.0 |
| Drowning | −10.1 (−11.7; −8.5) | 1.3 | 0.4 |
| Accidents with pedestrians | −4.9 (−6.3; −3.5) | 1.2 | 0.7 |
| Other transport accidents | −4.6 (−5.8; −3.5) | 1.8 | 1.3 |
| Falls | −3.9 (−6; −1.8) | 0.3 | 0.2 |
| Other accidents | −3.5 (−5; −2) | 1.0 | 0.7 |
| Poisonings | 6.3 (3.9; 8.7) | 0.3 | 0.5 |
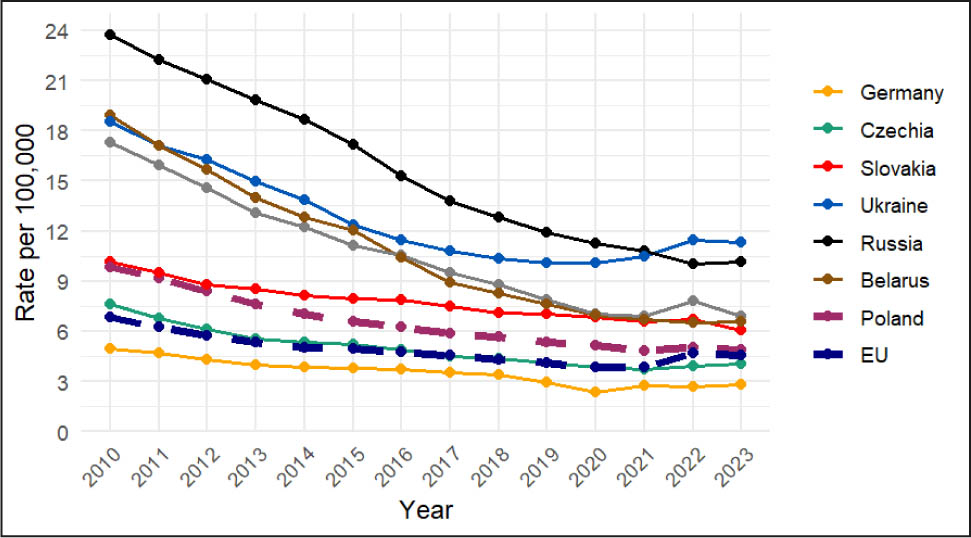
Figure 4:
Unintentional injury mortality rates among children and adolescents (< 20 years), based on GBD estimates (2010–2023).