

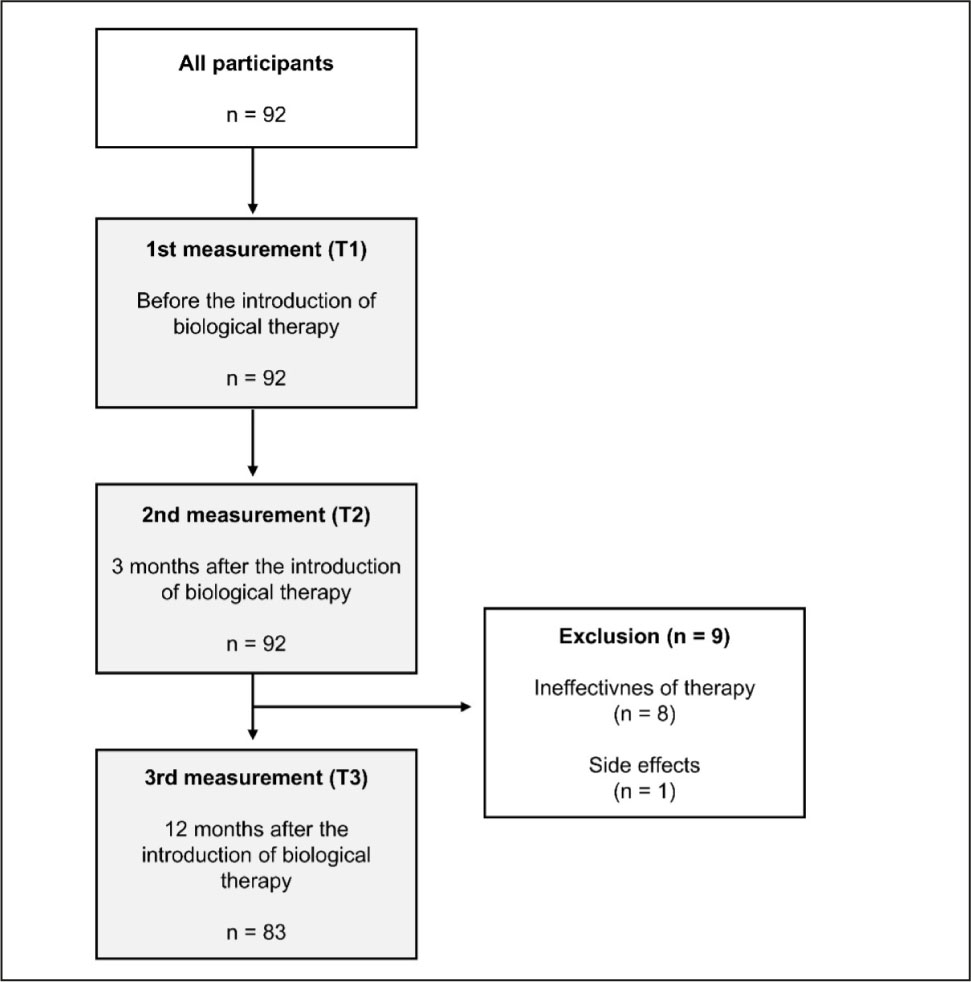
Figure 1.
Flowchart of the final patient population.
Table 1.
Descriptive statistics of the sociodemographic and clinical characteristics of the patients.
| Variable | Categories / Units | n (%) or mean ± SD |
|---|---|---|
| Sex | Male | 12 (13%) |
| Female | 80 (87%) | |
| Age | 44.5±11.8 | |
| Education | Primary school | 2 (2.2%) |
| Secondary school | 45 (48,9%) | |
| College / University | 32 (34.8%) | |
| Master's Degree | 4 (4.3%) | |
| Specialisation | 4 (4.3%) | |
| Doctorate | 5 (5.4%) | |
| Employment | Yes | 71 (77.2%) |
| Variable | Categories / Units | n (%) or mean ± SD |
|---|---|---|
| Attack frequency | Episodic migraine | 75 (81.5%) |
| Chronic migraine | 16 (17.4%) | |
| Duration of migraine (years) | < 5 years | 7 (7.6%) |
| 5–10 years | 23 (25.0%) | |
| > 10 years | 62 (67.4%) | |
| Type of migraine | Without aura | 78 (84.8%) |
| Migraine symptoms | Nausea | 56 (60.9%) |
| Photophobia | 60 (65.2%) | |
| Phonophobia | 44 (47.8%) | |
| Osmophobia | 8 (8.7%) | |
| Vomiting | 18 (19.6%) | |
| Fatigue | 2 (2.2%) | |
| No symptoms | 7 (7.6%) | |
| Average number of symptoms | 2.0±0.9 | |
| Depression | Yes | 11 (12.0%) |
Table 2.
Presentation of the median, IQR, and statistical significance at three time points.
| Variable | T1 (median, IQR) | T2 (median, IQR) | T3 (median, IQR) | Statistical significance (p-value) | |
|---|---|---|---|---|---|
| MIDAS | 19 [12–30] | 4 [0–7] | 2 [0–6] | p < 0.001 | T1 vs T2: < 0.001* |
| T1 vs T3: < 0.001* | |||||
| T2 vs T3: 0.002* | |||||
| VAS | 8 [8–9] | 4 [3–6] | 4 [3–5] | p < 0.001 | T1 vs T2: < 0.001* |
| T1 vs T3: < 0.001* | |||||
| T2 vs T3: 0.351 | |||||
| Average analgesic consumption | 12.5 [9–19.5] | 4 [1–6] | 2 [2–4] | p < 0.001 | T1 vs T2: < 0.001* |
| T1 vs T3: < 0.001* | |||||
| T2 vs T3: 0.009* | |||||
| Average number of monthly migraine days (MMD) | 10 [7–12.5] | 3 [2–5] | 2 [1.5–3] | p < 0.001 | T1 vs T2: < 0.001* |
| T1 vs T3: < 0.001* | |||||
| T2 vs T3: 0.024 | |||||
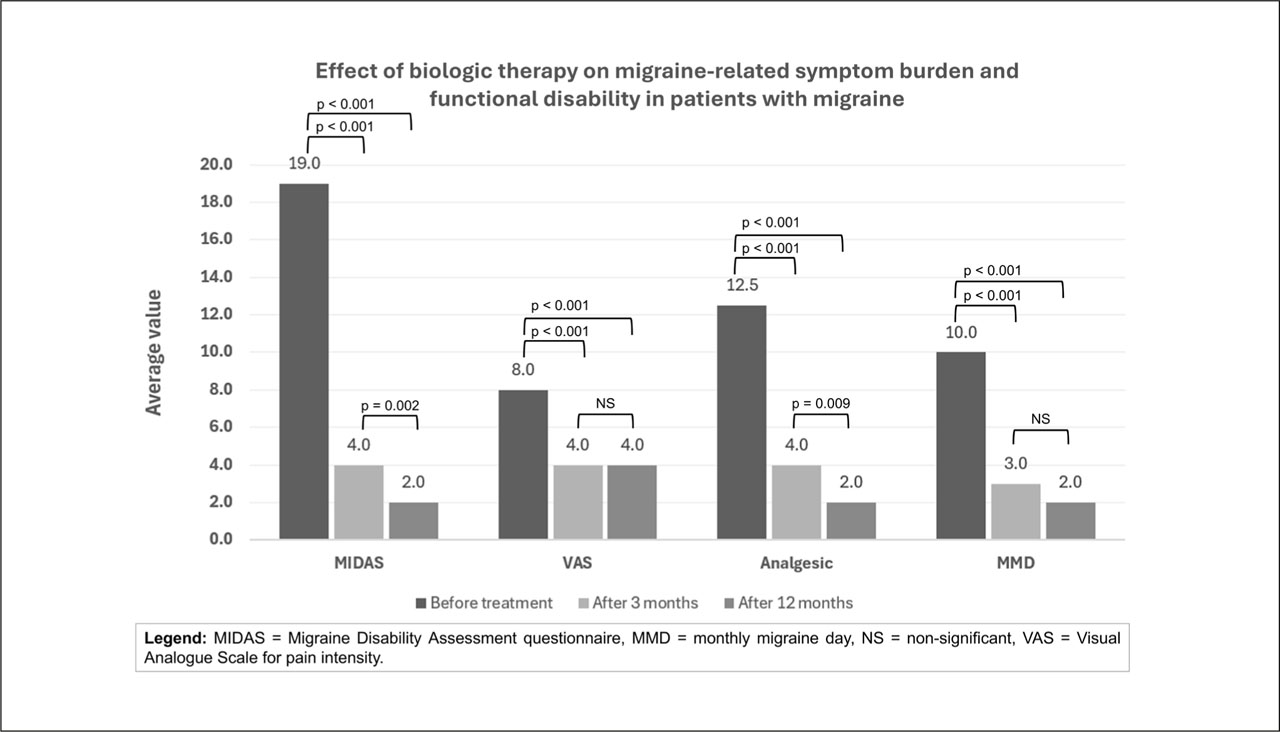
Figure 2.
Effect of biological therapy on migraine-related symptom burden and functional disability in patients with migraine.
Table 3.
Overview of current biological prophylaxis and reported side effects.
| n (%) | ||
|---|---|---|
| Current prophylaxis with biological therapy | Erenumab (Aimovig) | 13 (14.1%) |
| Fremanezumab (Ajovy) | 45 (48.9%) | |
| Galcanezumab (Emgality) | 26 (28.3%) | |
| Eptinezumab (Vyepti) | 8 (8.7%) | |
| Side effects of biological therapy | Pain at injection site | 3 (3.3%) |
| Leg cramps | 2 (2.2%) | |
| Dizziness | 2 (2.2%) | |
| Itching | 4 (4.3%) | |
| Rash- allergic reaction | 1 (1.1%) | |
| Redness | 7 (7.6%) | |
| Swelling | 2 (2.2%) | |
| Runny nose | 1 (1.1%) | |
| Constipation | 2 (2.2%) | |
| No side effects | 72 (78.3%) |
Table 4.
Overview of characteristics of patients who discontinued treatment.
| Characteristics | N = 9 | % |
|---|---|---|
| Female | 7 | 77.8% |
| Type of migraine (chronic migraine) | 5 | 55.6% |
| Employed | 5 | 55.6% |
| Duration of migraine in years (>10 years) | 6 | 66.7% |
| Reason for discontinuation: | ||
| • Ineffectiveness of treatment | 8 | 88.9% |
| • Side effects | 1 | 11.1% |
| Tension-type headache | 4 | 44.4% |
| Comorbid depression | 4 | 44.4% |