

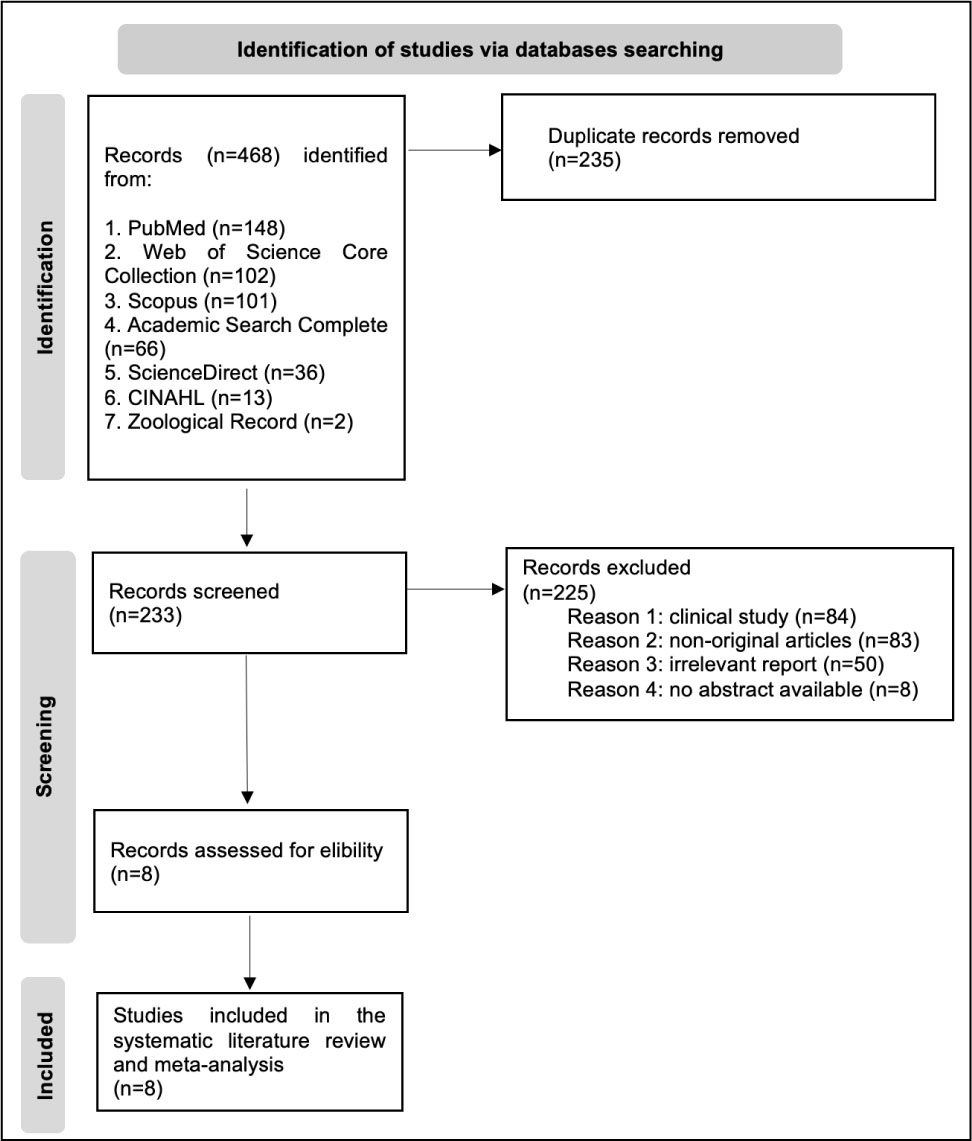
Figure 1.
PRISMA 2020 flow diagram of the study selection process.
Table 1.
Key items of the self-reported observed health outcome.
| Country | Sample size (N) | Male | Age, years (mean, SD) | 1-year | ≥10 years | Classification of systemic allergic reaction | Culprit Hymenoptera | |
|---|---|---|---|---|---|---|---|---|
| Annila et al., 1996 (17) | Finland | 191 | 164 | 51.8±12.3 | ✓ | ✓ | Müller | bee wasp (Vespula spp.) |
| Celikel et al., 2006 (18) | Turkey | 1245 | 489 | 48.2±11.5 | NA | bee | ||
| Münstedt et al., 2008 (19) | Germany | 1053 | 973 | 61.8±13.9 | ✓ | ✓ | Müller | bee |
| Richter et al., 2011 (20) | Great Britain | 852 | 545 | range 51–60 | ✓ | modified Müller | bee | |
| Becerril-Ángeles et al., 2013* (21) | Mexico | 1541 | 1289 | average 37 | ✓ | Müller | bee | |
| Çeliksoy et al., 2014* (22) | Turkey | 301 | 295 | 48.2±11.5 | Müller | bee | ||
| ✓ | Ring-Messmer | |||||||
| Ediger et al., 2018 (23) | Turkey | 221 | 213 | 49.9±11.8 | ✓ | Ring-Messmer | bee | |
| Demirkale et al., 2020 (24) | Turkey | 69 | 57 | 48.4±12.0 | ✓ | NA | bee |
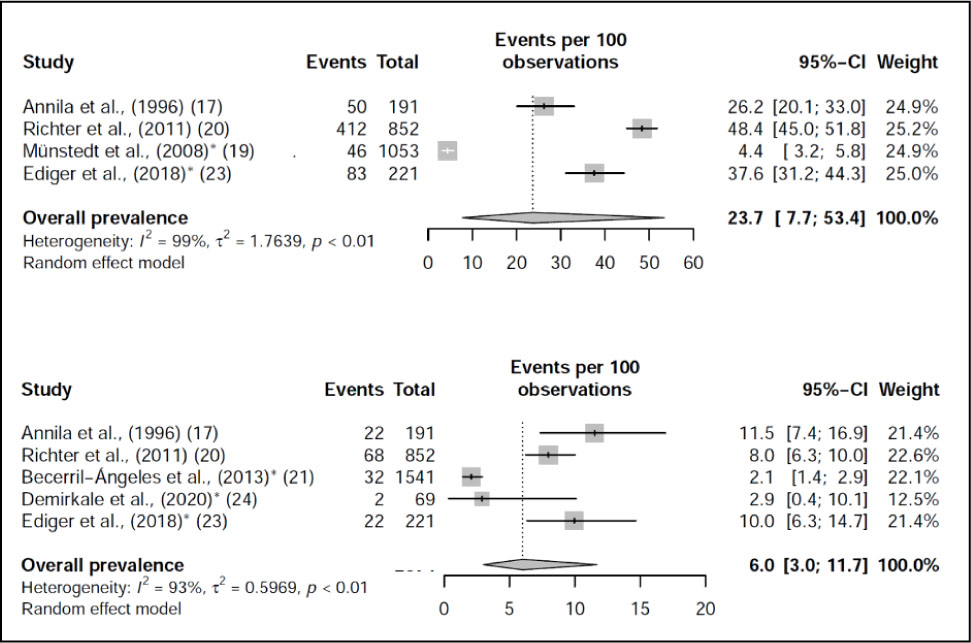
Figure 2.
Forest plot of the estimated overall lifetime (≥10 years) prevalence of self-reported systemic allergic reaction to bee venom among beekeepers (A) and self-reported systemic allergic reaction to bee venom for grades III–IV (B). *Studies with high risk of bias.
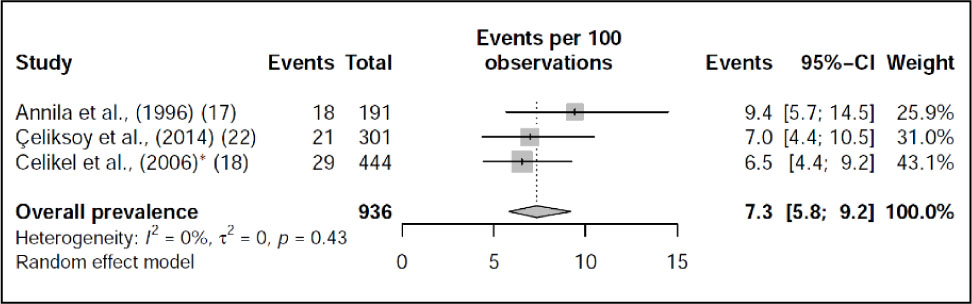
Figure 3.
Forest plot of the estimated overall one-year prevalence of self-reported systemic allergic reaction to bee venom among beekeepers.* Studies with high risk of bias.