

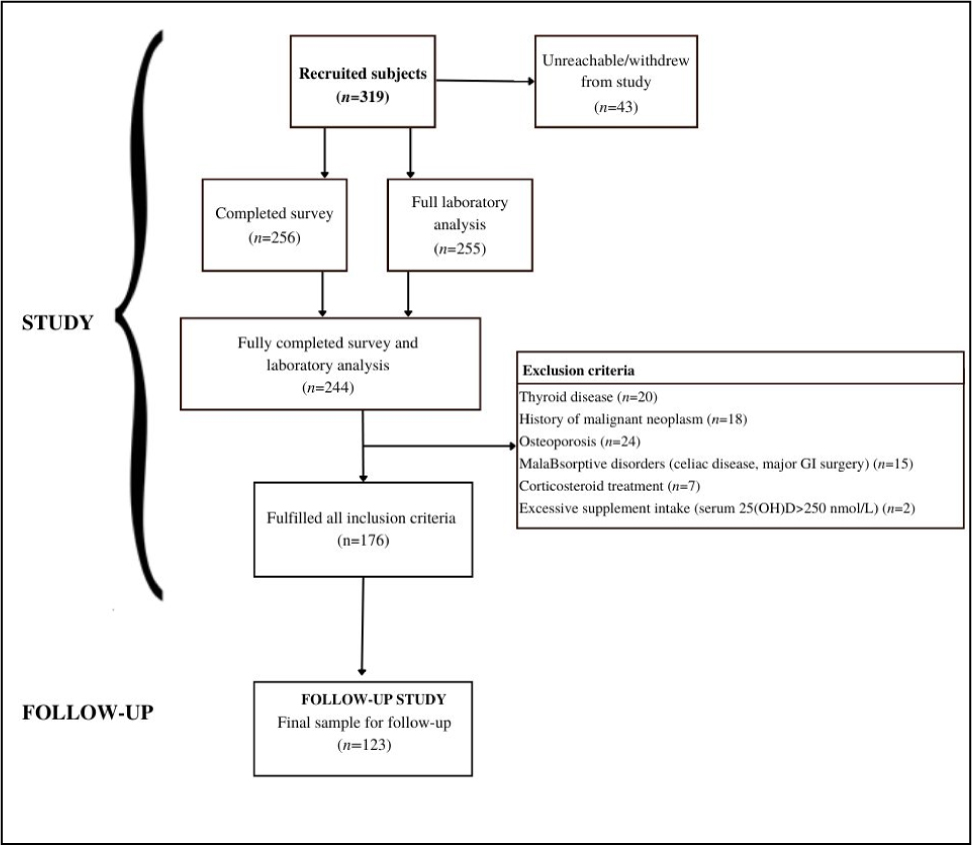
Figure 1.
Flowchart of the study that included healthy women aged 44 to 65 from the Central Slovenian region. The study was carried out between March and May 2021, and the follow-up study between October and November 2022.
Table 1.
Population characteristics, vitamin D status, supplementation and food intake of healthy women aged 44 to 65, from the Central Slovenian region. The study was carried out between March and May 2021 (n=176).
| Variables | Category/Unit | Total n=176 | Supplementers n=108 | Non-supplementers n=68 | p-value |
|---|---|---|---|---|---|
| Age | year | 53.8±5.0 | 54.3±4.8 | 53.1±5.2 | 0.120 t |
| Menstrual status | Premenopause | 39.2% | 34.3% | 47.1% | 0.091z |
| Postmenopause | 60.8% | 65.7% | 52.9% | 0.091z | |
| BMI (self-reported) | kg/m2 | 25.7±4.4 | 25.5±4.2 | 26.1±4.6 | 0.375 t |
| Smoking | Current smoker | 13.1% | 13.0% | 22.1% | 0.114 z |
| Education (ISCED) | Primary (L1) | 3.4% | 1.9% | 5.9% | |
| Secondary (L2-3) | 29.0% | 27.8% | 30.9% | ||
| Short-cycle tertiary (L5) | 14.2% | 14.8% | 13.2% | ||
| Bachelor’s or eq. (L6) | 13.6% | 13.0% | 14.7% | ||
| Master’s or eq. (L7) | 29.0% | 31.5% | 25.0% | ||
| Doctoral or eq. (L8) | 10.8% | 11.1% | 10.3% | ||
| Time spent outside | min | 53.3±17.7 | 54.3±16.4 | 51.8±19.6 | 0.363 t |
| Moderate physical activity | h/week | 3.2±4.2 | 3.0±3.3 | 3.5±5.4 | 0.447 t |
| Sunscreen use | 90.9% | 92.6% | 88.2% | 0.322 z | |
| Suntanning habits | High exposure | 6.8% | 4.6% | 10.3% | 0.1443 z |
| Medium exposure | 64.2% | 58.3% | 73.5% | 0.040 z | |
| Low exposure | 29.0% | 37.0% | 16.2% | 0.003 z | |
| Laboratory analysis | |||||
| 25(OH)D | nmol/L | 66.4±27.4 | 76.2±27.1 | 50.8±19.6 | <0.001 t |
| <30 | 8.5% | 3.7% | 16.2% | 0.004 z | |
| 30-50 | 15.9% | 6.5% | 30.9% | <0.001 z | |
| 50-75 | 43.2% | 44.4% | 41.2% | 0.675 z | |
| >75 | 32.4% | 45.4% | 11.8% | <0.001 z | |
| DBP | mg/L | 576±436 | 608±485 | 526±342 | 0.226 t |
| Albumin | g/L | 47.1±2.2 | 47.5±2.2 | 46.5±2.1 | 0.003 t |
| Bioavailable 25(OH)D | nmol/L | 5.7±4.5 | 6.7±4.9 | 4.3±3.1 | <0.001 t |
| Vitamin D intake and supplementation | |||||
| Food intake (μg/d) | 2.2±1.3 | 2.2±1.4 | 2.1±1.2 | 0.627 t | |
| Supplement use (≥5 μg vitamin D/d) | 61.4% | 100,0% | 0.0% | ||
| Supplemental intake (μg/d) | 21.7±26.2 | 35.4±25.3 | 0±0.08 | <0.001 t | |
| Intake all sources (μg/d) | 24.1±26.2 | 37.6±25.2 | 2.5±3.3 | <0.001 t | |
1 BMI=body mass index, DBP=vitamin D binding protein. All values are presented as a mean±SD or %. The p - value was determined using a two independent samples t-test (t) or two sample Z-test for proportions (Z). p<0.05 was considered statistically significant (p-values of significant variables are in bold print).
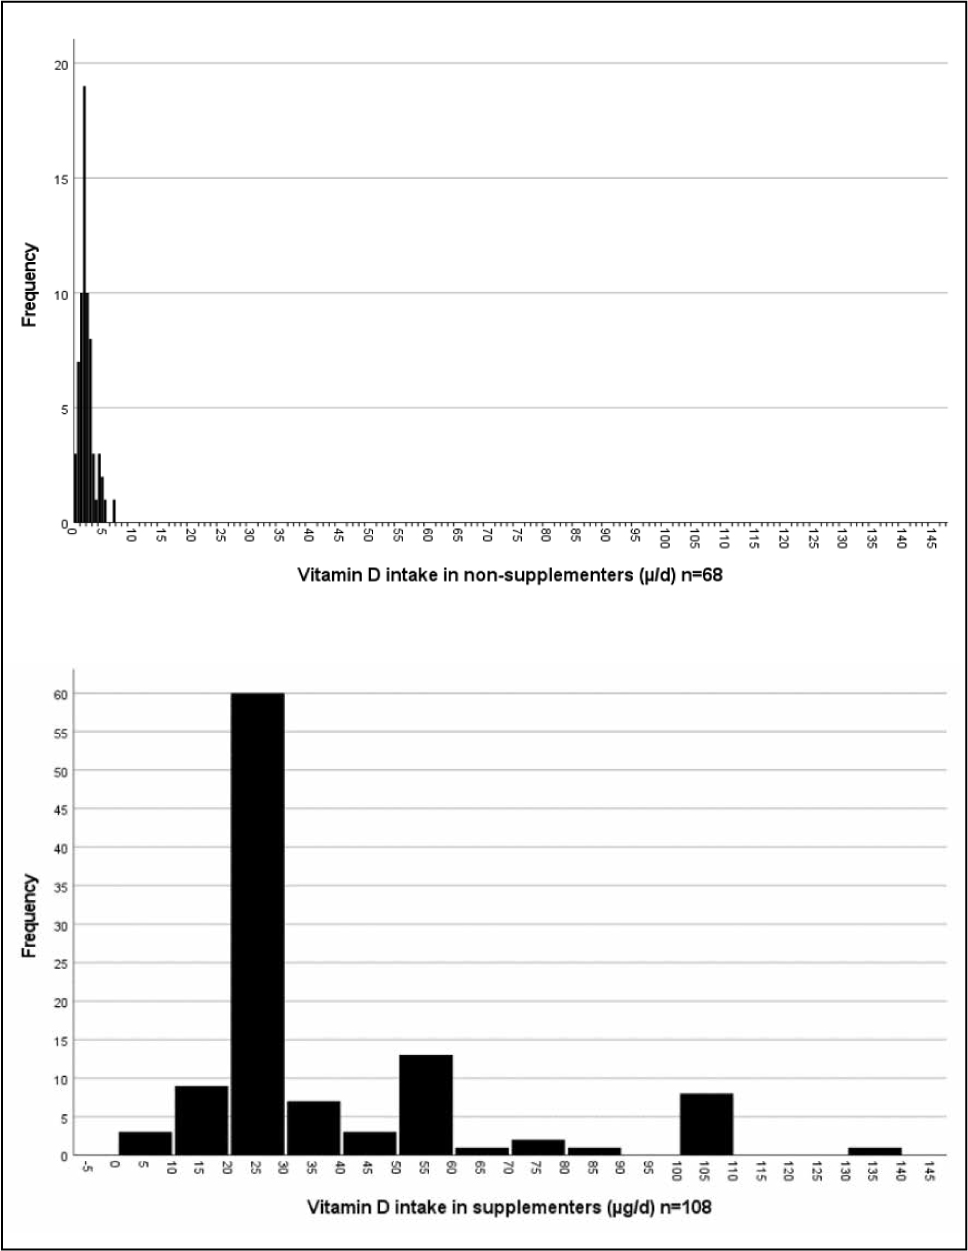
Figure 2.
Total vitamin D intake of non-supplementers (top) and supplementers (bottom) (>5 µg/d). Both histograms are at the same scale (0-145 µg/d).
Table 2.
Results from the online follow-up questionnaire of 123 healthy women aged 44 to 65 from the Central Slovenian region, included in the follow-up study carried out between October and November 2022 (n=123).
| Variables | Category/Unit | Total n=123 | Supplementers n=76 | Non-supplementers n=47 | p-value |
|---|---|---|---|---|---|
| Vitamin D supplementation | |||||
| Supplement use (≥5 μg vitamin D/d) | 61.8% | 100,0% | 0.0% | ||
| Supplemental intake | μg/d | 21.6±25.9 | 34.9±24.9 | 0.12±0.7 | <0.001 t |
| COVID-19 related changes in lifestyle and vitamin D supplementation | |||||
| Started/increased vitamin D supplementation | 61.0% | 63.2% | 57.4% | 0.522 z | |
| COVID-19 impact on time spent outside | No impact | 51.2% | 51.3% | 51.1% | 0.984 z |
| Increased | 37.4% | 38.2% | 36.2% | 0.826 z | |
| Decreased | 11.4% | 10.5% | 12.8% | 0.697 z | |
| Effect of participation in study on vitamin D supplementation | No effect | 51.8% | 42.0% | 62.8% | 0.026 z |
| Positive effect | 48.2% | 57.8% | 37.2% | 0.026 z | |
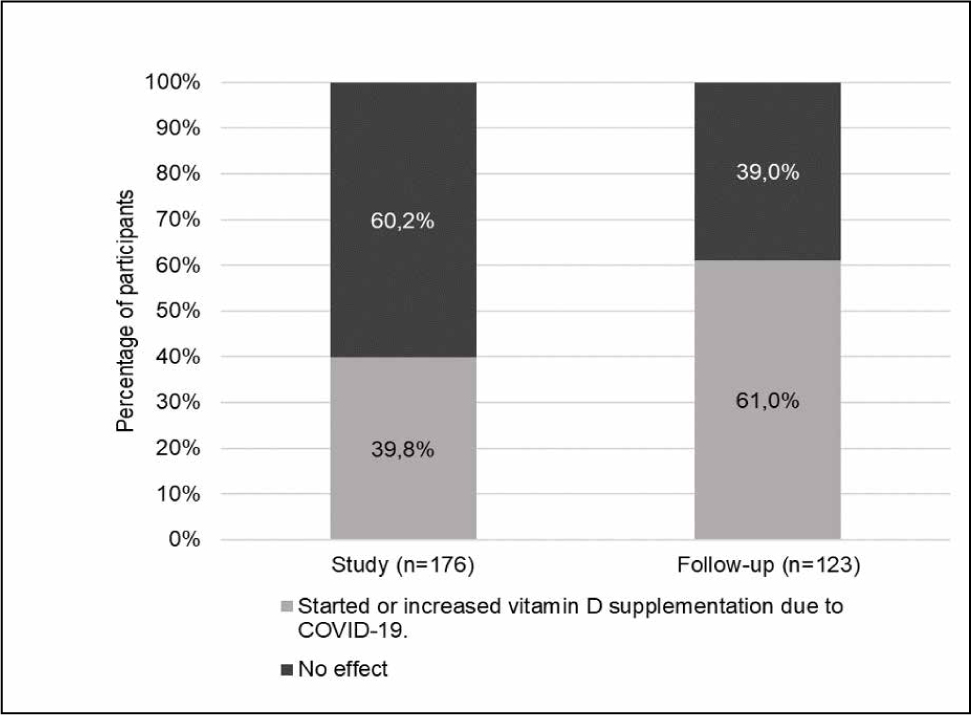
Figure 3.
Percentage of participants who have reported to have started or increased vitamin D supplementation due to COVID-19, in study and follow-up.
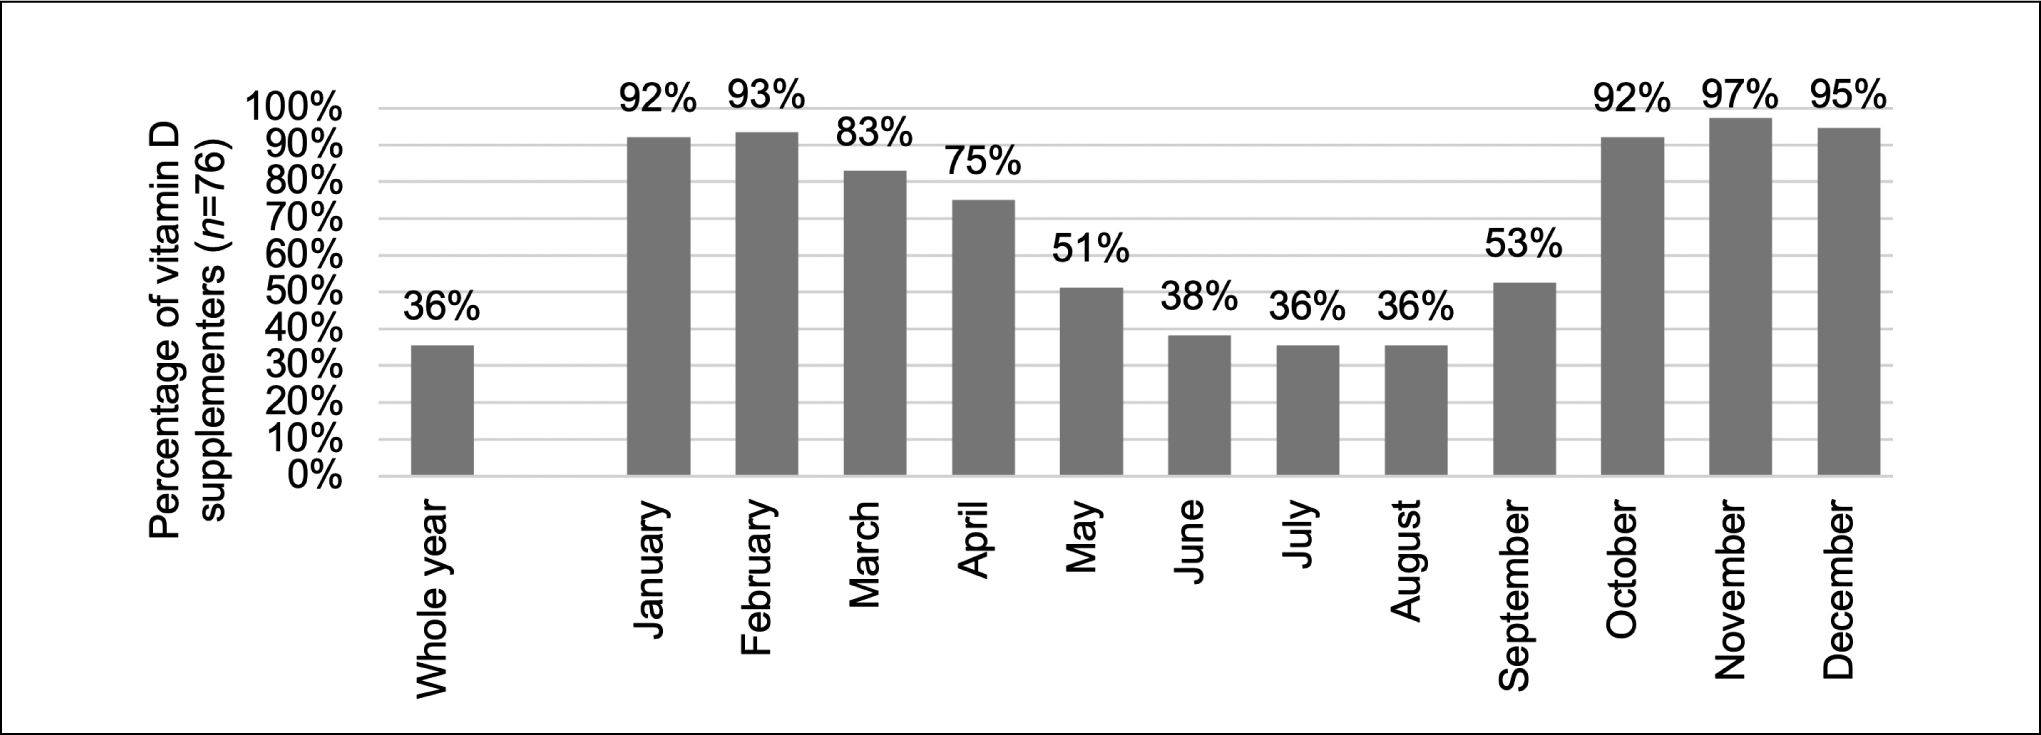
Figure 4.
Seasonal rate of supplementation with vitamin D during the year in premenopausal and postmenopausal women vitamin D supplementers aged 44-65 from the Central Slovenian region (n=76). Participants marked each month individually or chose the whole year.