

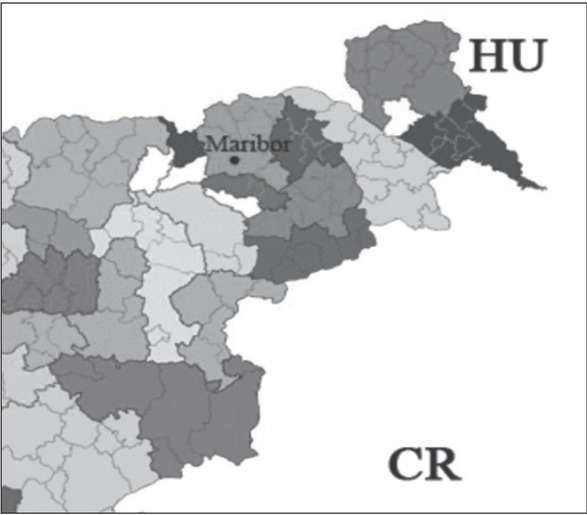
Figure 1
Composition of Slovenian municipalities in LAGs we studied.
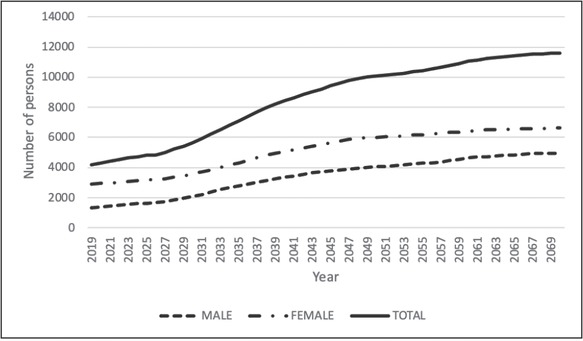
Figure 2a
Demographic projections for 2019–2070 of cohort 80+ in the Posavje region.
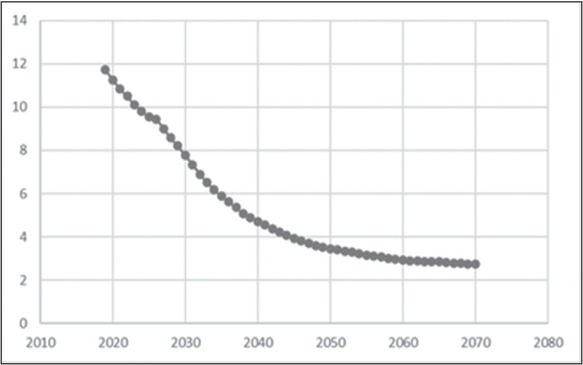
Figure 2b
The ratio between the active population and the population 80+ in the Posavje region.
Table 1
The projection of LTC demand in five LAGs given today’s structure of housing and services based on the no-migration demographic projections.4
| <15 | 15-64 | 65-79 | 80+ | ||||||
|---|---|---|---|---|---|---|---|---|---|
| LAS Posavje | 2019 | 11.149 | 48.958 | 11.273 | 4.179 | 75.559 | 34 | 317 | 1.398 |
| 2050 | 9.210 | 34.888 | 14.019 | 10.066 | 68.184 | 551 | 515 | 2.960 | |
| Growth rate 2050/2019 | -17 | -29 | 24 | 141 | -10 | 62 | 112 | ||
| LAS Goričko 2020 | 2019 | 6.053 | 29.925 | 8.034 | 2.538 | 46.550 | 23 | 156 | 9353 |
| 2050 | 5.036 | 19.387 | 8.893 | 6.376 | 39.692 | 351 | 235 | 2.0203 | |
| Growth rate 2050/2019 | -17 | -35 | 11 | 151 | -15 | 51 | 116 | ||
| LAS Obsotelje in Kozjansko | 2019 | 4.682 | 20.333 | 4.348 | 1.477 | 30.840 | 12 | 115 | 419 |
| 2050 | 3.873 | 14.651 | 5.907 | 4.151 | 28.582 | 221 | 208 | 1.026 | |
| Growth rate 2050/2019 | -17 | -28 | 36 | 181 | -7 | 81 | 145 | ||
| LAS Pri dobrih ljudeh 2020 | 2019 | 4.097 | 19.948 | 5.012 | 1.484 | 30.541 | 13 | 64 | 323 |
| 2050 | 3.411 | 13.115 | 5.937 | 4.144 | 26.607 | 211 | 105 | 771 | |
| Growth rate 2050/2019 | -17 | -34 | 18 | 179 | -13 | 64 | 139 | ||
| LAS Prlekija | 2019 | 5.054 | 23.855 | 6.312 | 1.975 | 37.196 | 15 | 68 | 813 |
| 2050 | 4.187 | 15.984 | 7.034 | 5.059 | 32.264 | 231 | 104 | 1.787 | |
| Growth rate 2050/2019 | -17 | -33 | 11 | 156 | -13 | 53 | 120 |
[i] 1At the same standard of number of nurses per population
2Note that demand is more than 50% higher than existing capacity today in nursing homes- NHs
3Waiting line in LAG Pri dobrih ljudeh and LAG Prlekija is registered in LAG Goričko
4The calculations by authors based on the European population projection 2018 data – no migration scenario.
5Estimate of demand by 2050 (number of persons) assuming the same structure of applicants: 1/4 of the care recipients in the cohort 65-79 and 3/4 among the population 80+ (based on the no migration scenario)
Table 2
Expenditure of municipalities and users in 24 housing units of greenhouse facilities.
| Total | Municipality 70% | |||
|---|---|---|---|---|
| A* | 5/5/3 | 36,608 | 25,626 | 457.6 |
| B** | 3/2/1 | 14,080 | 9,856 | 176 |
| ZN*** | 1/1/1 | 0 | 0 | 0 |
| Integrated care | 2/1/0+1/1/1 | 7,040 | 4,928 | 88 |
[i] *According to the currently valid norms of homecare (see (3) and (22-23)).
**Possible reduction also in the case of the category of care III with the partial help of relatives and volunteers. A high percentage of relatives and volunteers are willing to participate (3).
*** We assume that all patients are members of the health insurance scheme. From the expected structure of care categories and norms in DSO, we summarize the minimum requirements: 1 nurse and two medical technicians, each in their 8-hour shift.
**** Well-organized integrated care with partial help from relatives and norms in the NH for health-insured patients: a: morning; b: afternoon; c: night: a/b/c.
Table 3
Optimal construction dynamics of facilities in Posavje in terms of number of beds.
| Cat.I | Cat.II | Cat.III | Community OS+GH | Nursing home DSO+NH | ||
|---|---|---|---|---|---|---|
| 2020 | 322 | 286 | 100 | 1046 | 735 | 697 |
| 2025 | 348 | 323 | 113 | 1180 | 830 | 787 |
| 2030 | 377 | 365 | 128 | 1332 | 936 | 888 |
| 2035 | 407 | 412 | 144 | 1503 | 1057 | 1002 |
| 2040 | 440 | 465 | 136 | 1696 | 1193 | 1131 |
| 2045 | 476 | 525 | 184 | 1915 | 1346 | 1276 |
| 2050 | 515 | 592 | 207 | 2161 | 1519 | 1441 |
Table 4
Projections of the structure of needs for providers in the Posavje region.
| Year | U | adFH | OS+GH | DSO | NH |
|---|---|---|---|---|---|
| 2025 | 1964 | 0.18 | 0.42 | 0.39 | 0.02 |
| 2030 | 2201 | 0.17 | 0.44 | 0.35 | 0.05 |
| 2035 | 2466 | 0.17 | 0.43 | 0.33 | 0.08 |
| 2040 | 2764 | 0.16 | 0.43 | 0.34 | 0.07 |
| 2045 | 3099 | 0.15 | 0.43 | 0.35 | 0.06 |
| 2050 | 3457 | 0.15 | 0.44 | 0.36 | 0.06 |
Table 5
Staff/user norms in healthcare and the required number of staff per user per unit for OS, GH, and NH.
| Cat. I:II:III= | 39%:14%:47% | ||
|---|---|---|---|
| Nursing technician | 1.98 | 1.59 | 19.74 |
| Senior physio-therapist | 0.18 | 0.15 | 1.32 |
| Graduate of senior nurse | 0.54 | 0.43 | 6.58 |
| B.Sc. Work therapist | 0.19 | 0.15 | 1.98 |
| Nurse-caregiver | 3.12 | 2.5 | 27.72 |
| Server | 0.57 | 0.45 | 0 |
| Specialist doctor | 0.02 | 0.01 | 0.1 |
| Total | 6.6 | 5.28 | 57.42 |
Table 6
The construction dynamics of the assisted living units and the projection of staff needed in the Posavje region.
| U | HC | P+SC*** 0.54/U | U | HC | P+SC*** 0.59/U | No. of OS* | U | HC | P+SC*** 0.54/U | No. of GH** | |
|---|---|---|---|---|---|---|---|---|---|---|---|
| 2025 | 348 | 76.7 | 188 | 202 | 44.4 | 99 | 7 | 103 | 22.7 | 25.8 | 5 |
| 2030 | 377 | 82.9 | 204 | 236 | 51.9 | 115.6 | 8 | 121 | 26.6 | 30.3 | 5 |
| 2035 | 407 | 89.4 | 220 | 259 | 57 | 126.9 | 8 | 132 | 29 | 33 | 6 |
| 2040 | 440 | 96.9 | 238 | 292 | 64.2 | 143.1 | 9 | 149 | 32.8 | 37.3 | 7 |
| 2045 | 476 | 104.8 | 257 | 330 | 72.6 | 161.7 | 10 | 168 | 37 | 42 | 7 |
| 2050 | 515 | 113.3 | 278 | 372 | 81.8 | 182.3 | 12 | 190 | 41.8 | 47.5 | 8 |