

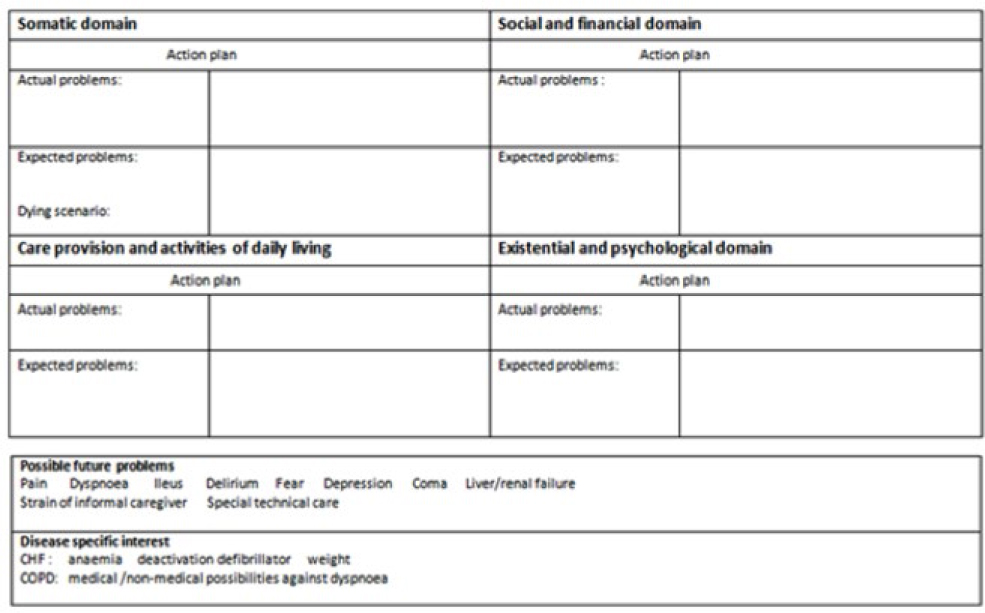
Figure 1
Problems square (Thoonsen et al. 2011 (18)).
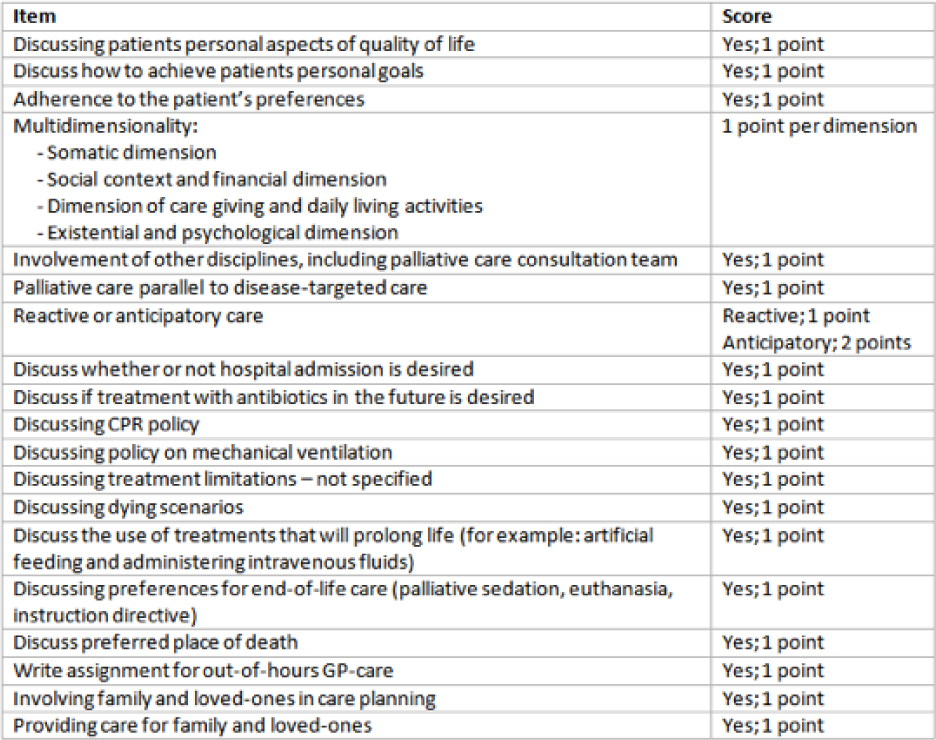
Figure 2
Score form.
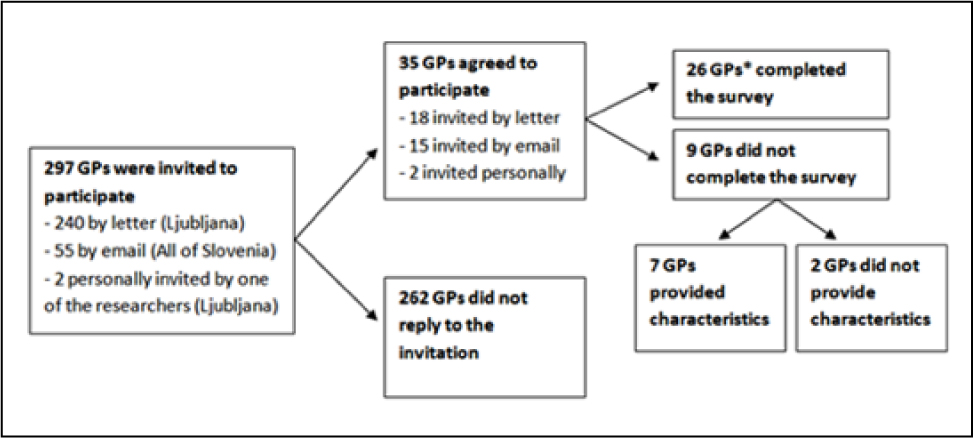
Figure 3
The process of inclusion of general practitioners.
Table 1
Characteristics of participants.
| Age (years±SD) | 48±10.4 |
| Gender: male | 36% |
| Vocational training | 96% |
| Function | |
| • Employee in Healthcare Center | 56% |
| • Independent contract holder | 20% |
| • Employee in practice of independent contract holder | 20% |
| • Other | 4% |
| Type of practice | |
| • Practice in healthcare center | 56% |
| • Solo practice | 32% |
| • Nursing home | 8% |
| • Other | 4% |
| Teaching practice | 64% |
| Workload (hours per week ±SD) | 37±11.0 |
| After hours work (hours per month ±SD) | 20±13.7 |
| Consultation time (minutes per patient ±SD) | 9.5±4.9 |
| Home visits (no. per week ±SD) | 0.9±1.0 |
| Interest in palliative care (scale 1-10 ±SD) | 8.4±1.1 |
| Palliative care skills ( scale 1-10 ±SD) | 6.3±1.6 |
| Plans to improve PC skills | 93% |
Table 2
Answer combinations to SQ1+SQ2 and mean RADIANT scores per case vignette.
| Group 2 (n=8) | Group 3 (n=5) | Group 4 (n=5) | ||||
|---|---|---|---|---|---|---|
| Answer SQ1 | RADIANT score | Q1+SQ2 | RADIANT score | Answers SQ1+SQ2 | RADIANT score | |
| Vignette A | No (n=8) | 3.63 | No+Yes (n=2) | 3.5 | No+Yes (n=1) | 4.0 |
| No+No (n=2) | 1.0 | No+No (n=3) | 3.7 | |||
| Yes+No (n=1) | 0 | Yes+No (n=1) | 2.0 | |||
| Vignette B | No (n=8) | 4.0 | No+Yes (n=5) | 3.0 | No+Yes (n=5) | 4.0 |
| No+No (n=0) | - | No+No (n=0) | - | |||
| Yes+No (n=0) | - | Yes+No (n=0) | - | |||
| Vignette C | No (n=8) | 3.3 | No+Yes (n=0) | - | No+Yes (n=1) | 3.0 |
| No+No (n=4) | 2.0 | No+No (n=3) | 2.7 | |||
| Yes+No (n=1) | 3.0 | Yes+No (n=1) | 2.0 | |||
| Vignette D | No (n=8) | 3.4 | No+Yes (n=2) | 3.0 | No+Yes (n=1) | 5.0 |
| No+No (n=1) | 2.0 | No+No (n=4) | 1.8 | |||
| Yes+No (n=2) | 3.0 | Yes+No (n=0) | - | |||
[i] Abbreviations: GP: general practitioner, SQ1: first surprise question, SQ2: second surprise question, RADIANT score: RADboud ANTicipatory score, a scoring method to quantify the open text content of palliative care plans made by GPs.
Table 3
Mean RADIANT scores* per case vignette in groups 1-4.
| Total | |||||||
|---|---|---|---|---|---|---|---|
| Vignette A | Vignette B | Vignette C | Vignette D | A | E | S | |
| Group 1 (n=8) | 1.9 | 3.3 | 2.0 | 1.5 | 2.2 | 1.7 (n=3) | 2.5 (n=5) |
| Group 2 (n=8) | 3.6 | 4.0 | 3.3 | 3.4 | 3.6 | 3.5 (n=4) | 3.6 (n=4) |
| Group 3 (n=5) | 1.8 | 3.0 | 2.2 | 2.8 | 2.5 | 2.0 (n=4) | 4.3 (n=1) |
| Group 4 (n=5) | 3.4 | 4.0 | 2.6 | 2.4 | 3.1 | 2.8 (n=4) | 4.3 (n=1) |
| Total (n = 26) | 2.7 | 3.6 | 2.5 | 2.5 | - | - | - |
Abbreviations: A: All participants in this study group; E: Participants in this study group that completed the survey in English (n=15); S: Participants in this study group that completed the survey in Slovenian (n=11).
Table 4
Proportions of reactive and anticipatory palliative care plans.
| Vignette A | Vignette B | Vignette C | Vignette D | Total | ||||||
|---|---|---|---|---|---|---|---|---|---|---|
| R | A | R | A | R | A | R | A | R | A | |
| Group 1 (n=8) | 88% | 38% | 100% | 50% | 88% | 25% | 63% | 63% | 84% | 44% |
| Group 2 (n=8) | 100% | 50% | 100% | 50% | 100% | 25% | 100% | 38% | 100% | 41% |
| Group 3 (n=5) | 80% | 80% | 100% | 40% | 100% | 20% | 80% | 40% | 90% | 45% |
| Group 4 (n=5) | 100% | 40% | 100% | 80% | 100% | 40% | 80% | 40% | 95% | 50% |
| Total (n = 26) | 92% | 50% | 100% | 54% | 96% | 27% | 81% | 46% | - | - |
[i] Shows the proportions of care plans that contain reactive and anticipatory aspects for each vignette per study group; Abbreviations: R: reactive care; A: anticipatory care
Table 5
Multidimensional care.
| Somatic | Social / financial | Care giving /ADL* | Existential /psychological | All domains | |
|---|---|---|---|---|---|
| Group 1 | 84% | 9% | 38% | 16% | 9% |
| Group 2 | 94% | 25% | 59% | 31% | 6% |
| Group 3 | 75% | 5% | 25% | 20% | 5% |
| Group 4 | 95% | 10% | 55% | 15% | 0% |
| Vignette A | 89% | 8% | 54% | 4% | |
| Vignette B | 100% | 19% | 54% | 35% | |
| Vignette C | 96% | 15% | 65% | 8% | |
| Vignette D | 65% | 12% | 8% | 35% |
Showing the proportion of care plans that include each of the four dimensions of palliative care for each study group and for each vignette separately and the proportion of care plans in each of the four study groups that include aspects of all four domains.
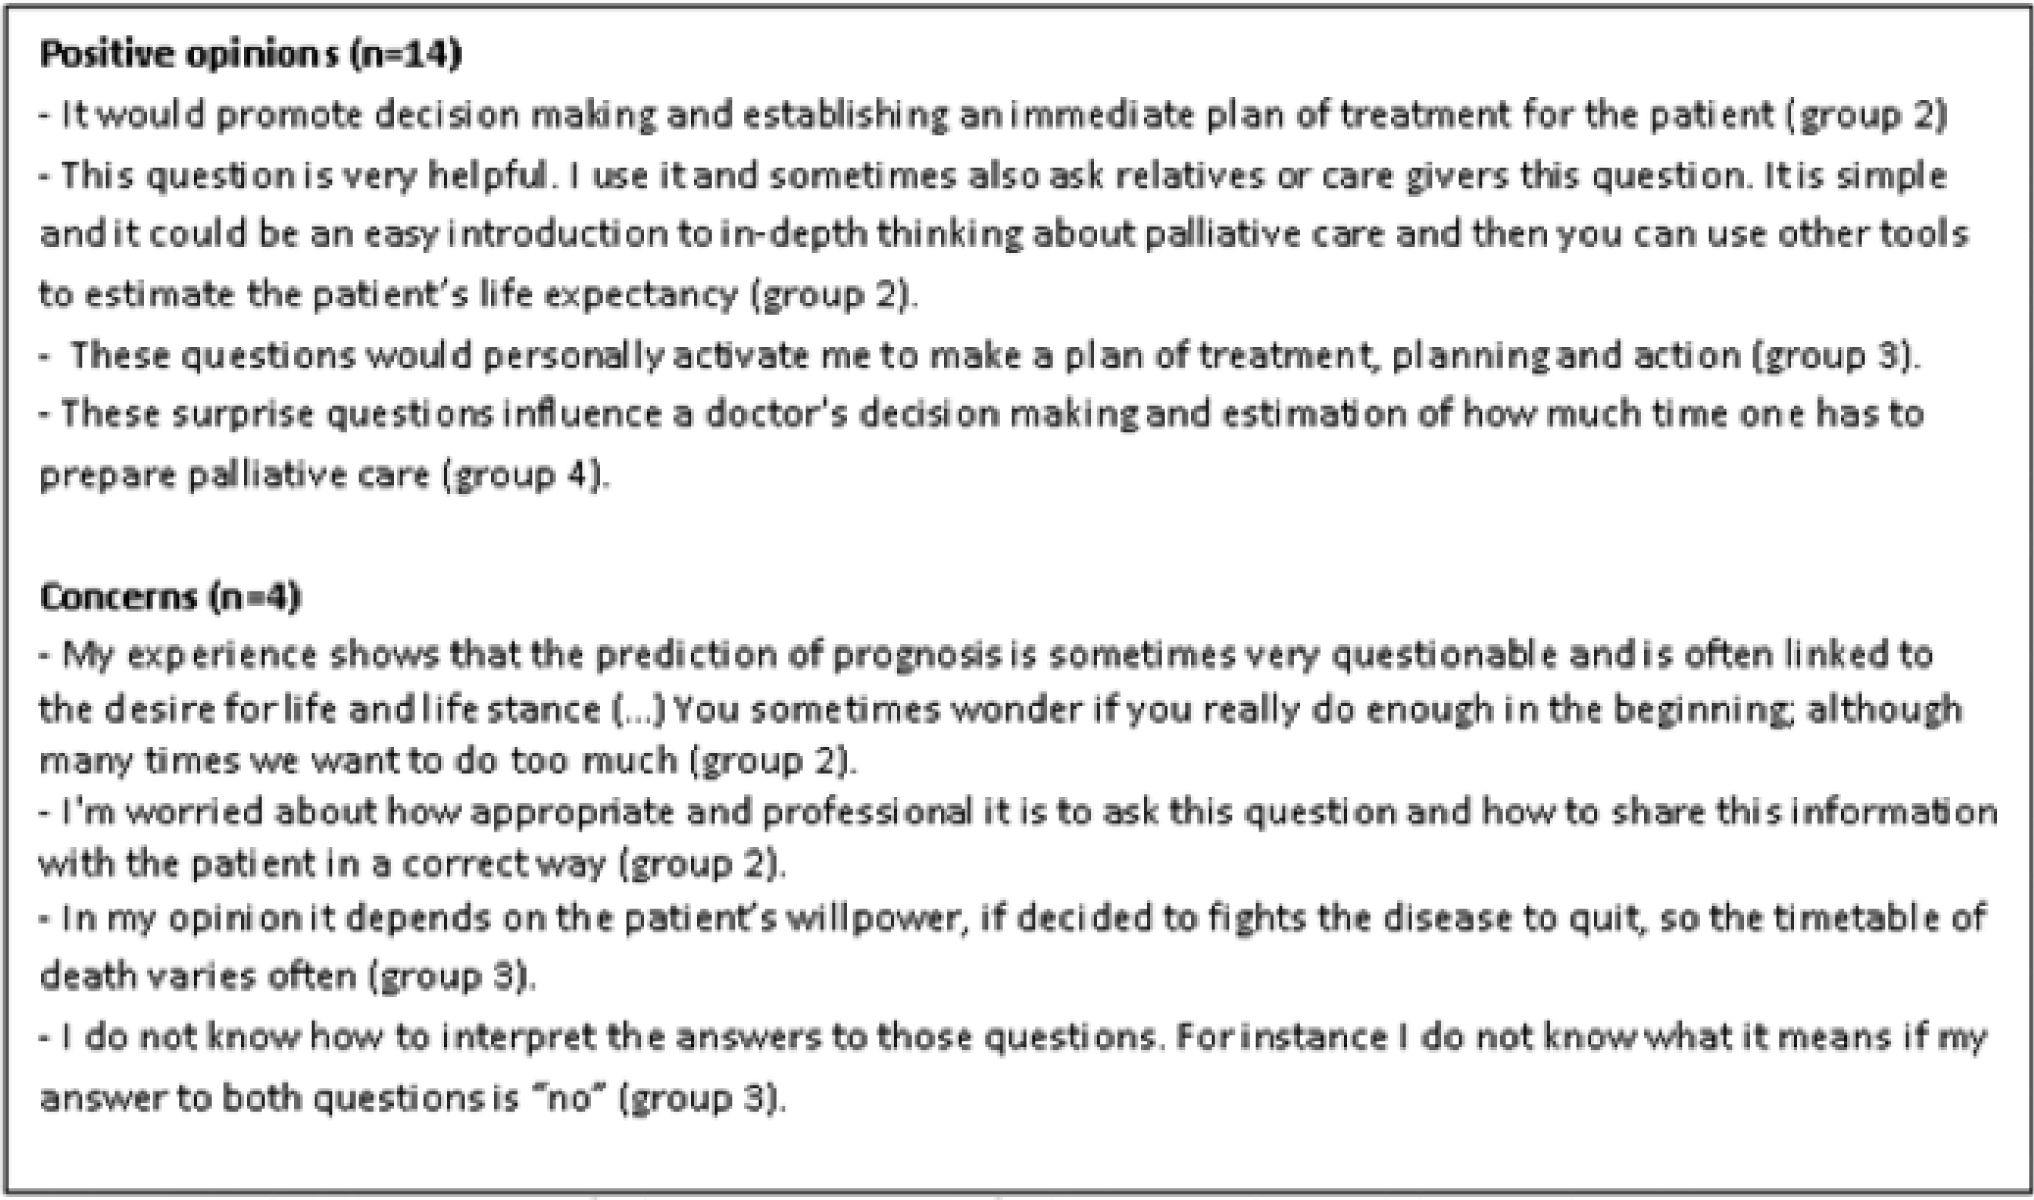
Figure 4
Statements about the usefulness of the first and second surprise questions.