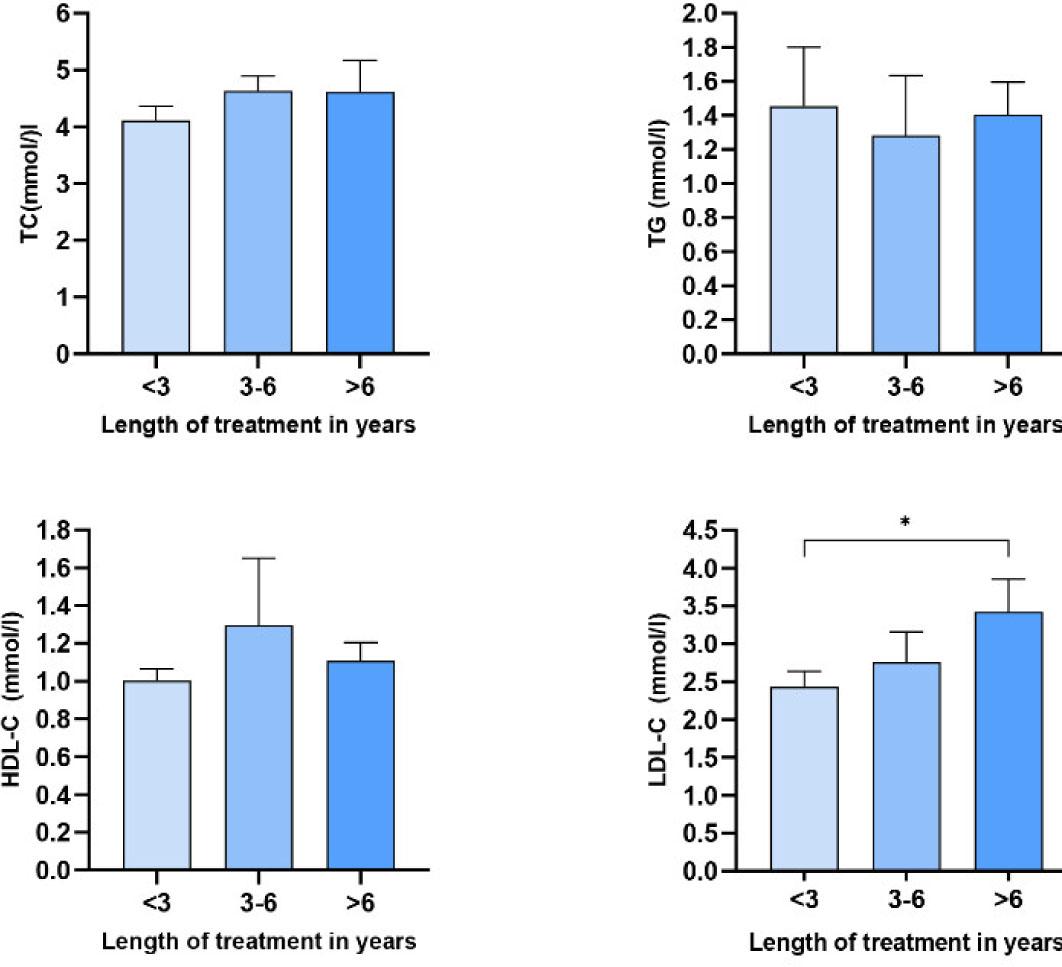
Figure 1.
Values of lipid status parameters in three groups of patients according to the length of treatment with other (non-INSTI) ART. The values are presented as mean ± standard error of the mean (SEM), *denotes a significant difference p<0.05.

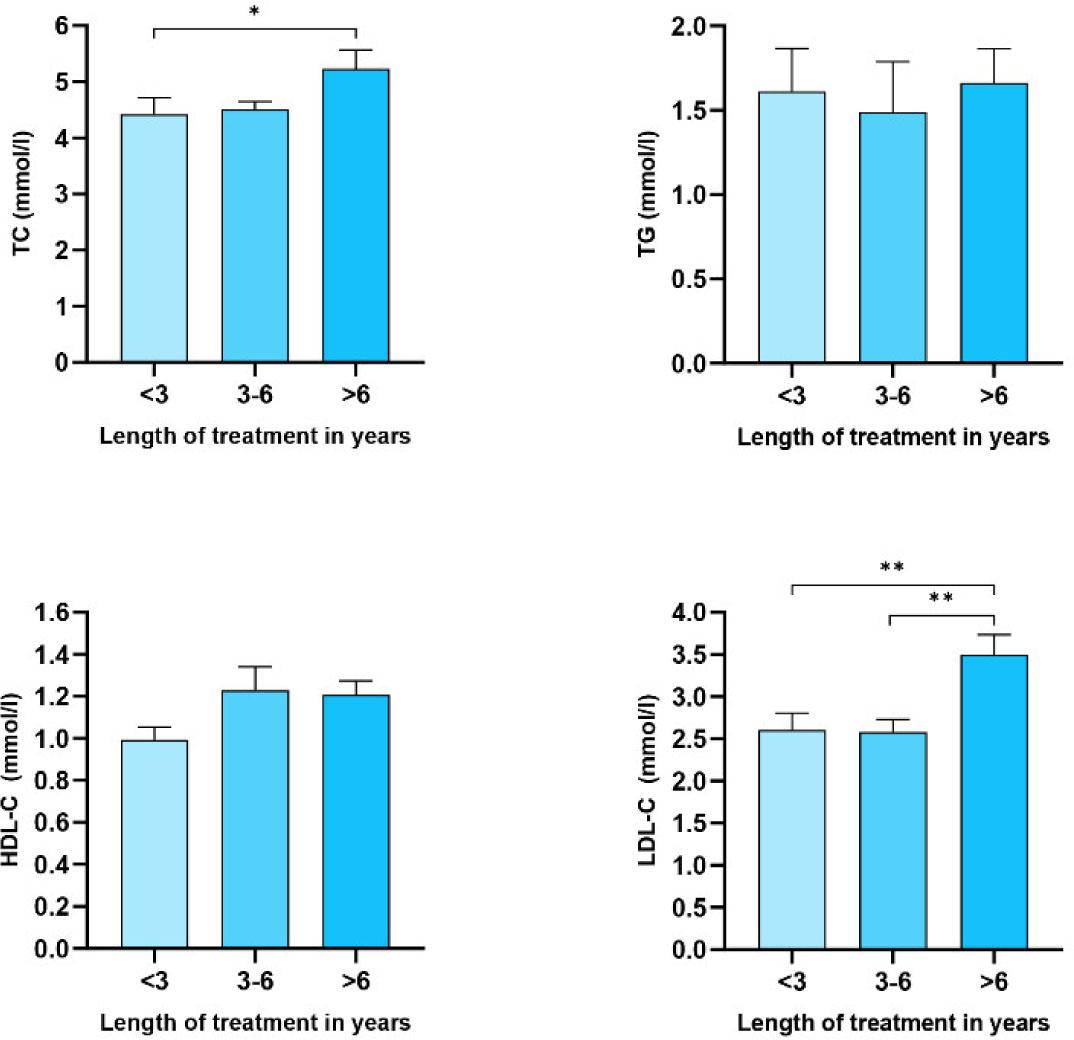
Figure 2.
Values of lipid status parameters in three groups of patients according to the length of all ART administration (INSTI and non-INSTI group). The values are presented as mean ± standard error of the mean (SEM), *denotes a significant difference p<0.05, **denotes a significant difference p<0.01.

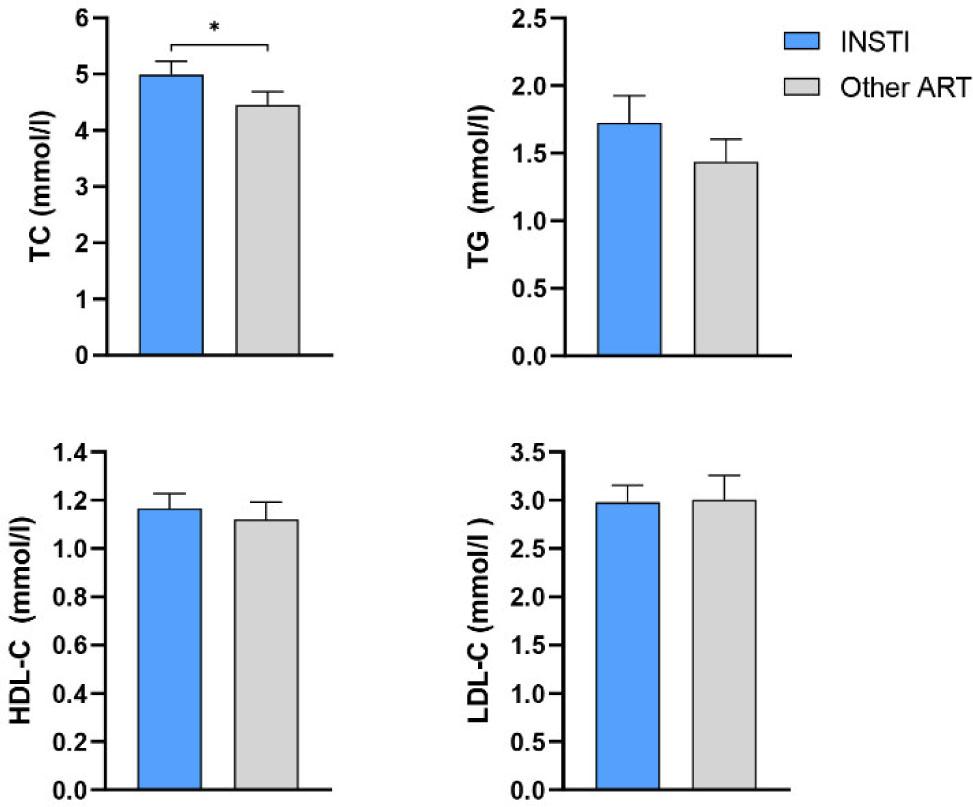
Figure 3.
Values of lipid status parameters in relation to the type of ART applied. The values are presented as mean ± standard error of the mean (SEM), *denotes a significant difference p<0.05.