
TABLE 1.
Frequency of problem areas (in descending order of frequency in total sample)
| Problem area | Illustrative specifications | Girls; n = 44 | Boys; n = 82 |
|---|---|---|---|
| Passive scrolling | Tiktok, Youtube, Streams | 88.6 % | 75.6 % |
| Gaming | Roblox, Fortnite, Minecraft | 11.4 % | 65.9 % |
| Physically inactive | Used to do sports but stopped | 65.9 % | 59.8 % |
| Unfocused | Doesn’t listen, forgetful, absent | 61.4 % | 56.1 % |
| Parent worries | Loneliness, future independence | 56.8 % | 57.3 % |
| Parents not keeping boundaries | Can’t control screen or enforce rules | 59.1 % | 50.0 % |
| Parents stressed | Parents not synced, own mental health | 59.1 % | 48.8 % |
| Somatic concerns | Tired, headaches, nausea | 63.6 % | 36.6 % |
| Sad | Low self-esteem, self-critical | 61.4 % | 35.4 % |
| Parent too accommodating | Avoids conflicts, doesn’t work | 52.3 % | 31.7 % |
| No IRL friends | No initiatives, online friends only | 34.1 % | 48.8 % |
| Insomnia | Goes to bed late, awakenings | 45.5 % | 32.9 % |
| Unhealthy eating | Skips meals, very selective | 45.5 % | 32.9 % |
| School too hard | Unstructured, oral instructions | 34.1 % | 22.0 % |
| Aggressive | Yells insults, breaks things | 27.3 % | 26.8 % |
| No IRL interests | Never had any, interest stopped | 18.2 % | 32.9 % |
| Social anxiety | Avoids peers, avoids new people | 27.3 % | 15.9 % |
| School absence | Often late, doesn’t go at all | 25.0 % | 13.4 % |
| Socially awkward | Eye-contact, quiet, childish | 20.5 % | 15.9 % |
| Active on social media | Snapchat, Discord, Tiktok | 31.8 % | 3.7 % |
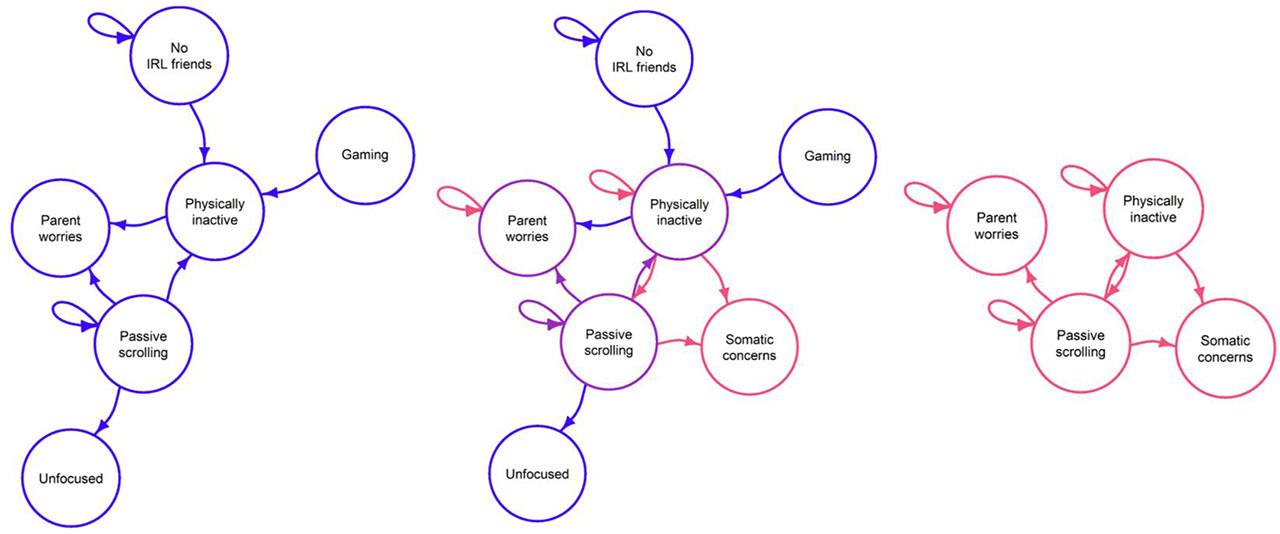
Figure 1.
Averaged network for boys (64 % of sample, blue, left) and girls (34 % of sample, red, right). For each network, only the eight most common perceived causal relations and their connecting nodes are visualized: for boys the eight most frequently perceived causal relations connected six different nodes, for girls the eight most frequently perceived causal relations connected four different nodes. In the middle is a combined network overlaying the two (purple being nodes and edges common on both groups).
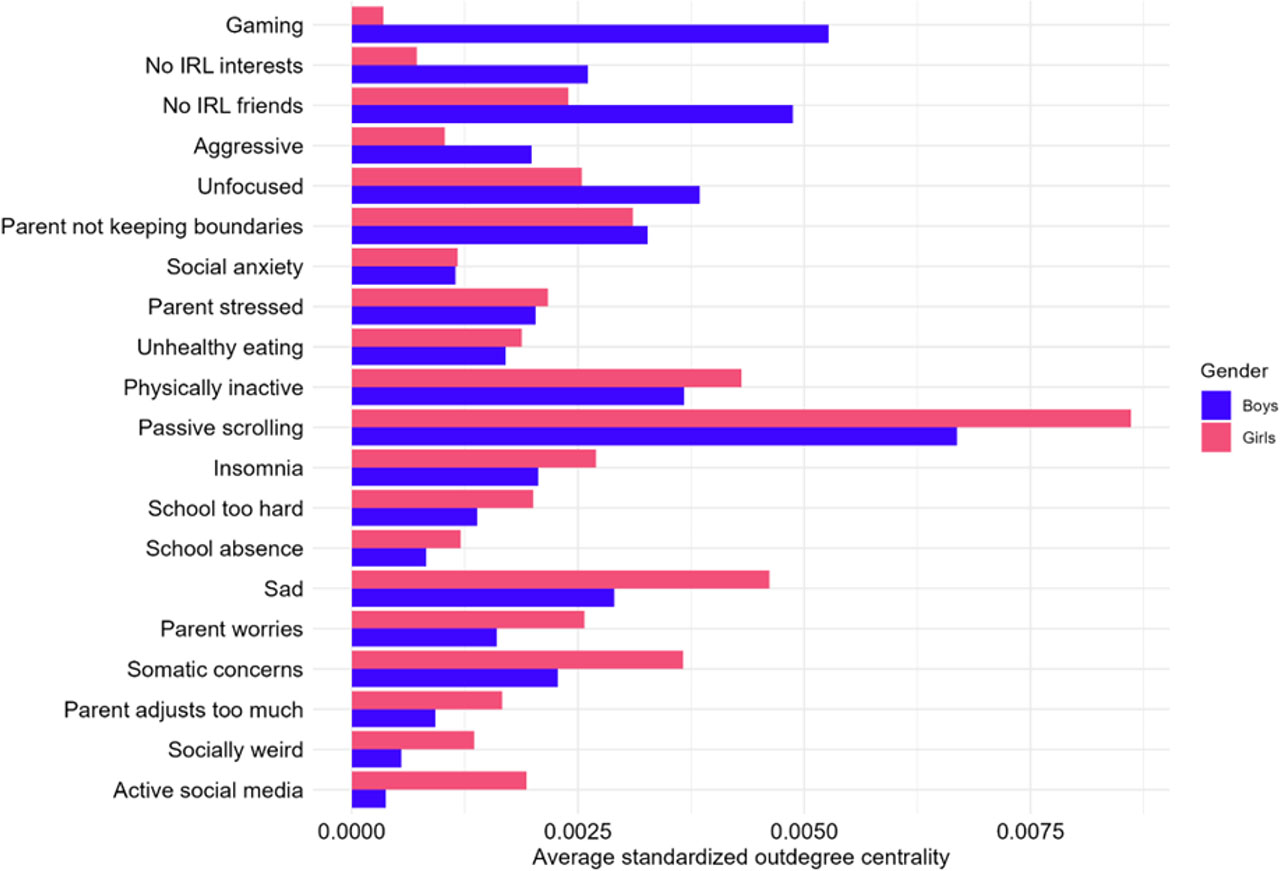
Figure 2.
Group-level out-degree centralities, split by gender and sorted by gender difference.