
Table 1:
Summary of conducted research studie.
| Author | Year | Objective | Type |
|---|---|---|---|
| Nakai et al. | 1997 | Investigate the effect of 3D and expansion on ground movements during tunnel excavation | Experimental |
| Dyne | 1998 | Analyze the different parameters: the opening of the cavity, the width of the cavity, and the height of the covering | Experimental 2D scale model |
| Burd et al. | 2000 | Study soil-structure interaction during tunneling under masonry structures and analysis | Numerical MEF-OXFEM |
| Laefer | 2001 | Study the damage to structures on shallow foundations subject to soil movements induced by excavation | Experimental (a small-scale model of 1/10th). |
| Mahamma | 2002 | Study the soil-structure interaction phenomena during the collapse of a mine gallery. The collapse of the mine gallery was modeled by successive sinking of a cylinder along the axis of propagation of the rupture | Experimental |
| Shanin et al. | 2004 | The study of the effect of ground movements and their mechanical behavior during tunnel excavation. | Experimental trap model |
| Boumalla | 2005 | Vary a number of parameters such as the opening of the cavity, the height of the cover, the rate of initiation of a melt, or the subsidence of the ground | Experimental |
| Sung et al. | 2006 | Analyze the settlements and ground pressure at the surface due to the tunnel in the cases without and with the foundation structure in the vicinity. | Experimental |
| Castro et al. | 2007 | Study the “block caving” mining method, not the movements that occur on the surface of the land | Experimental large-scale 3D model |
| Trueman et al. | 2008 | ||
| Lee & Bassett | 2007 | Simulate the deformation of the tunnel by changing its diameter, to investigate the behavior of existing foundations located near the tunnel | Experimental |
| Kikumoto et al. | 2009 | ||
| Caudron | 2007 | Characterize the influence of soil-structure interaction during the formation of a sinkhole | Experimental and numerical |
| Deck and Anirudth | 2010 | To investigate the phenomenon of soil-structure interaction due to mine subsidence, taking into account the influence of length, rigidity of the structure, mechanical properties of the soil, and intensity of subsidence. | Numerical 2D model CESAR LCPC |
| Boramy Hor | 2012 | Simulate ground movements and their consequences on the surface. | Experimental/numerical 3D physical model |
| Al Heib et al. | 2013 | Understanding sinkhole consequences on masonry structures using a large small-scale physical modeling. The paper presents the main results of the small-scale physical model designed to study the consequences of subsidence on structures. Present the transfer of movements from the soil to the structure. The objective is to understand and then to predict the real behavior and the damage of structures on subsidence areas. | Experimental |
| Nghiem et al. | 2014 | Physical model for damage prediction in structures due to underground excavations: a small-scale physical model (1/40 scale factor on the dimensions) under normal gravity. It has been designed for developing and validating experimentally new methods of prediction of damages to masonry structures induced by subsidence (generally resulting from underground excavations of tunnels and mines) | Experimental |
| Keawsawasvong | 2021 | Limit analysis solutions for spherical cavities in sandy soils under overloading. An investigation on the stability of spherical cavities in sandy soils under overloading at the ground surface is carried out in this study. By using finite element limit analysis, a spherical cavity is numerically simulated under an axisymmetric condition, and the lower and upper bound solutions of the stability of spherical cavities can be obtained | Numerical |
| Yongyao et al. | 2023 | A numerical simulation study on the evolutionary characteristics of the damage process of karst soil cavity under positive pressure effect | Numerical |
| Keba and Isobe | 2024 | Bearing capacity of a shallow foundation above the soil with a cavity based on a rigid plastic finite element method. Based on the rigid plastic finite element method (RPFEM), this study investigates the performance of the footing on the soil with a cavity. The RPFEM is used in plane strain conditions and necessitates only a few materials to predict the bearing capacity: the unit weight of the soil, the cohesion, the shear resistance angle, and the dilation angle | Numerical |
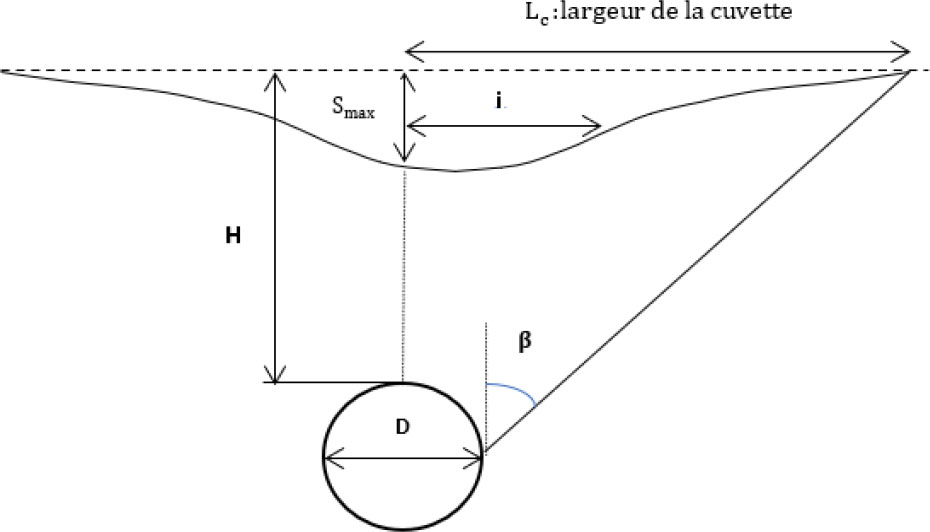
Figure 1:
Schematic diagram of the empirical approach by Peck (1969).
Table 2:
Empirical formulas for determining i (Dolzhenko, 2002).
| Authors | Proposed expression | Soil type | Calculated i value |
|---|---|---|---|
| Atkinson & Potts. (1977) | i = 0.25(1.5C + D) | Dense sands with surcharge | 3.65 m |
| Oteo & Sagaseta. (1982) | i = 0.525H + 0.42R | Granular soils | 5.67 m |
| Dyer et al. (1986) | i = 0.29H | Loose to medium dense sand | 2.60 m |
| Al Abram (1998) | i = 0.15H + 0.5D | Analogical soil | 3.60 m |
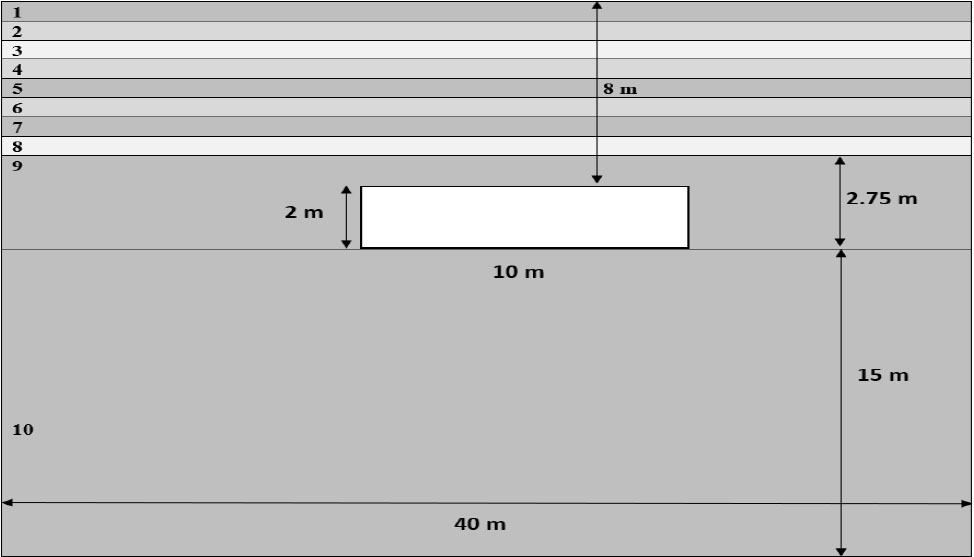
Figure 2:
Real model of the cavity.
Table 3:
Geo-mechanical characteristics of different materials (Caudron, 2007).
| Layer | Materials | E (MPa) | υ | Rtraction (MPa) | Cohesion (MPa) | φ (°) |
|---|---|---|---|---|---|---|
| 8 | Marls | 70 | 0.25–0.30 | 0.30 | 0.80 | 28 |
| 2 and 5 | Stones | 100 | 0.25–0.30 | 0.30 | 0.80 | 29 |
| 6 | Clay sand | 130 | 0.25–0.30 | 0.20 | 1.2 | 30 |
| 3 and 9 | Limestone | 20 | 0.25–0.30 | 0.80 | 2.00 | 31 |
| 7 | Stones | 200 | 0.25–0.30 | 01 | 1.00 | 35 |
| 4 | Marls | 50 | 0.25–0.30 | 0.1 | 0.20 | 26 |
| 1 | Stones | 50 | 0.25–0.30 | 0.20 | 0.40 | 27 |
Table 4:
List of similarity laws.
| Number | Similarity law | Meaning of scale factors |
|---|---|---|
| 1 | x*/L*=1 | Equality of coordinates relative to length scale |
| 2 | U*/L*=1 | Equality of displacements relative to length scale |
| 3 | U0*/L*=1 | Equality of displacements at origin relative to length scale |
| 4 | g*/γ*=1 | Equality of acceleration scale to gravity scale |
| 5 | E*L*2/F*=1 | Conservation of the ratio of elasticity modulus scale by length squared to force scale |
| 6 | Y*t*2/L*=1 | Identity of acceleration and length scales as time cannot be altered |
| 7 | P*L*2/F*=1 | Conservation of the ratio of pressure scale times length squared to force scale |
| 8 | (σ0*L*2)/F*=1 | Conservation of the ratio of stress scales times length squared to force scale |
| 9 | (ρ*γ*L3*)/F*=1 | Conservation of the ratio between scales of quantities determining inertia force relative to force scale |
Table 5:
List of scale factors.
| Symbol | Scale factor concerned | Dimension | Value |
|---|---|---|---|
| L* | Length of reference | L | 1/40 |
| x* | Coordinates | L | 1/40 |
| E* | Modulus of elasticity | ML−1 t−2 | 3/40 |
| ρ* | Density | ML−3 | 3 |
| g* | Acceleration of gravity | Lt−2 | 1 |
| F* | External punctual force | MLt−2 | 3/64000 |
| p* | Superficial force | ML−1 t−2 | 3/40 |
| U* | Displacement | L | 1/40 |
| σ* | Constraint | ML−1 t−2 | 3/40 |
| γ* | Inertia acceleration | Lt−2 | 1 |
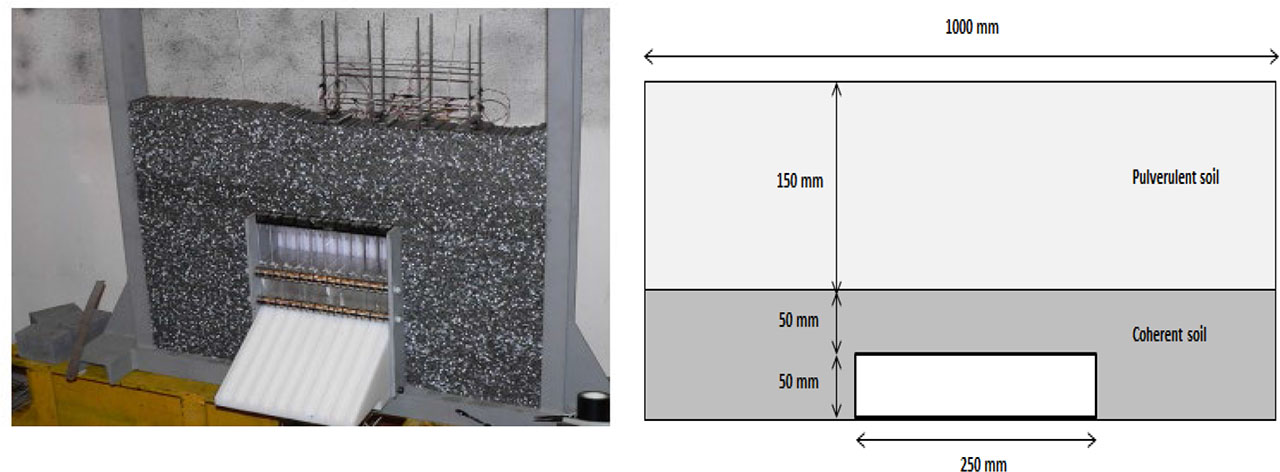
Figure 3:
Experimental scale model.
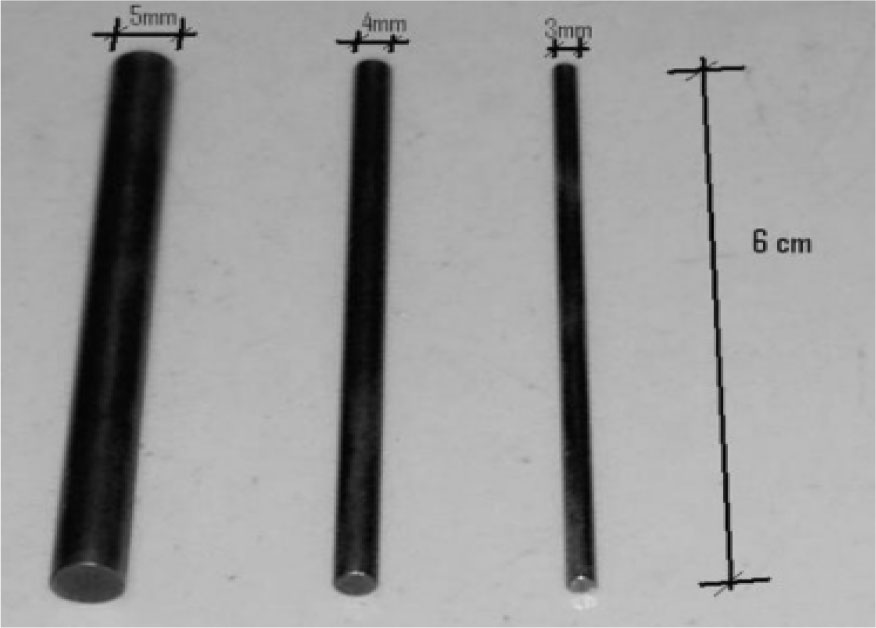
Figure 4:
Overview of Schneebeli rolls.
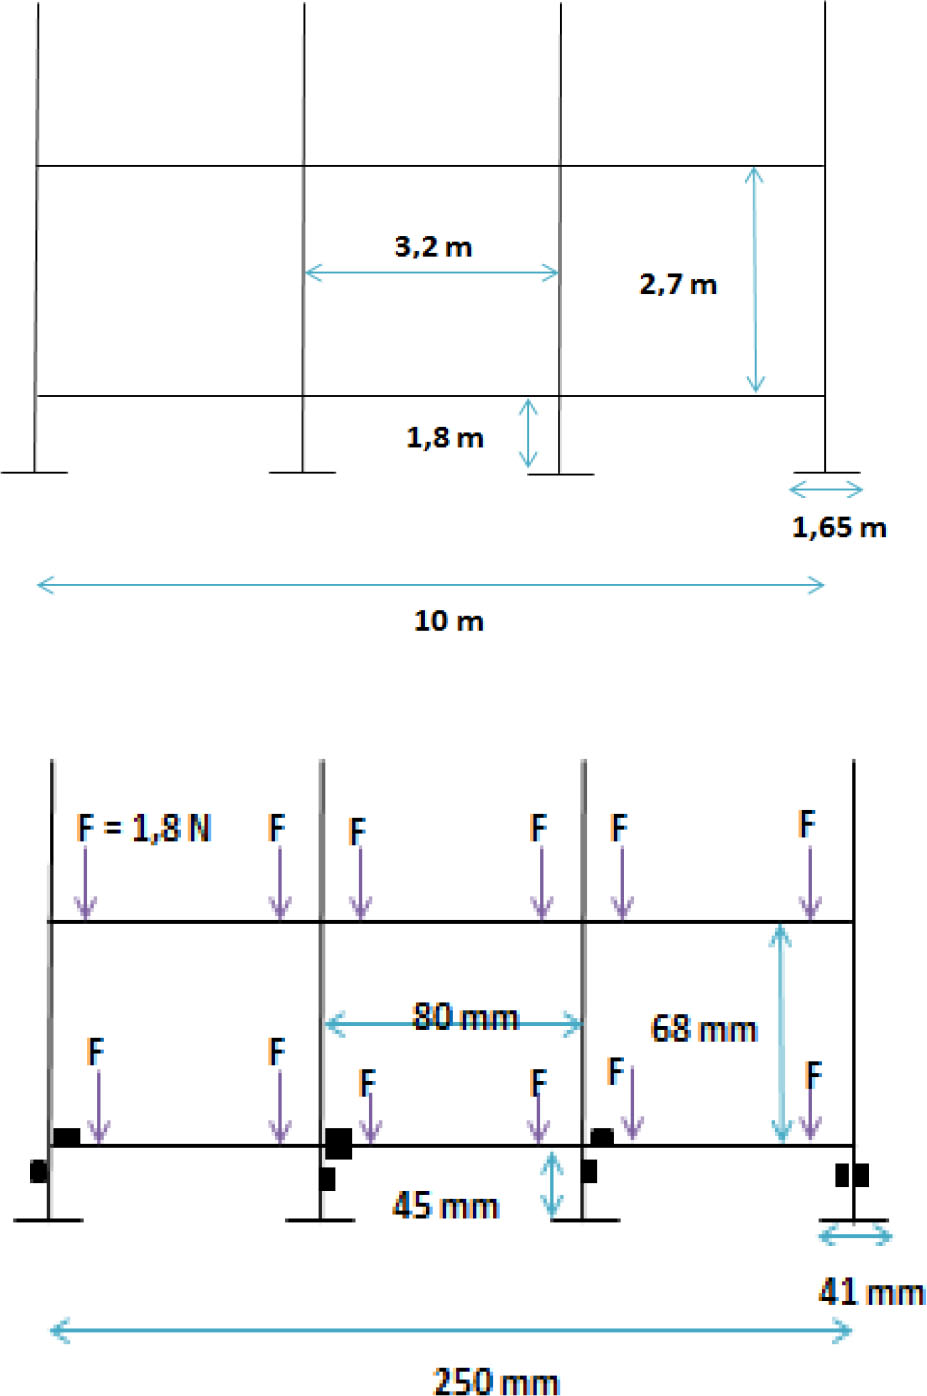
Figure 5:
Real and scale model of the structure (Caudron et al, 2007).
Table 6:
Structure characteristics in real size and scale model.
| Real model | Scale model | |
|---|---|---|
| Module (MPa) | 33000 | 2475 |
| Section (m2) | 0.04 | 25×10−6 |
| Inertia (m4) | 1.33×10⁻⁴ | 52×10−12 |
| Loading (kPa) | 10 | 0.75 |
Table 7:
Geo-mechanical characteristics of scale model soils.
| Characteristics | Unit | Pulverulent soil | Coherent soil |
|---|---|---|---|
| Young's modulus (E) | MPa | 50–100 | 50–100 |
| Friction angle (φ) | ° | 26 | 28–30 |
| Cohesion (c) | KPa | ≈ 0 | ≈200 |
| Poisson's ratio (ν) | / | 0.3 | 0.3 |
| Density (ρ) | kg/m3 | 2200 | 2200 |
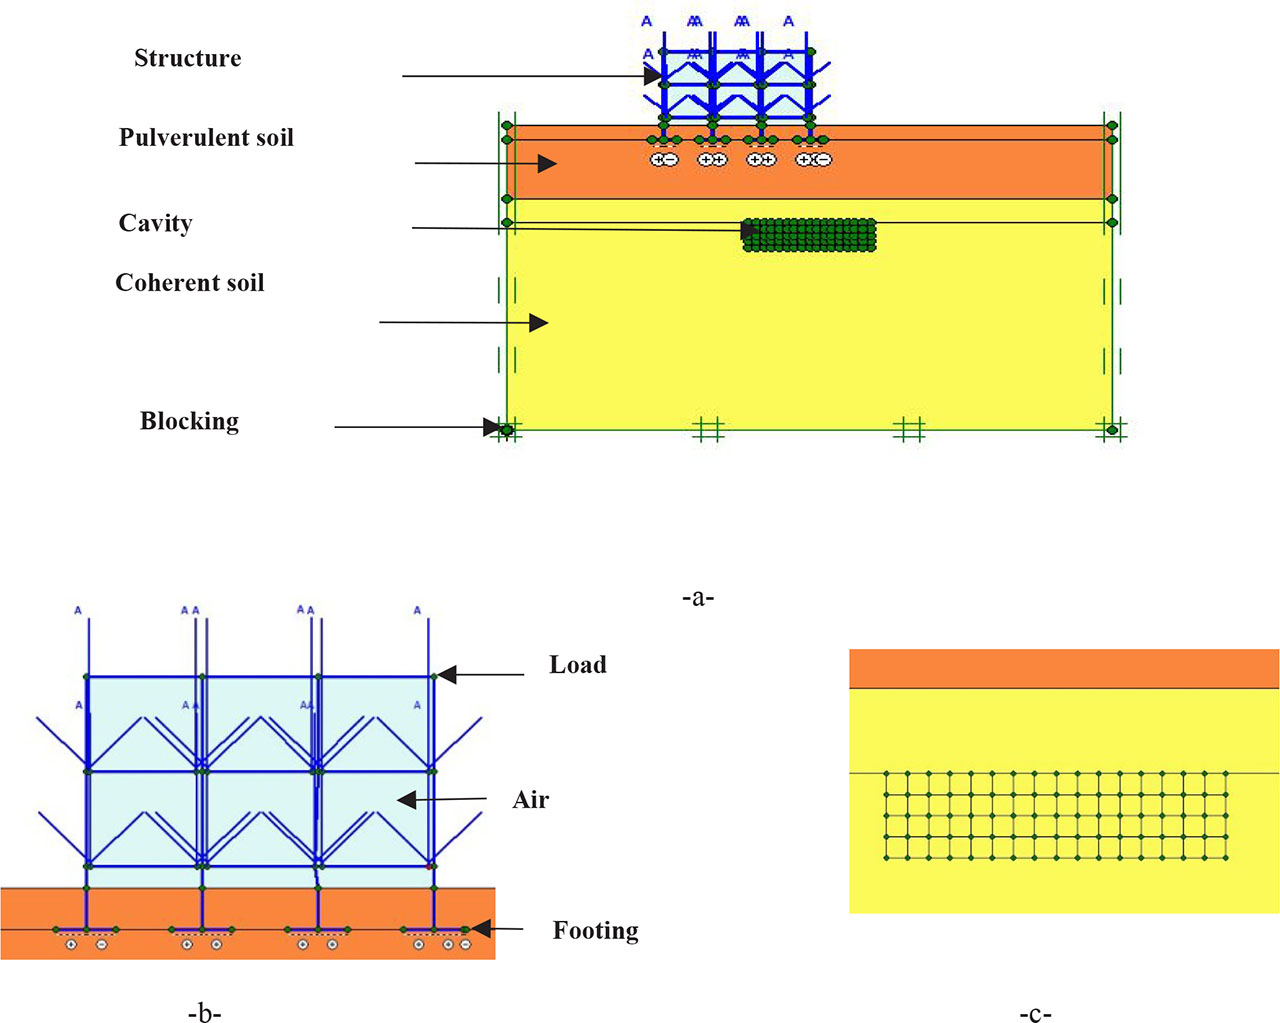
Figure 6:
Model geometry: (a) global geometry, (b) structure, and (c) cavity diagramming.
Table 8:
Soil properties.
| Parameters | Name | Unit | Pulverulent soil | Coherent soil | Air |
|---|---|---|---|---|---|
| Material model | Model | - | Mohr-Coulomb | Mohr-Coulomb | Mohr-Coulomb |
| Material type | Type | - | Drained | Drained | Drained |
| Soil unit weight above phreatic level | γunsat | kN/m3 | 17 | 20 | 5 |
| Soil unit weight below phreatic level | γsat | kN/m3 | 19 | 22 | 5 |
| Permeability in horizontal direction | kx | m/day | 1 | 0 | 1 |
| Permeability in vertical direction | ky | m/day | 1 | 0 | 1 |
| Young's modulus | E | kN/m2 | 100000 | 100000 | 5 |
| Poisson's ratio | ν | - | 0.3 | 0.3 | 0.1 |
| Cohesion | c | kN/m2 | 2 | 200 | 1 |
| Friction angle | φ | ° | 26 | 26 | 5 |
| Dilatancy angle | ψ | ° | 7 | 9 | 1 |
| Strength reduction factor interne | Rinter | - | 1 | 1 | 1 |
Table 9:
Properties of structural elements.
| Parameters | Name | Unit | Value |
|---|---|---|---|
| Type of behavior | Material type | - | Elastoplastic |
| Normal stiffness | EA | kN/m | 132000 |
| Flexural rigidity | EI | KNm2/m | 4389 |
| Equivalent thickness | d | m | 0.632 |
| Weight | w | KN/m/m | 10 |
| Poisson's ratio | ν | - | 0.35 |
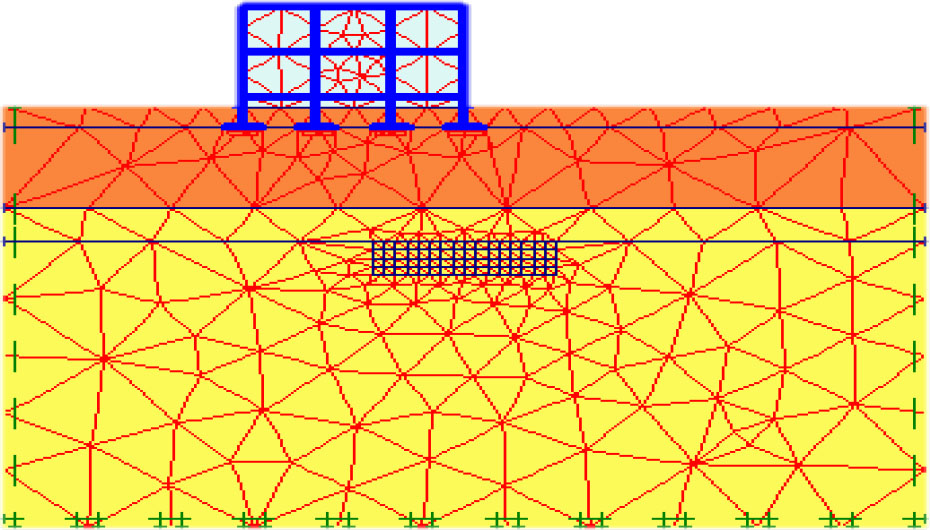
Figure 7:
Model meshing.
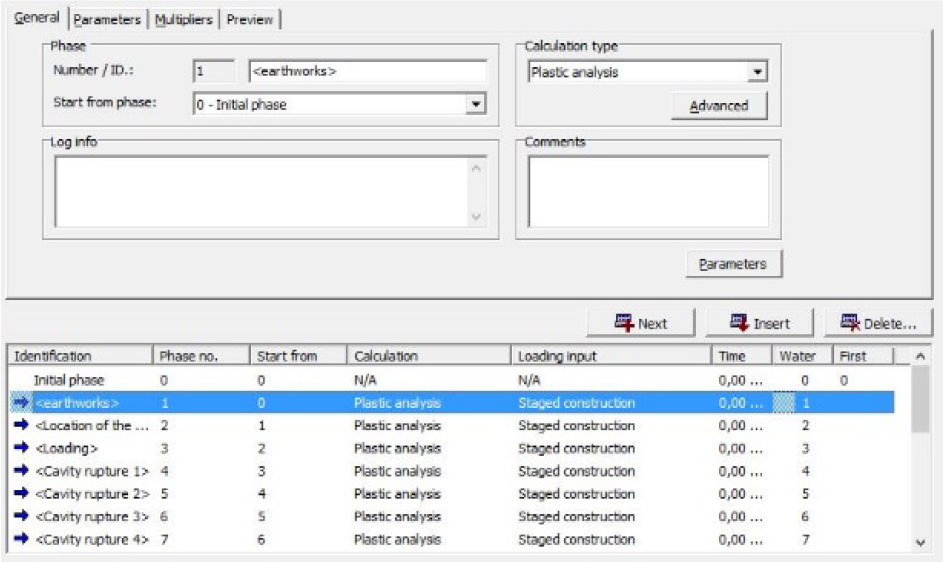
Figure 8:
Calculation phases.
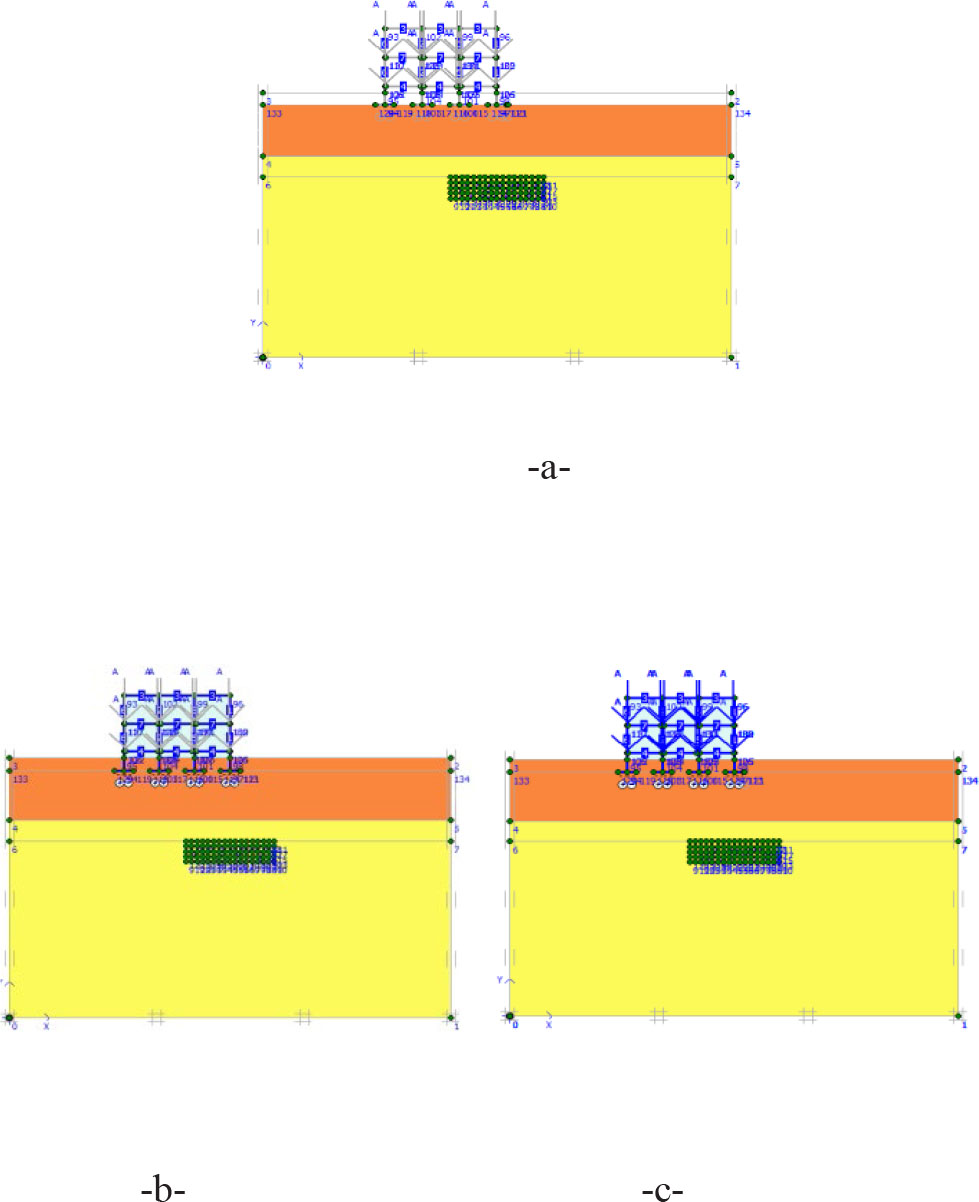
Figure 9:
Phases 1, 2, and 3: (a) Phase 1 (excavation), (b) Phase 2 (soil + structure), and (c) Phase 3 (loading).
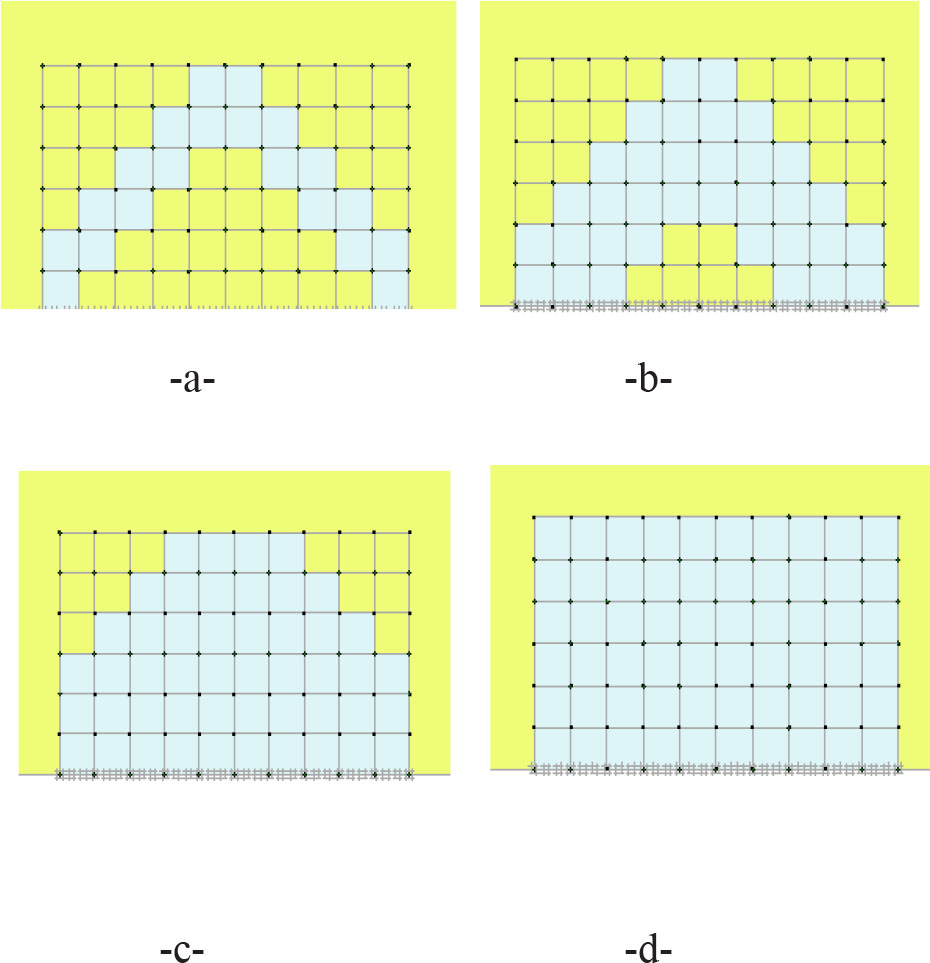
Figure 10:
Cavity rupture process.
(a) Phase 4 (initial cavity rupture)
(b) Phase 5 (2nd cavity rupture)
(c) Phase 6 (3rd cavity rupture)
(d) Phase 7 (total cavity rupture)
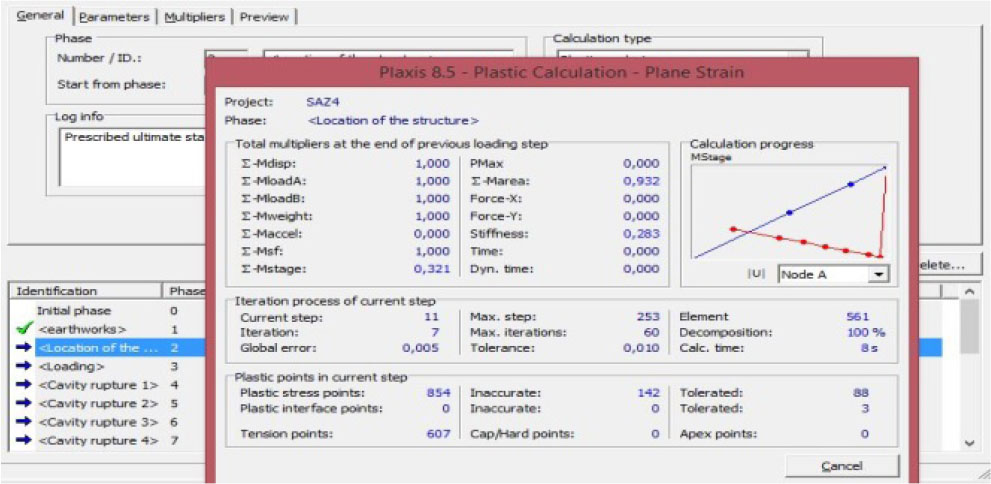
Figure 11:
Calculation launch.
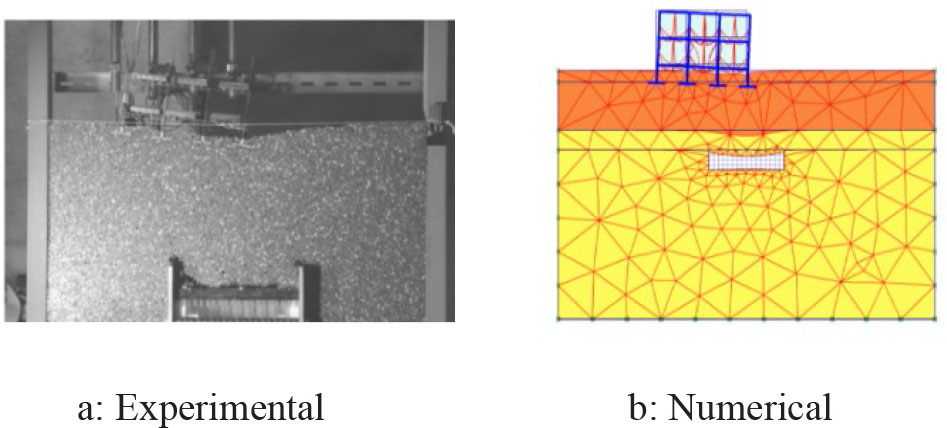
Figure 12:
Final phase of rupture.
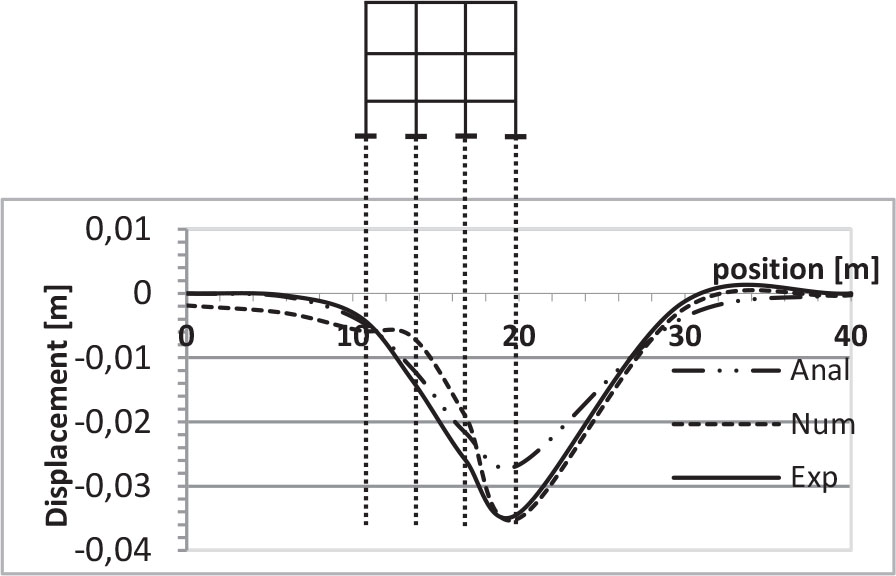
Figure 13:
Vertical displacements (numerical, experimental, and analytical) of the footing.
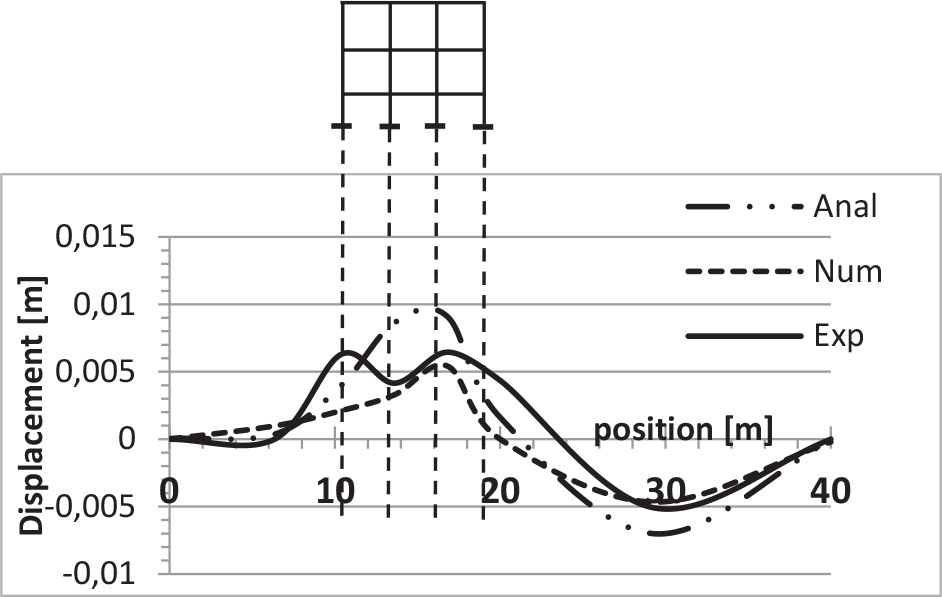
Figure 14:
Horizontal displacements (numerical, experimental, and analytical) of the footings.
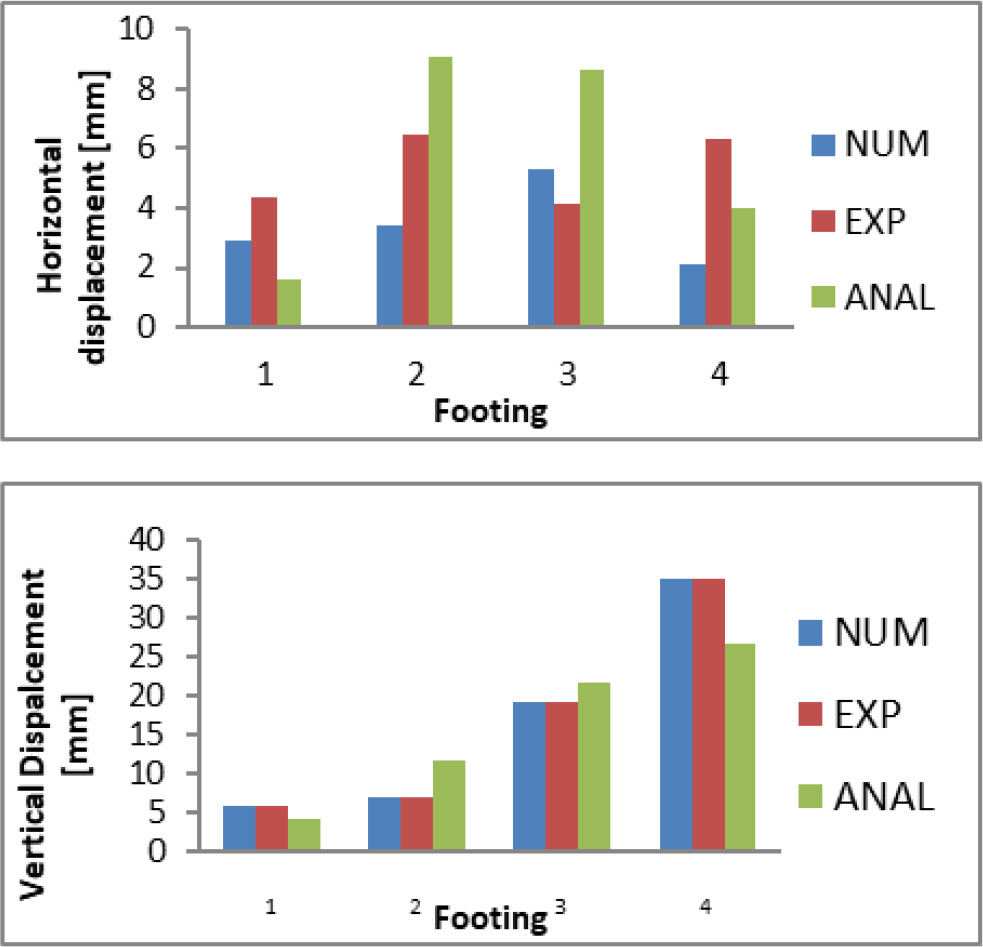
Figure 15:
Differences in displacements of each footing among the three methods.
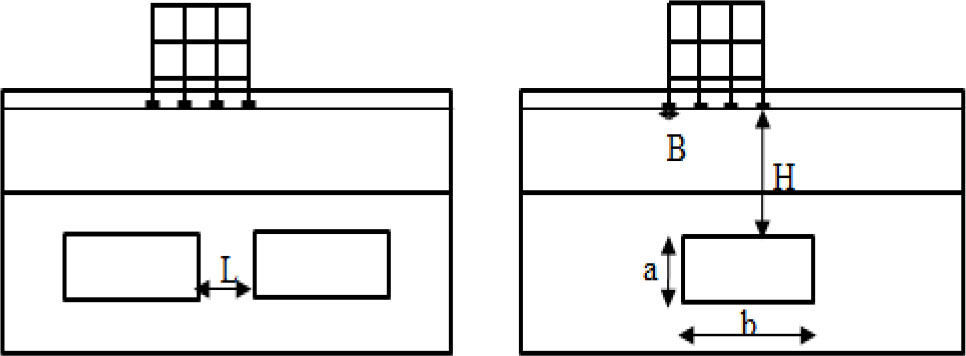
Figure 16:
Models used in this study: (B) width of the footing, (H) depth of the cavity, (L) cavity spacing, (a) cavity height, and (b) cavity width.
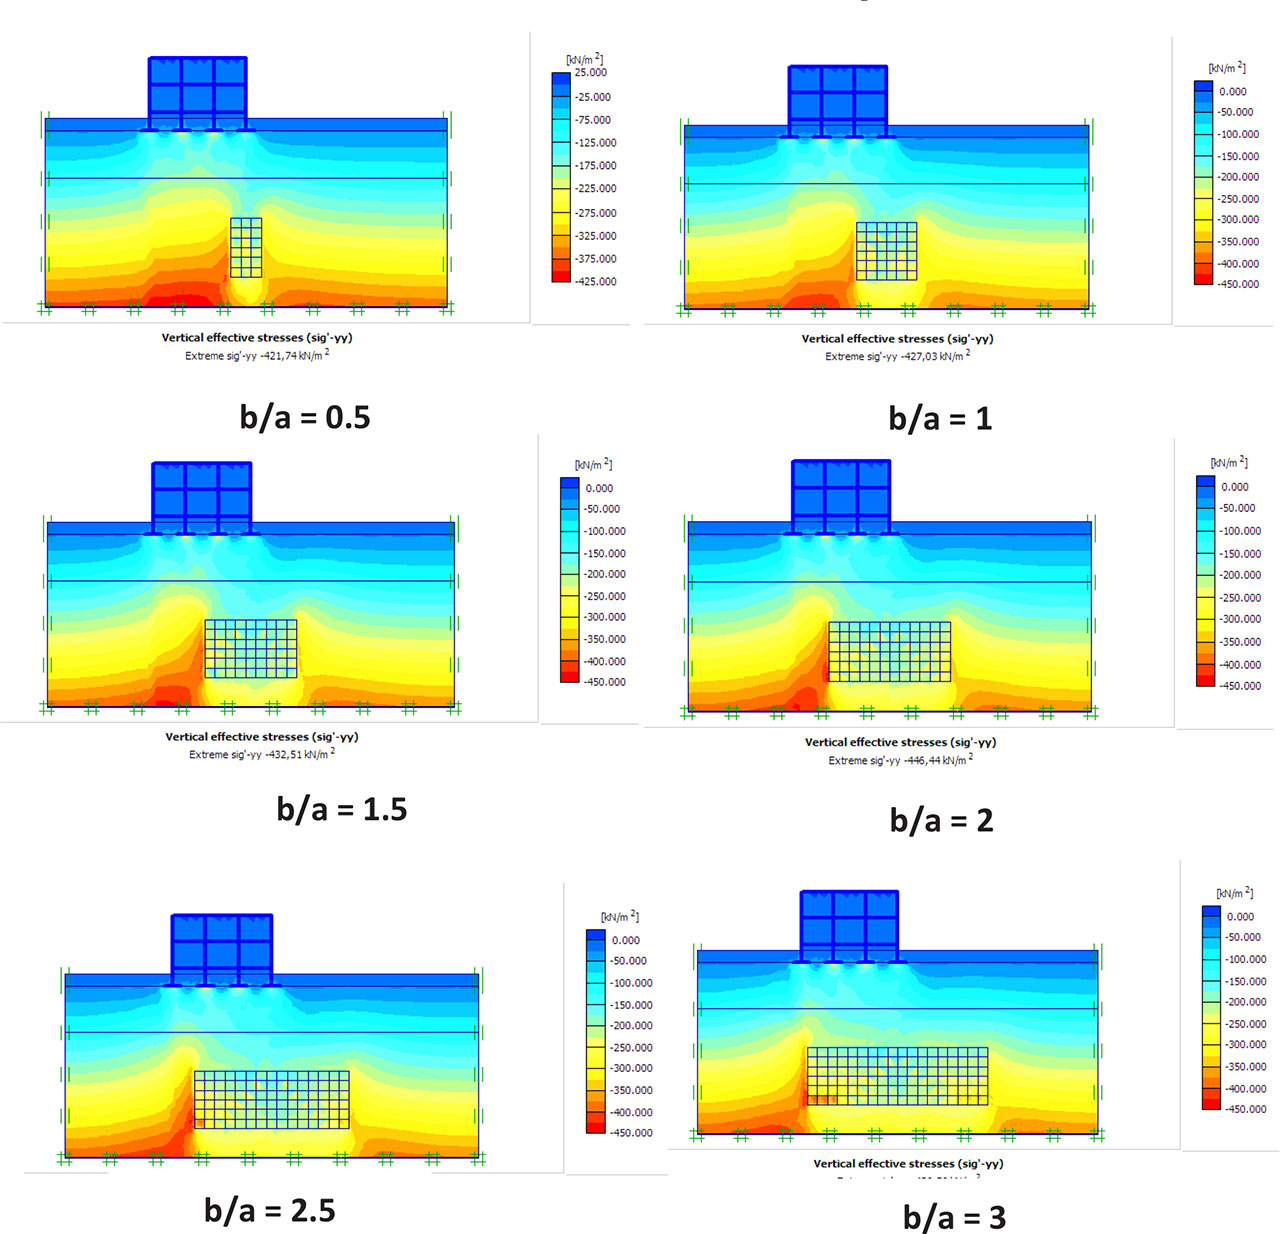
Figure 17:
Stress in the yy plane.
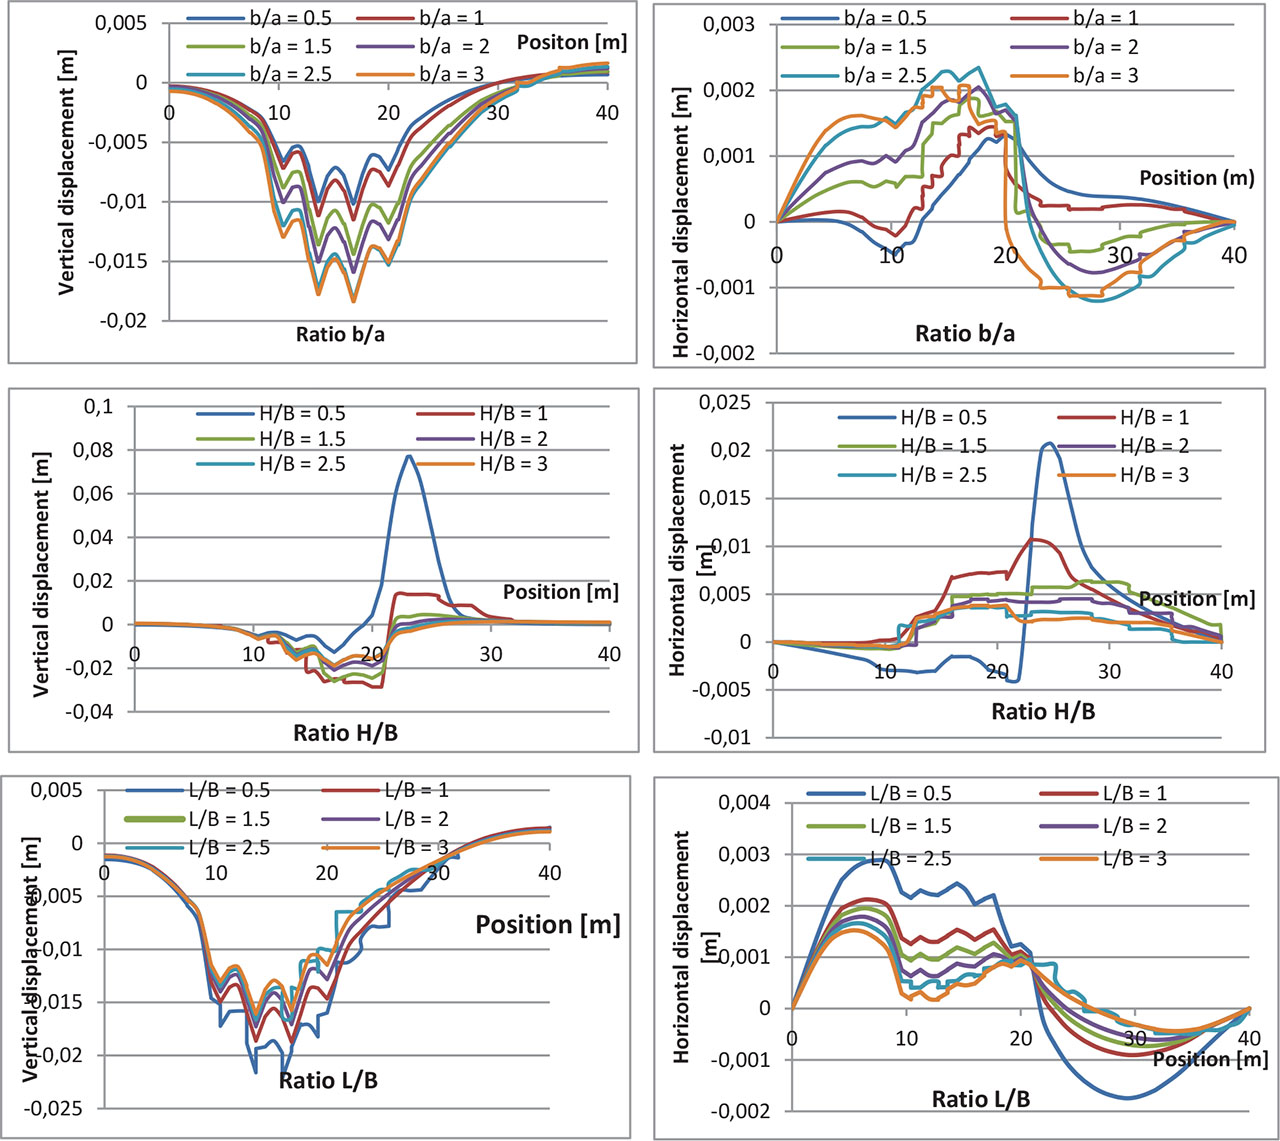
Figure 18:
Vertical and horizontal displacements according to the three ratios.
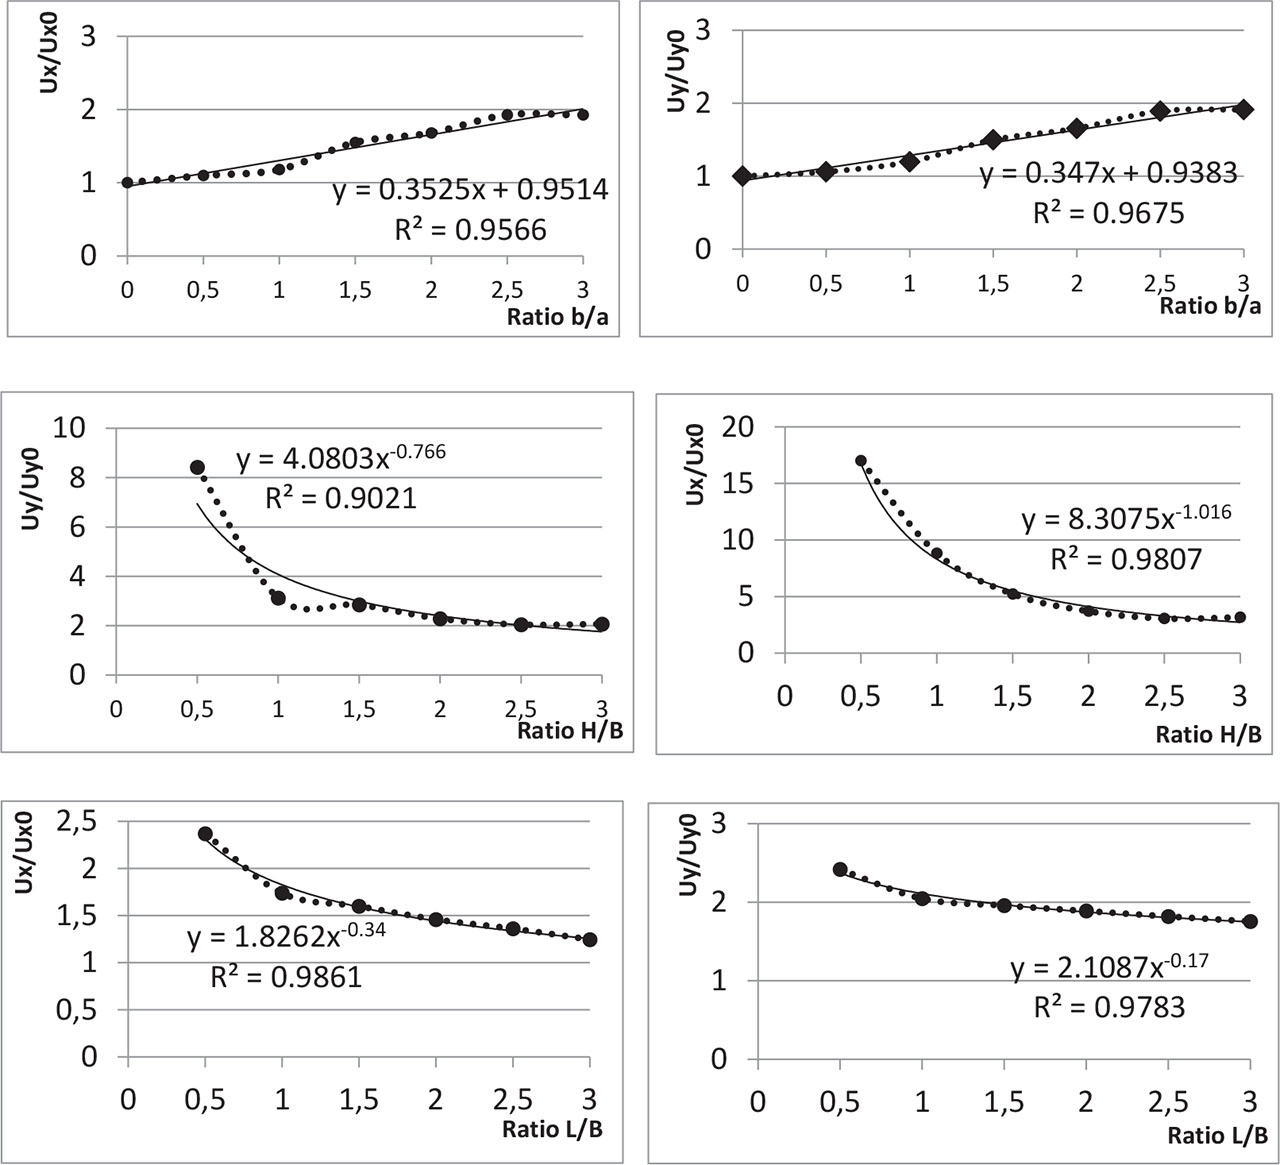
Figure 19:
The variation in displacements under the three ratios.
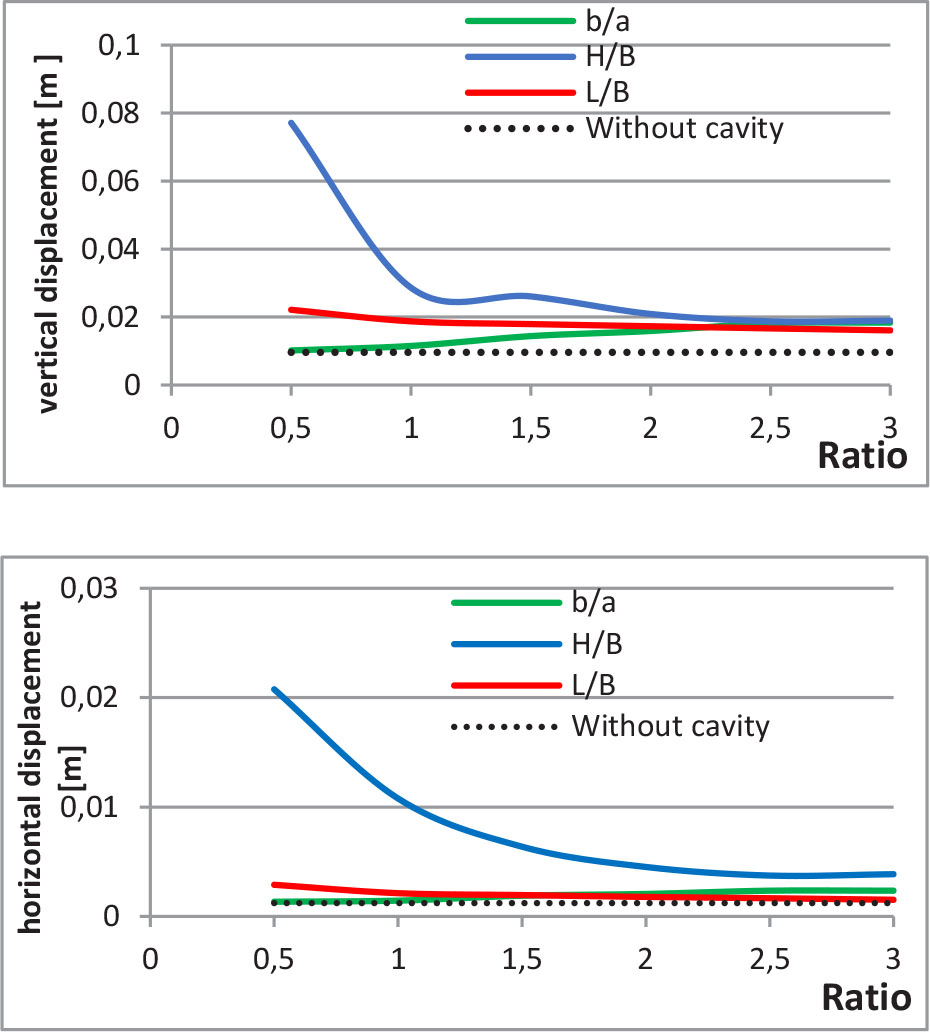
Figure 20:
Displacement assembly according to the three ratios.