
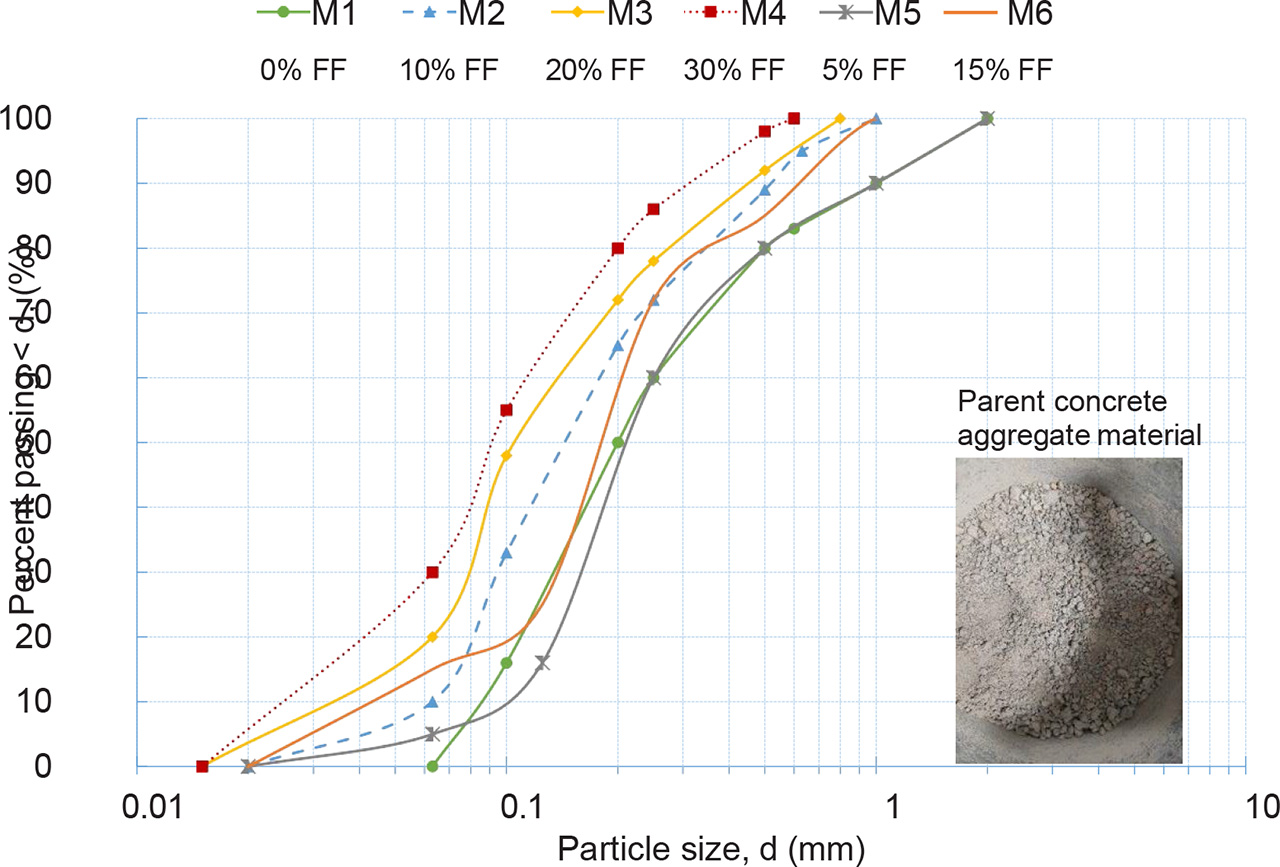
Figure 1:
Grading curves of RCA specimens tested; image of the parent RCA.
Table 1:
Fundamental physical properties of RCA in this work.
| No. | Specimen code | Fraction (mm) | Mean grain size D50 (mm) | Specific gravity GS | Preparation method | Initial void ratio e0 | Initial dry unit weight γd,0 (kN/m3) |
|---|---|---|---|---|---|---|---|
| 1 | M1 | 0.063–2.0 | 0.2 | 2.61 | Dry tamping | 0.61 | 16.29 |
| 2 | M2 | 0.02–1.0 | 0.16 | 2.61 | Dry tamping | 0.63 | 16.08 |
| 3 | M3 | 0.015–0.8 | 0.14 | 2.61 | Dry tamping | 0.72 | 15.43 |
| 4 | M4 | 0.015–0.6 | 0.21 | 2.61 | Dry tamping | 0.81 | 14.62 |
| 5 | M5 | 0.02–2.0 | 0.21 | 2.61 | Moist tamping | 0.74 | 14.96 |
| 6 | M6 | 0.02–1.0 | 0.18 | 2.61 | Moist tamping | 0.71 | 15.00 |
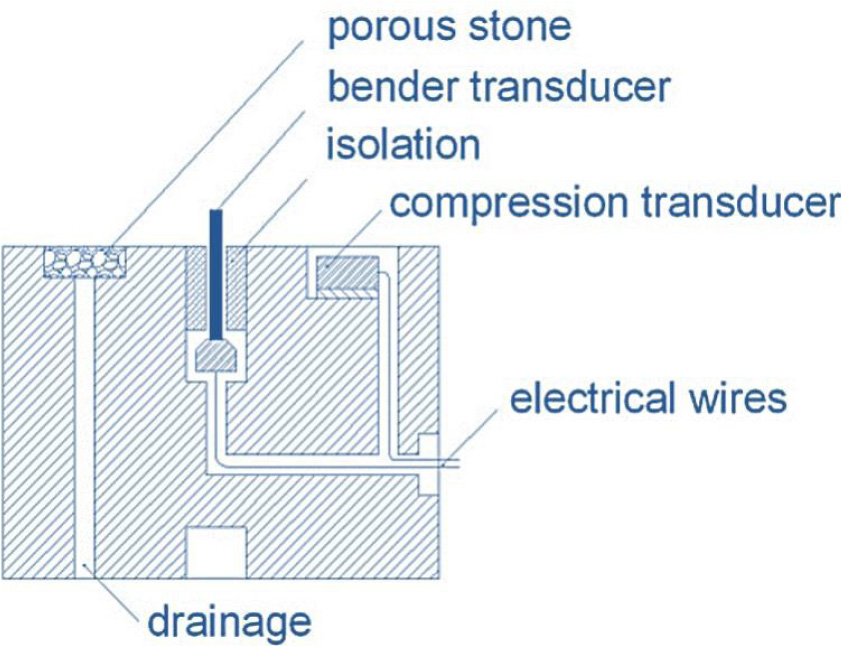
Figure 2:
Schematic drawing of the triaxial base with bender element configuration (after Brignoli et al., 1996).
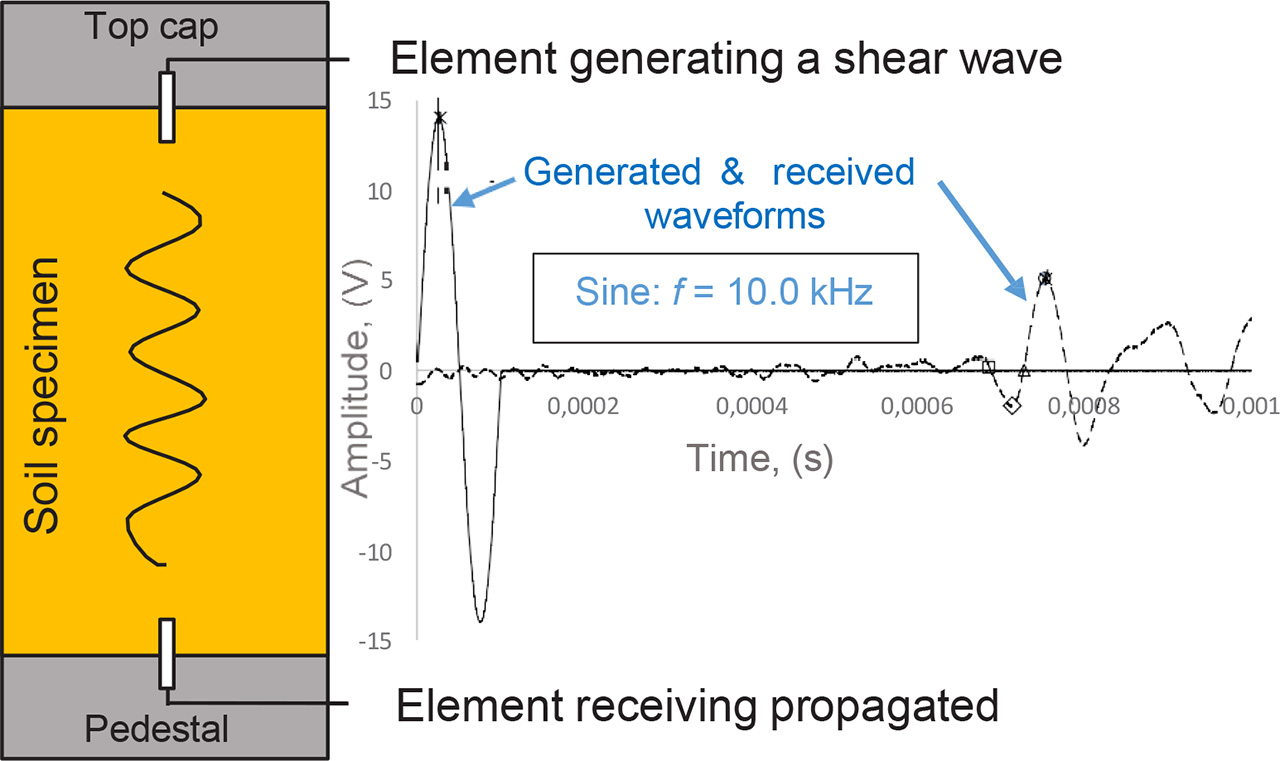
Figure 3:
Schematic illustration of an S-wave bender element test, displaying generated and received waveforms.
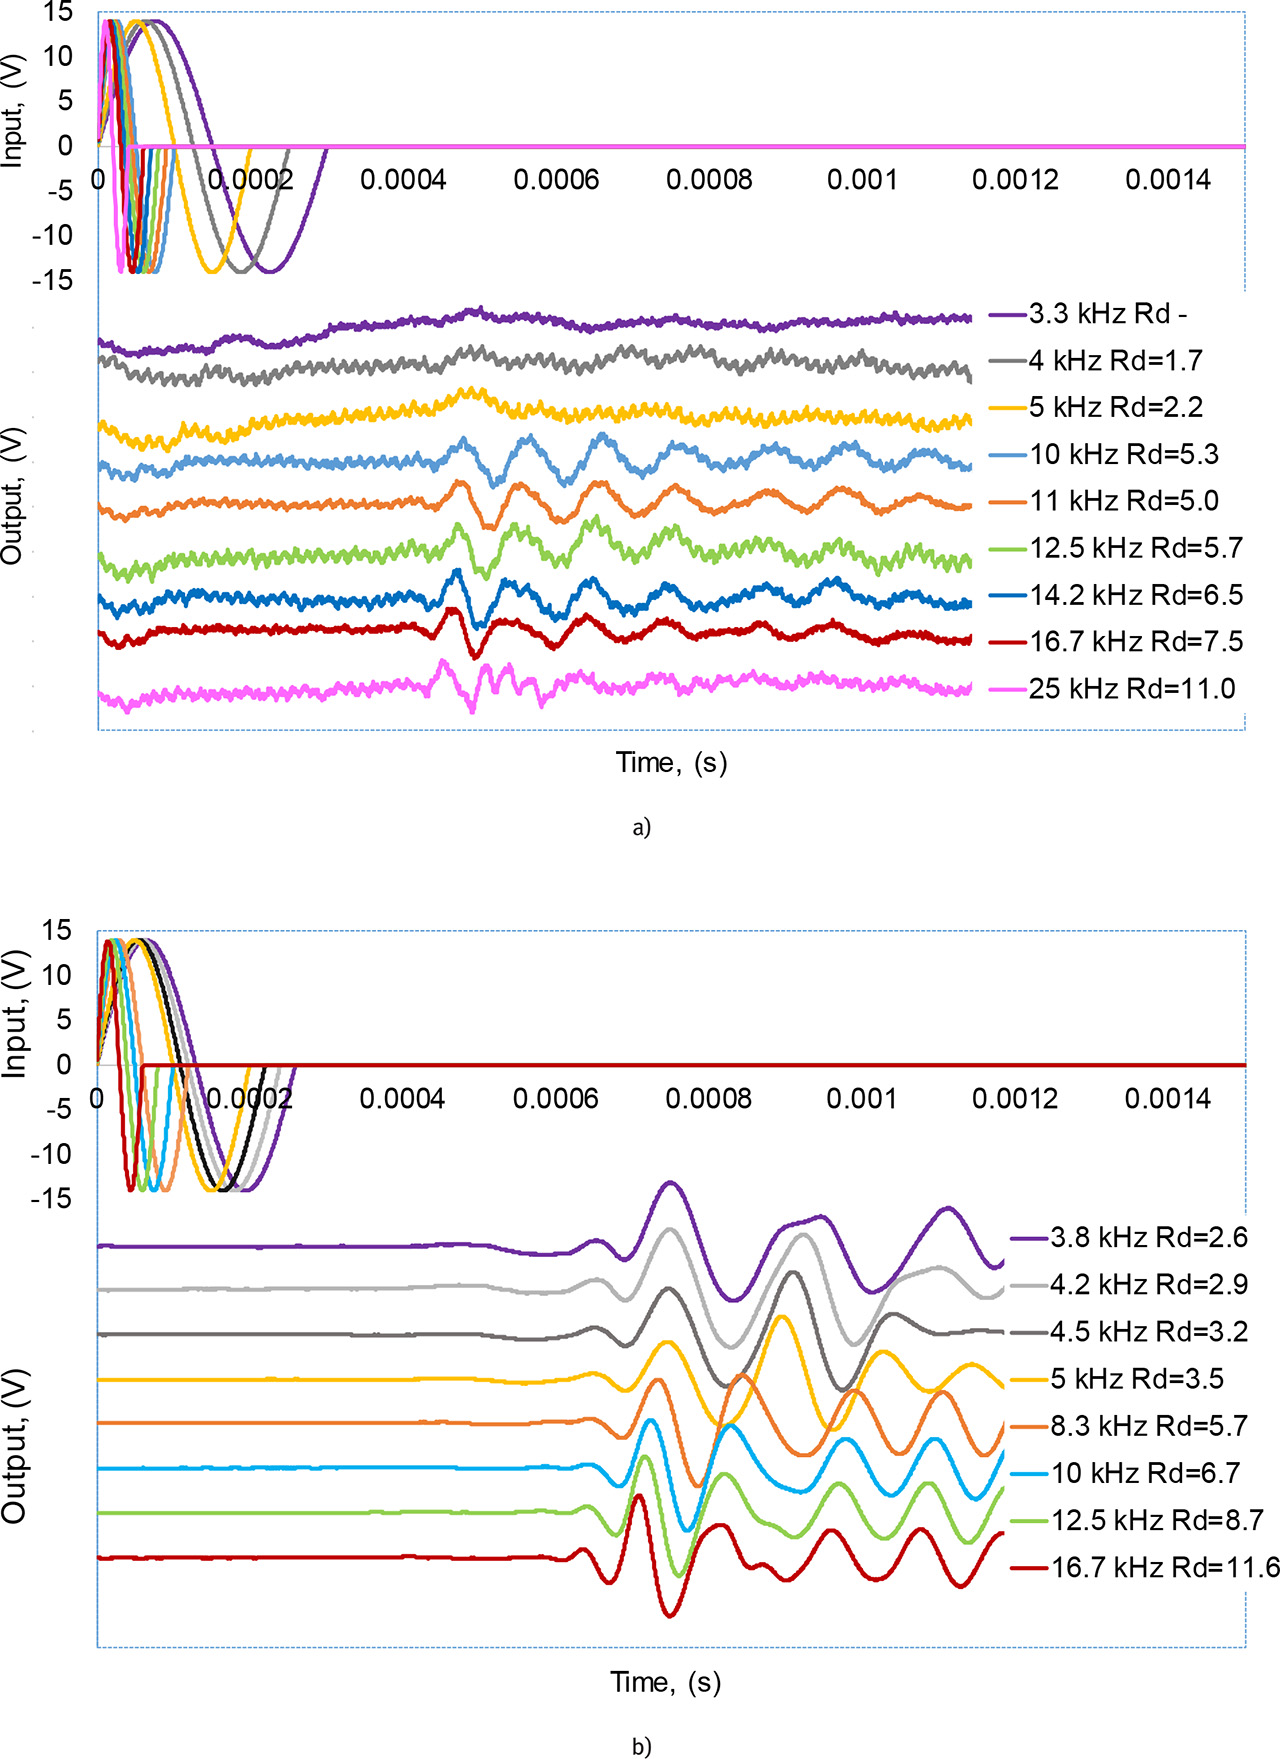
Figure 4:
Example input and received signals in bender element tests; waveform and wavelength ratio at different frequencies for a) the M1 mixture (p′ = 90 kPa) and b) the M4 mixture (p′ = 270 kPa).
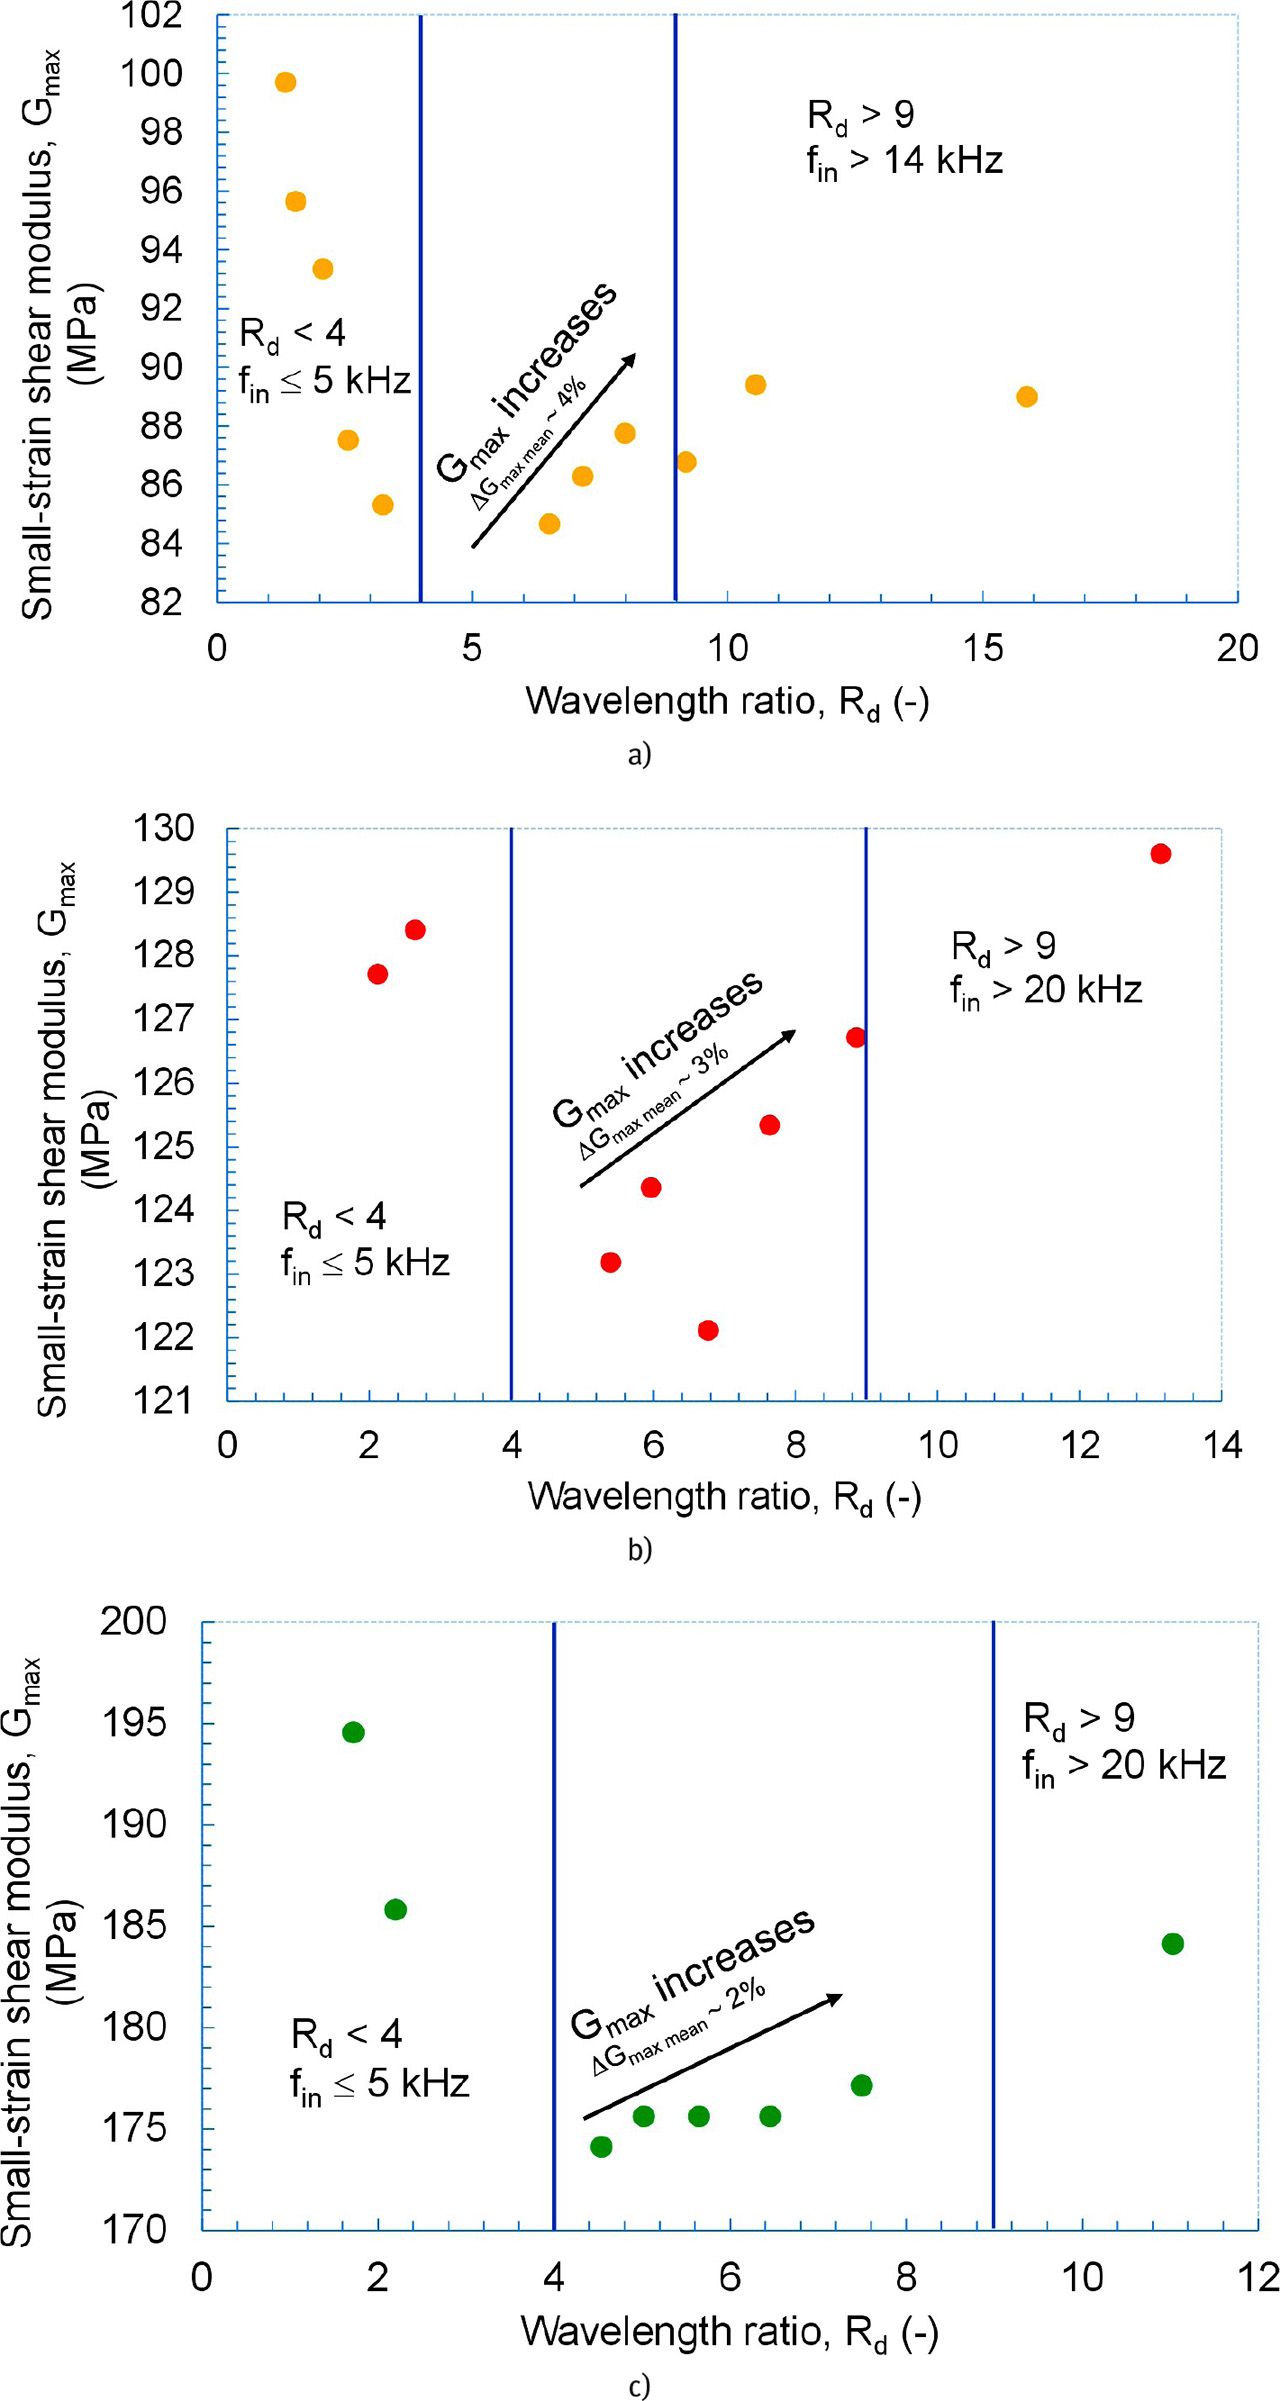
Figure 5:
Example Gmax values determined for the M4 mixture versus the wavelength ratio at a) p′ = 90 kPa, b) p′ = 180 kPa, and c) p′ = 270 kPa.
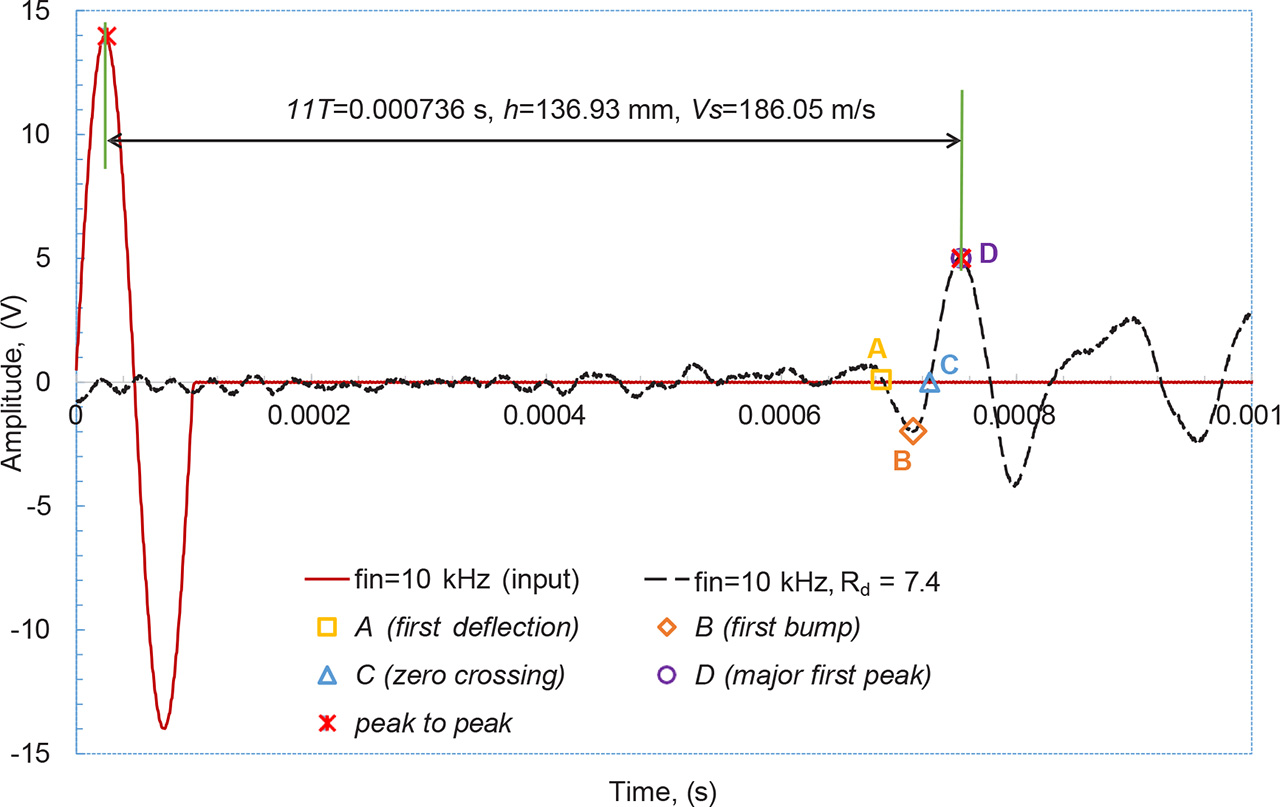
Figure 6:
Example of potential arrival points (the M1 mixture, p′ = 90 kPa).
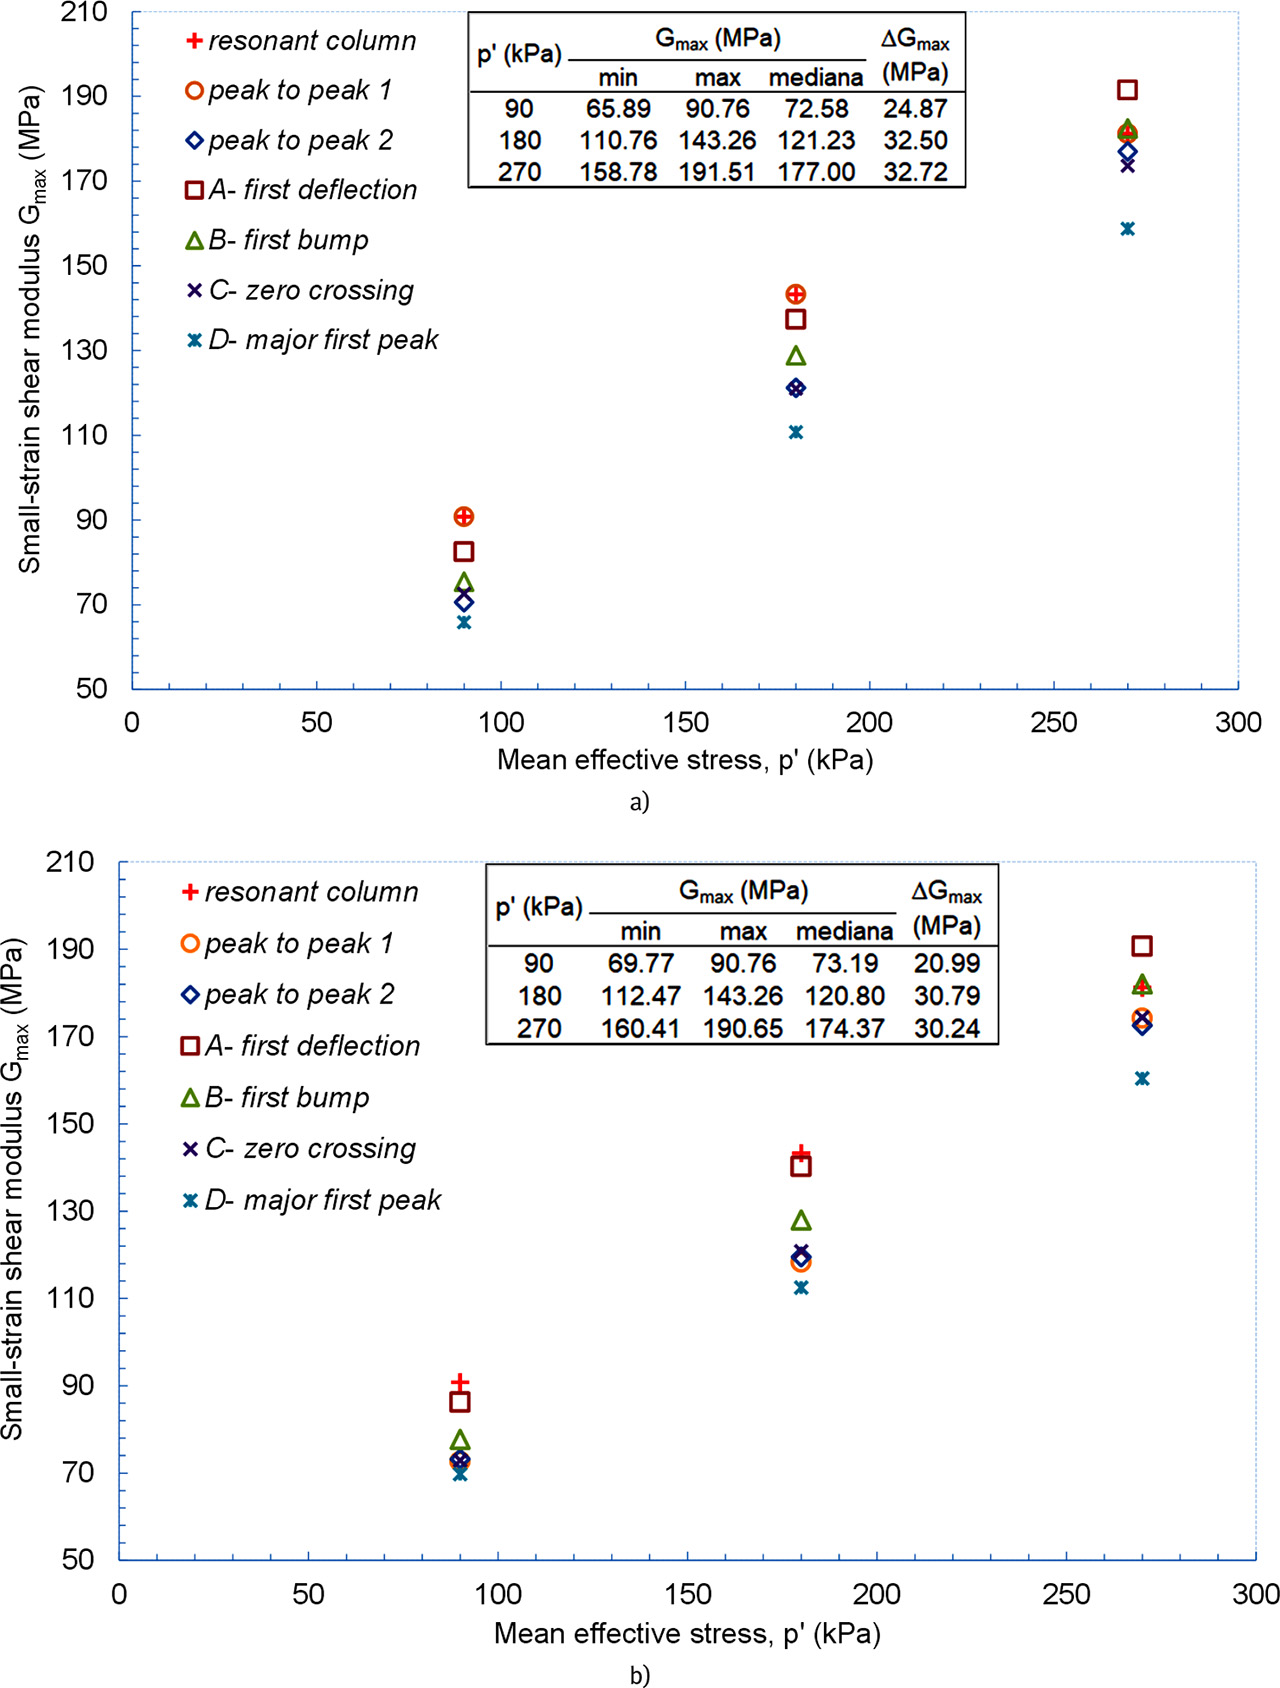
Figure 7:
Typical plot of small-strain shear modulus (Gmax) against mean effective stress (p′) from the M1 mixture: a) fin = 10.0 kHz, b) fin = 12.5 kHz.
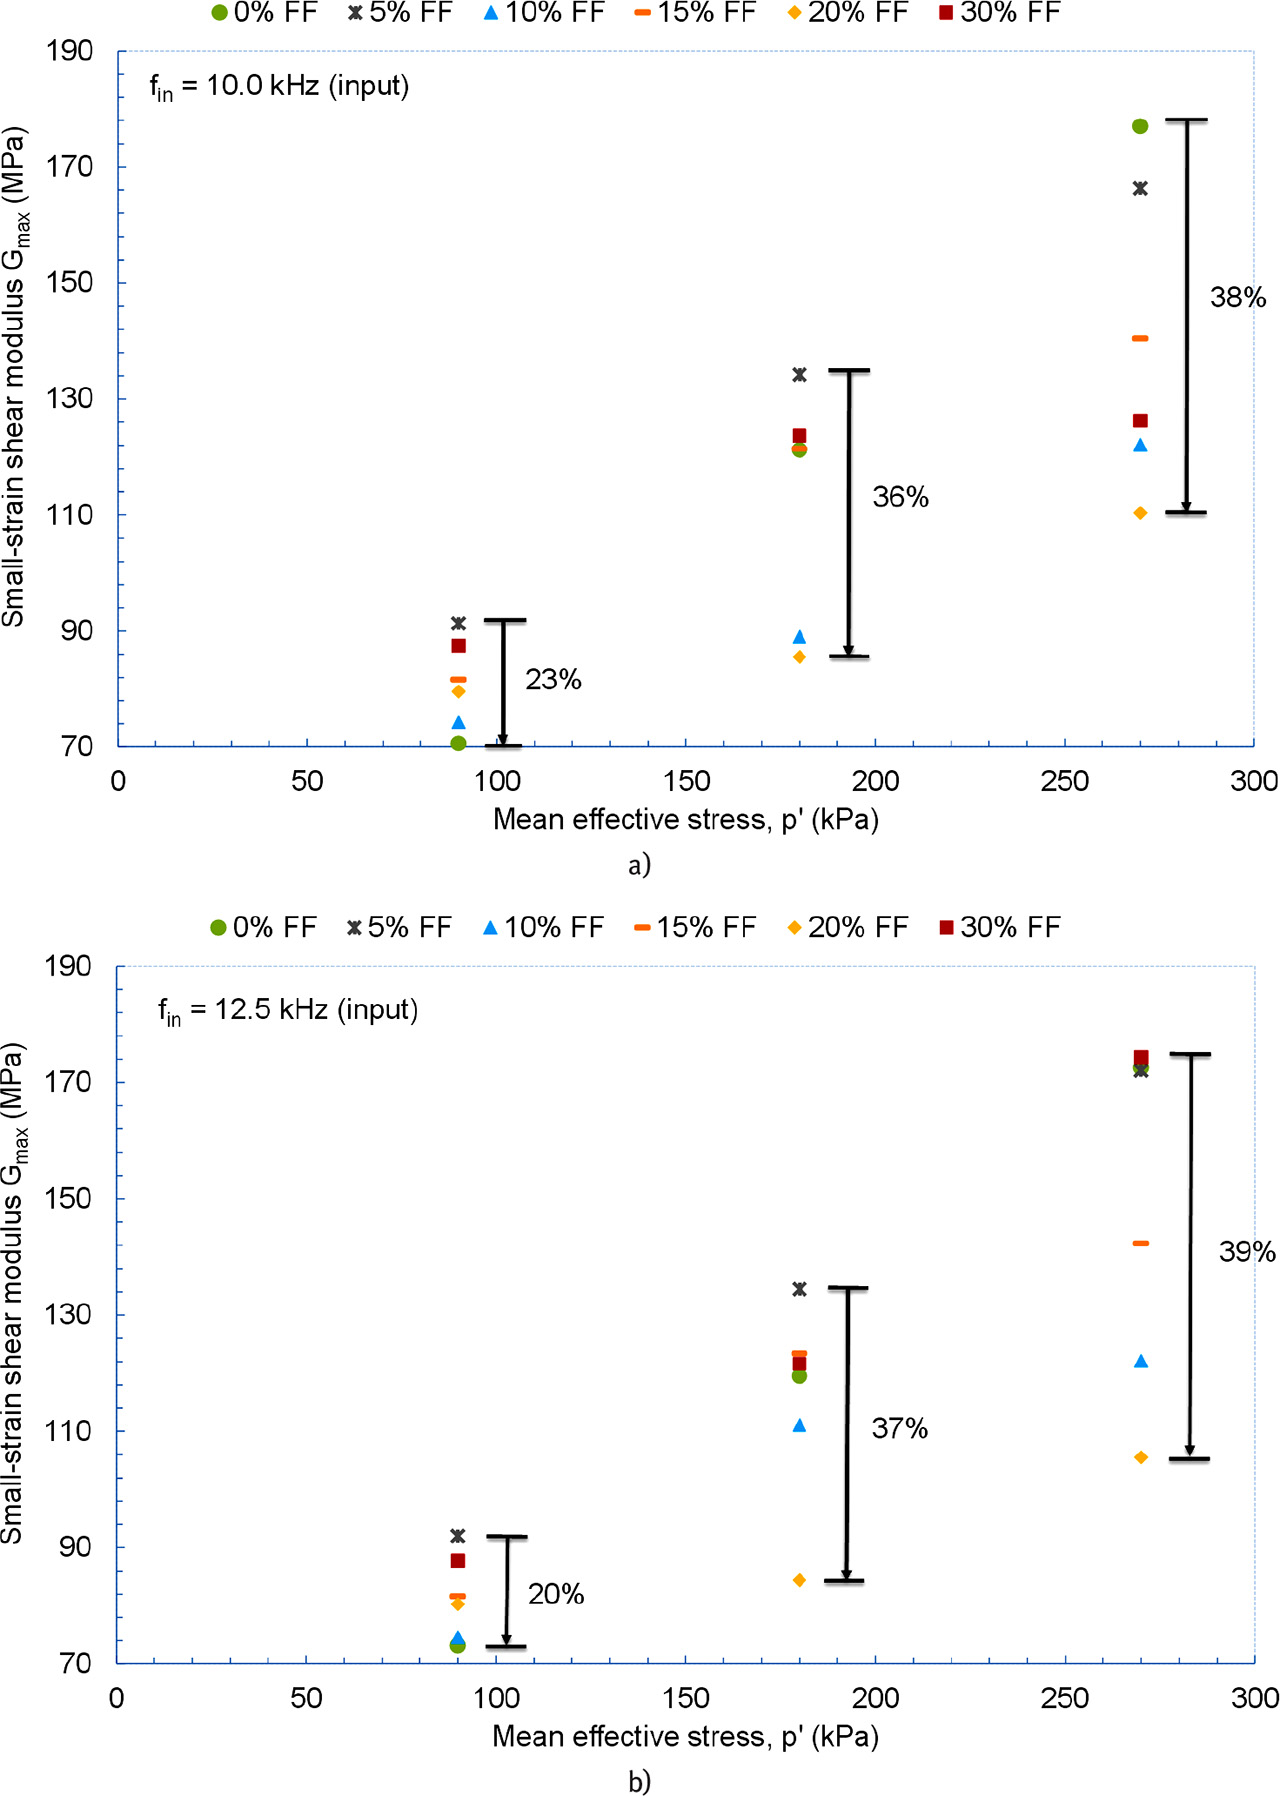
Figure 8:
Small-strain shear modulus (Gmax) for fRCA mixtures based on BE test, peak to peak 2 method: a) fin = 10.0 kHz and b) fin = 12.5 kHz.