
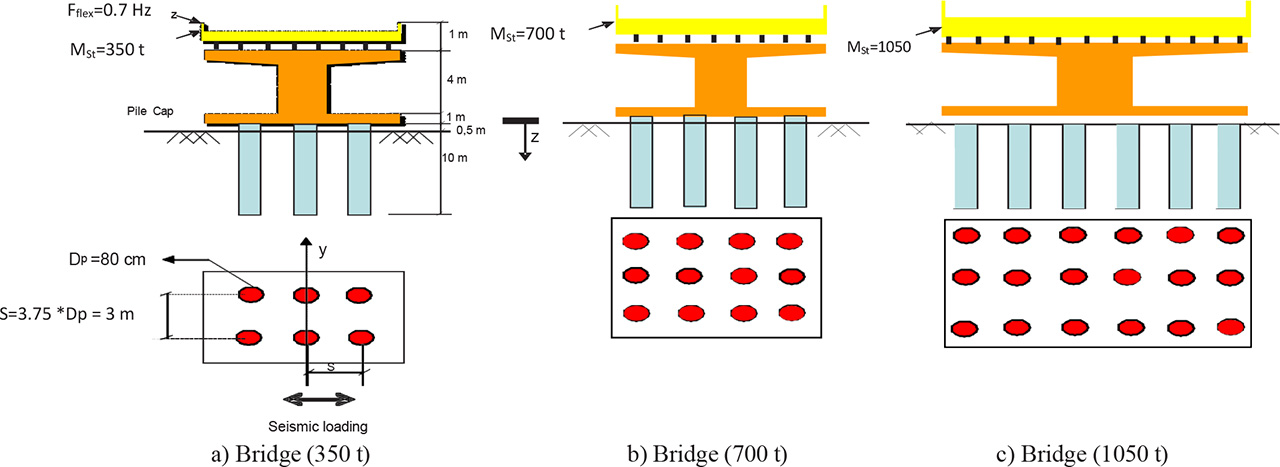
Figure 1:
Piles–bridge system geometry.
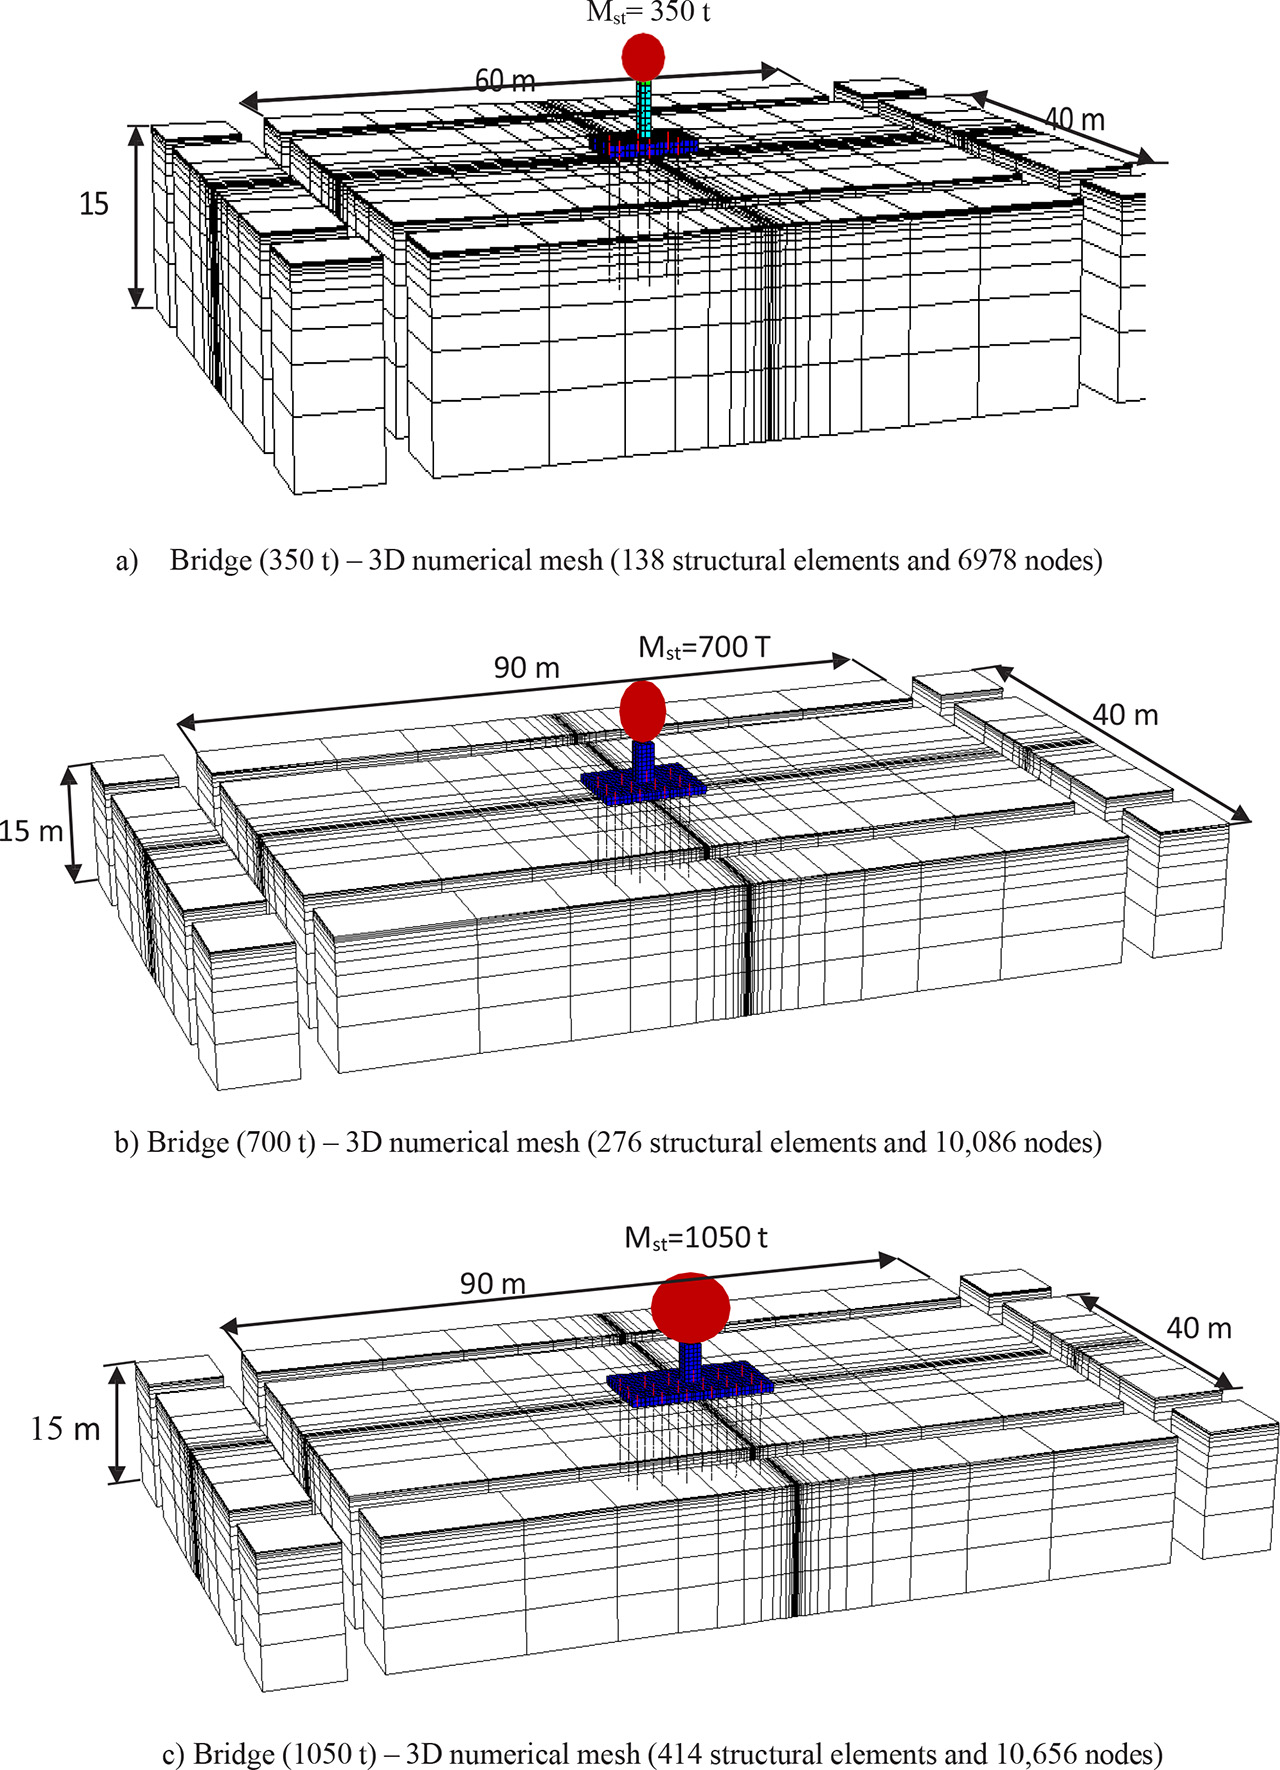
Figure 2:
3D numerical mesh of soil–piles–bridge system.
Table 2:
Elastic characteristics of the superstructure.
| ρst (kg/m3) | Est (MPa) | vst | ξst (%) | Mass (t) |
|---|---|---|---|---|
| 2500 | 8000 | 0.3 | 2 | 350 |
[i] where ρst, Est, and νst are the density, Young's modulus, and the coefficient of Poisson's ratio, respectively. ξst is the percentage of critical damping, Dp is the pile diameter, and EA and EI are the axial and bending stiffness, respectively.
Table 3:
Elastic characteristics of the pile materials.
| Material | Diameter (m) | Mass density ρ (kg/m3) | Young's modulus E (MPa) | Poisson's ratio ν | Damping ratio ξ (%) | Height (m) |
|---|---|---|---|---|---|---|
| Pile | 0.8 | 2500 | 20,000 | 0.3 | 2 | 10 |
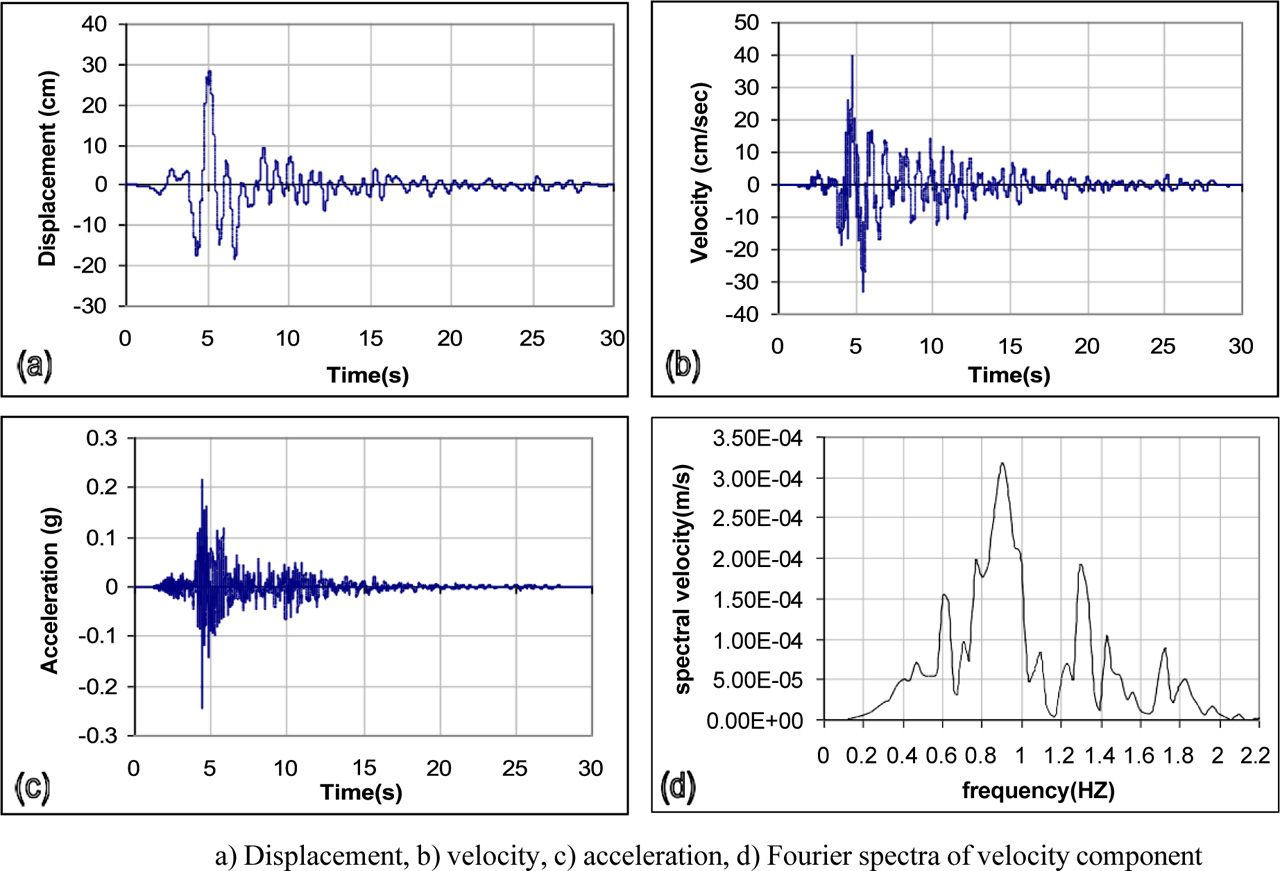
Figure 3:
Kocaeli earthquake record (1999).
Table 4:
Response of a group of (2 × 3) piles for Kocaeli earthquake (1999).
| C Cohesion (kPa) | ast (m/s2) | acap (m/s2) | Internal forces | |||
|---|---|---|---|---|---|---|
| Central piles | Corner piles | |||||
| Mmax Bending moment (kN m) | Tmax Shear force (kN) | Mmax Bending moment (kN m) | Tmax Shear force (kN) | |||
| 150 | 23.02 | 14.39 | 2244 | 1218 | 2189 | 1604 |
[i] ast: acceleration of the superstructure
[ii] acap: acceleration of the cap
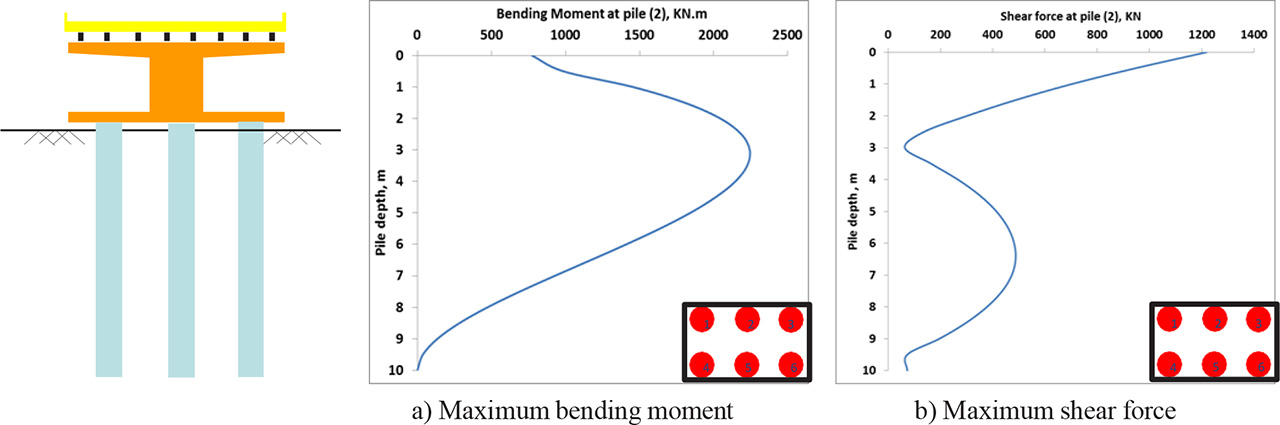
Figure 4:
Internal forces at central pile (2).
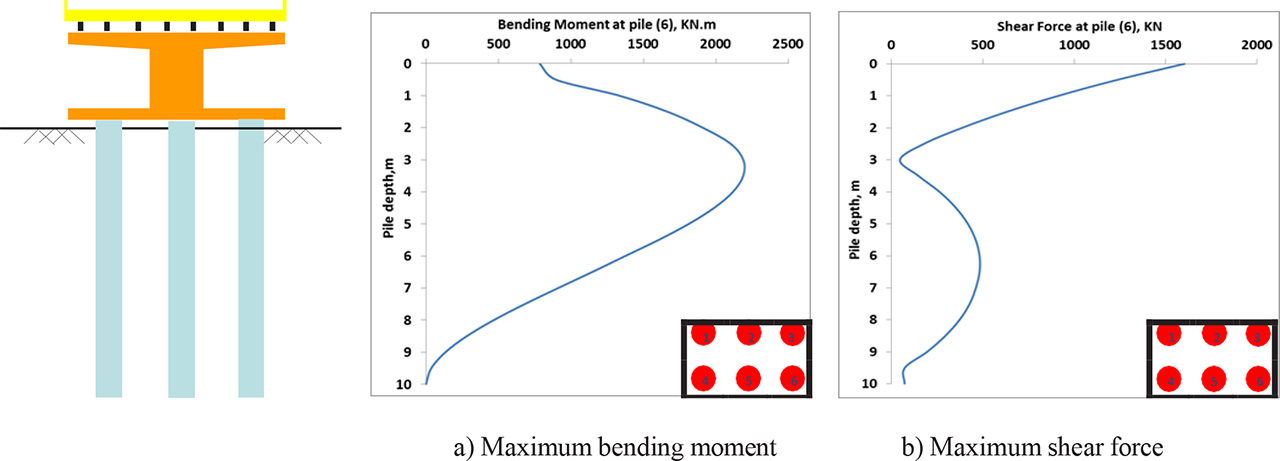
Figure 5:
Internal forces at corner pile (6).
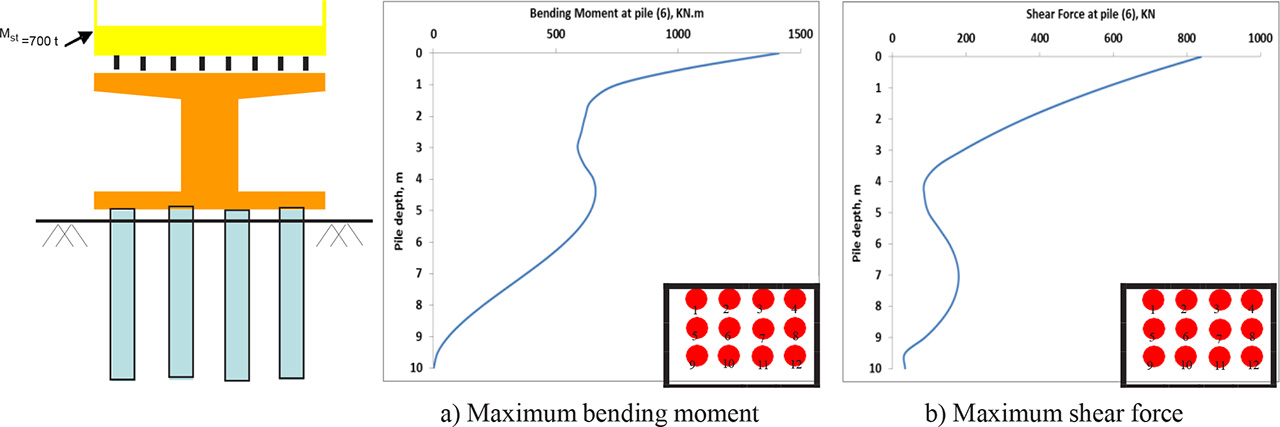
Figure 6:
Internal forces at central pile (6).
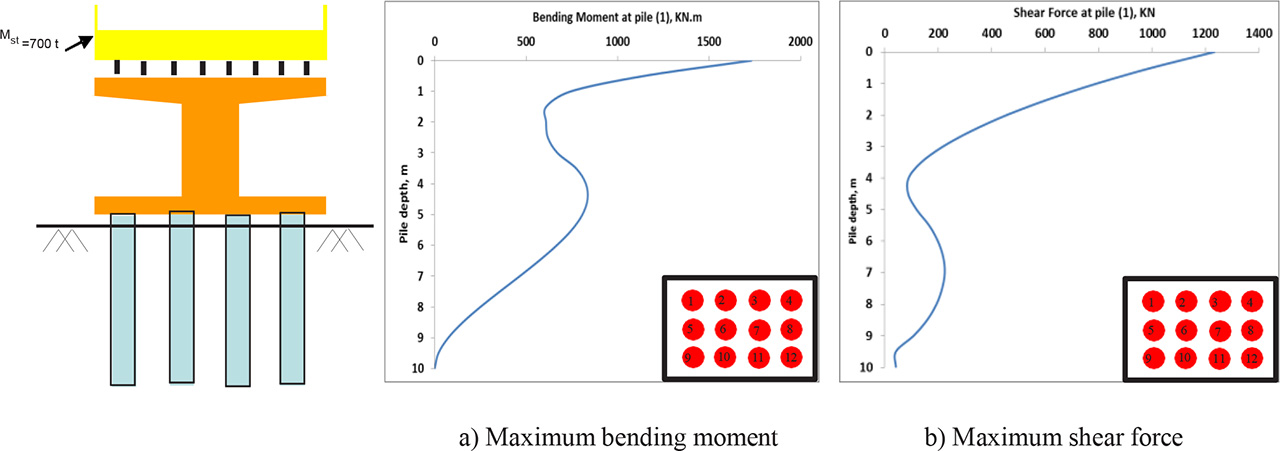
Figure 7:
Internal forces at corner pile (1).
Table 5:
Response of a group of (4x3) piles for Kocaeli earthquake (1999).
| C (kPa) | ast (m/s2) | acap (m/s2) | Internal forces | |||
|---|---|---|---|---|---|---|
| Central piles | Corner piles | |||||
| Mmax (kN m) | Tmax (kN) | Mmax (kN m) | Tmax (kN) | |||
| 150 | 18.09 | 14.9 | 1411 | 837.8 | 1732 | 1233 |
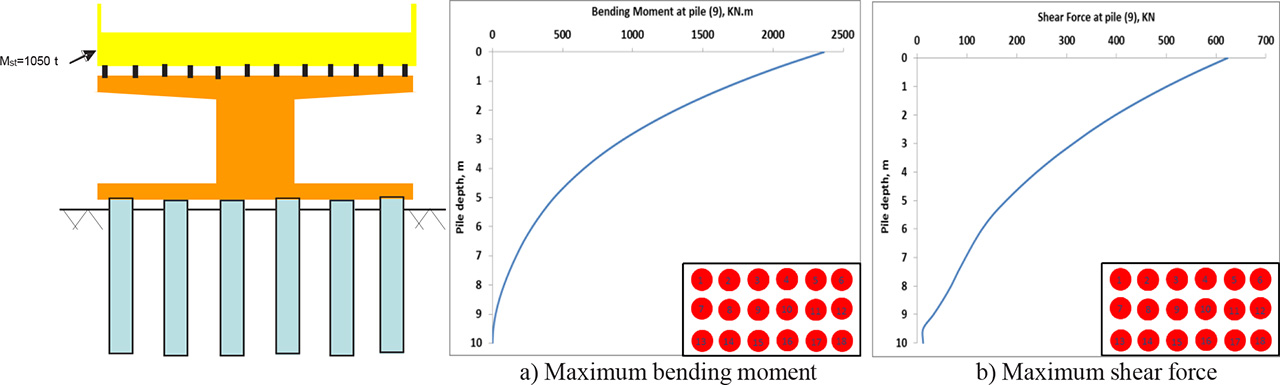
Figure 8:
Internal forces at central pile (9).
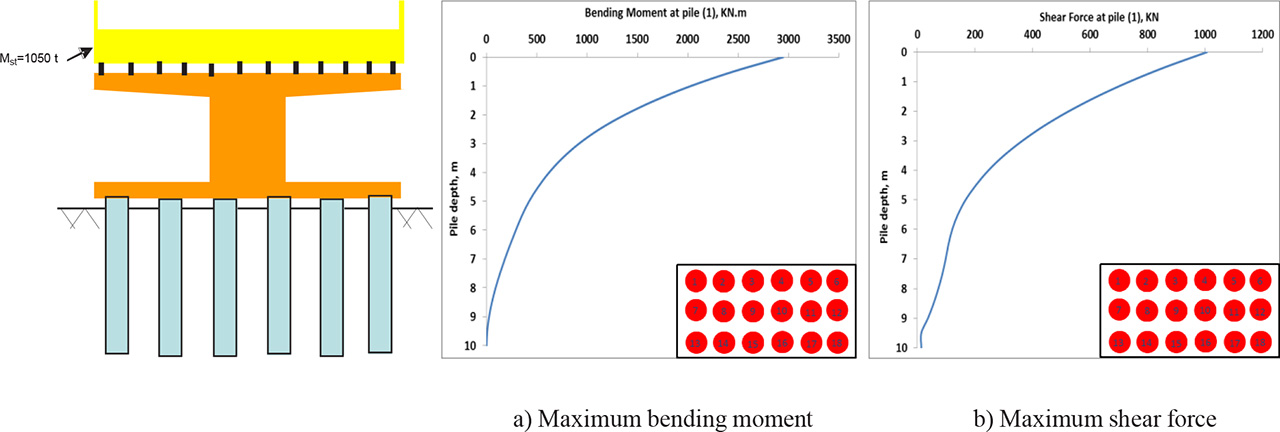
Figure 9:
Internal forces at corner pile (1).
Table 6:
Response of a group of (6×3) piles for Kocaeli earthquake (1999).
| C (kPa) | ast (m/s2) | acap (m/s2) | Internal forces | |||
|---|---|---|---|---|---|---|
| Central piles | Corner piles | |||||
| Mmax (kN m) | Tmax (kN) | Mmax (kN m) | Tmax (kN) | |||
| 150 | 11.99 | 10.82 | 2363 | 623.3 | 2947 | 1007 |
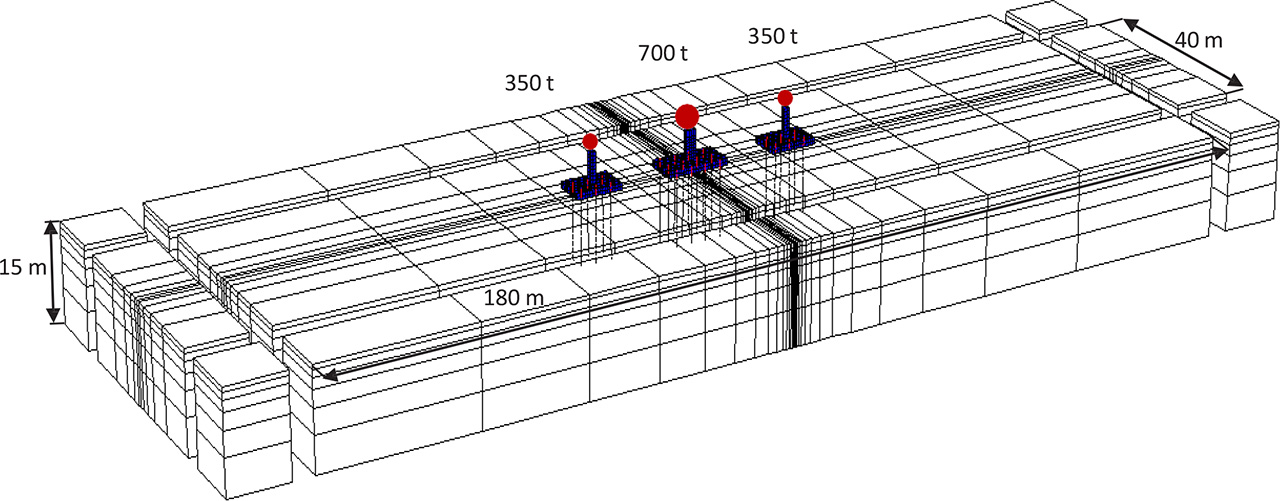
Figure 10:
Parallel bridges system 3D numerical mesh with adsorbing boundaries (552 structural elements and 41,361 nodes).
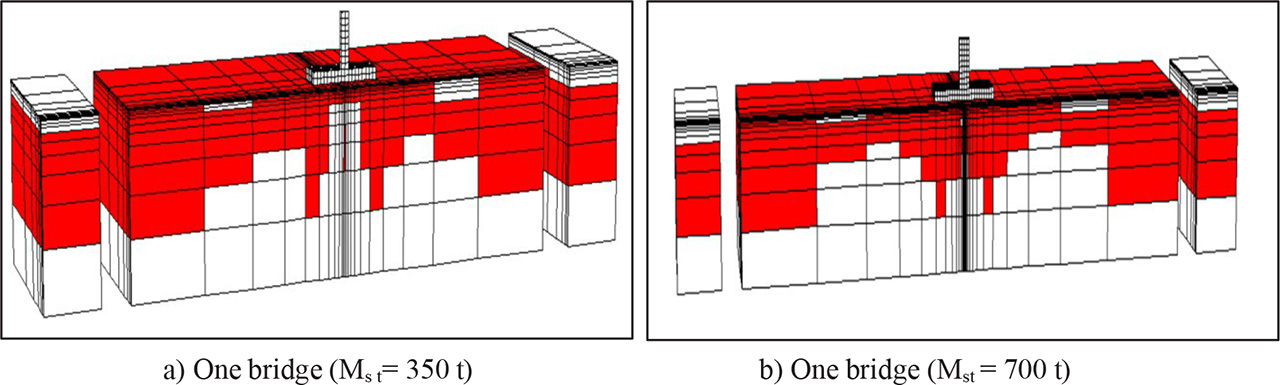
Figure 10:
Distribution of plasticity (red zones) for two single isolated bridges (Mst = 350 and 700 t).
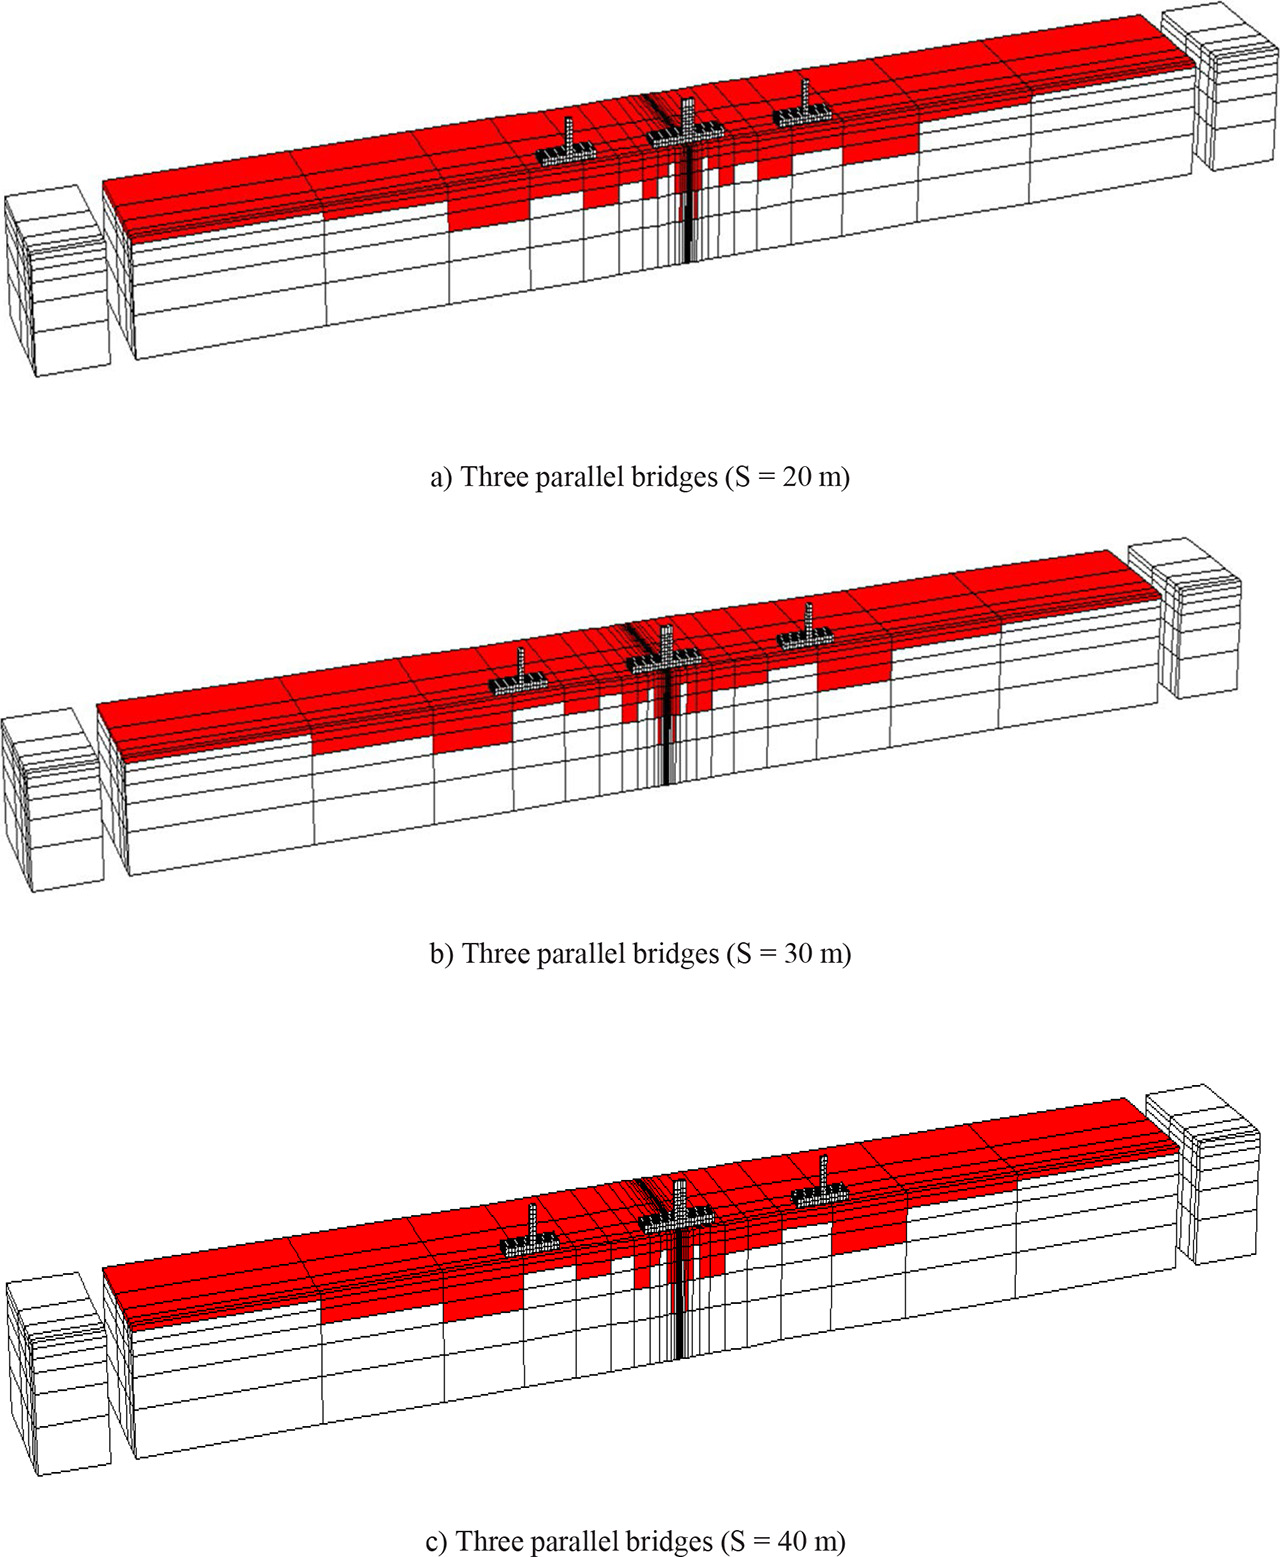
Figure 11:
Distribution of plasticity (red zones) for different spacings between the three dissimilar bridges (Mst = 350, 700, and 350 t).
Table 7:
Influence of the spacing inter-bridge on the seismic response of three dissimilar parallel bridges system.
| S (m) | ast (m/s2) | acap (m/s2) | Internal forces | |||||||||
|---|---|---|---|---|---|---|---|---|---|---|---|---|
| Central piles | Corner piles | |||||||||||
| Pile (2) (Mst = 350 t) | Pile (16) (Mst = 700 t) | Pile (1) (Mst = 350 t) | Pile (7) (Mst = 700 t) | |||||||||
| Mmax (kN m) | Tmax (kN) | Mmax (kN m) | Tmax (kN) | Mmax (kN m) | Tmax (kN) | Mmax (kN m) | Tmax (kN) | |||||
| One bridge (Mst = 350 t and S = 0) | 23.02 | 14.39 | 2244 | 1218 | 2189 | 1604 | ||||||
| One bridge (Mst = 700 t and S = 0) | 18.09 | 14.9 | 1640 | 1134 | 1732 | 1233 | ||||||
| S (m) | Bridge (Mst = 350 t) | Bridge (Mst = 700 t) | Three dissimilar parallel bridges | |||||||||
| ast | acap | ast | acap | Pile (2) (Mst = 350 t) | Pile (16) (Mst = 700 t) | Pile (1) (Mst = 350 t) | Pile (7) (Mst = 700 t) | |||||
| 20 | 11.5 | 6.61 | 8.45 | 5.78 | 1981 | 1169 | 1123 | 998 | 1824 | 1310 | 1218 | 1090 |
| 30 | 11.8 | 6.88 | 8.63 | 5.94 | 2021 | 1200 | 1156 | 1006 | 1870 | 1273 | 1222 | 1118 |
| 40 | 12 | 7.1 | 8.81 | 6.05 | 2035 | 1242 | 1176 | 1037 | 1935 | 1361 | 1278 | 1157 |
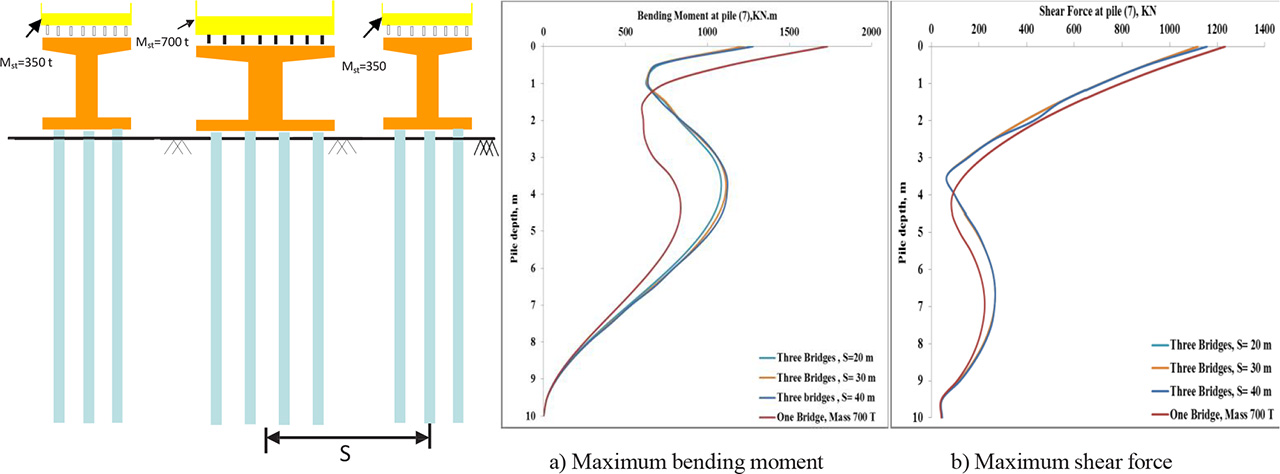
Figure 12:
Three dissimilar parallel bridges: Internal forces at corner pile (7) of the bridge (700 t).
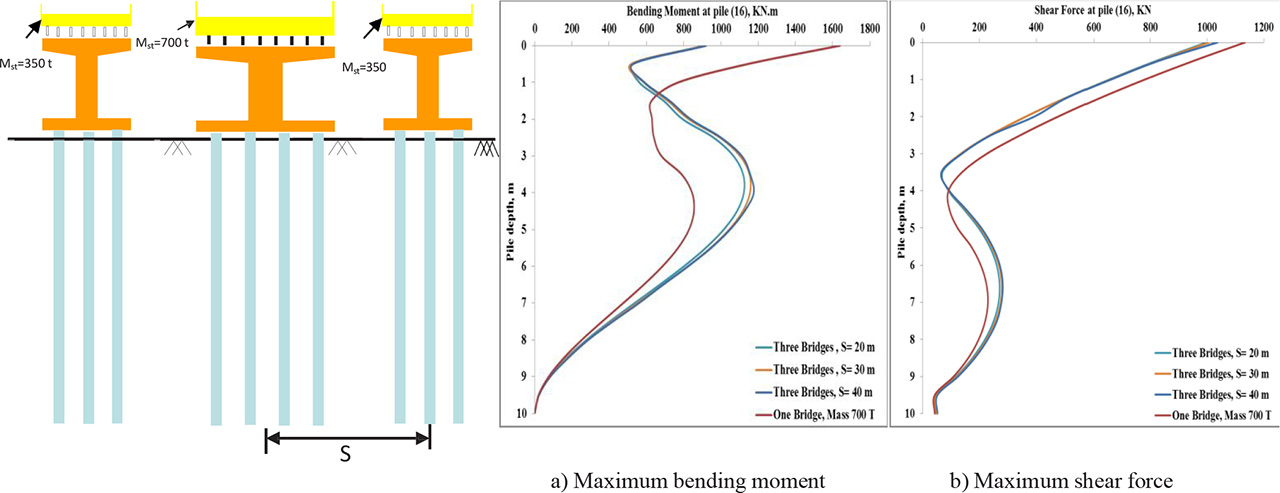
Figure 13:
Three dissimilar parallel bridges: Internal forces at central pile (16) of the bridge (700 t).
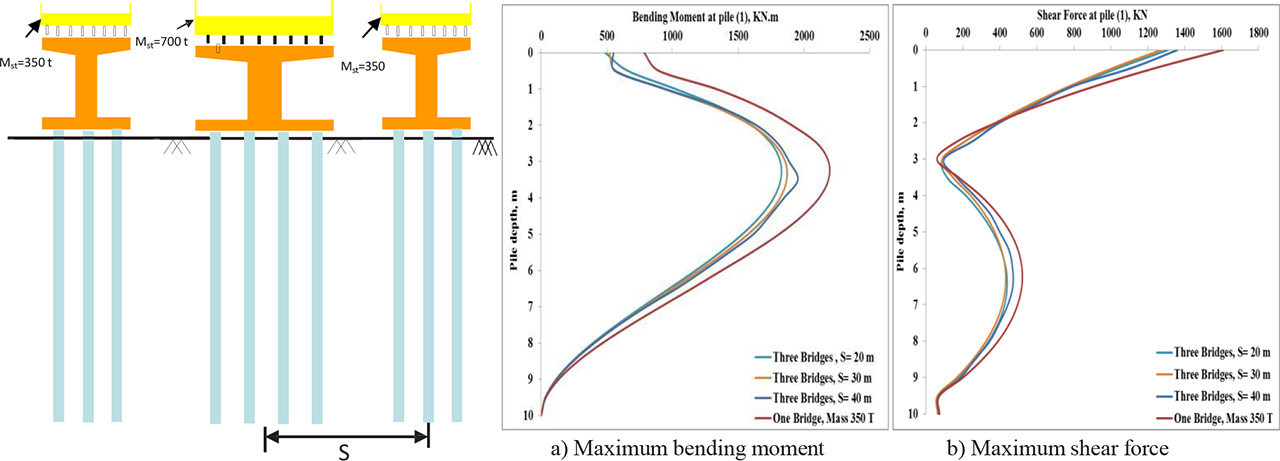
Figure 14:
Three dissimilar parallel bridges: Internal forces at corner pile (1) of the bridge (350 t).
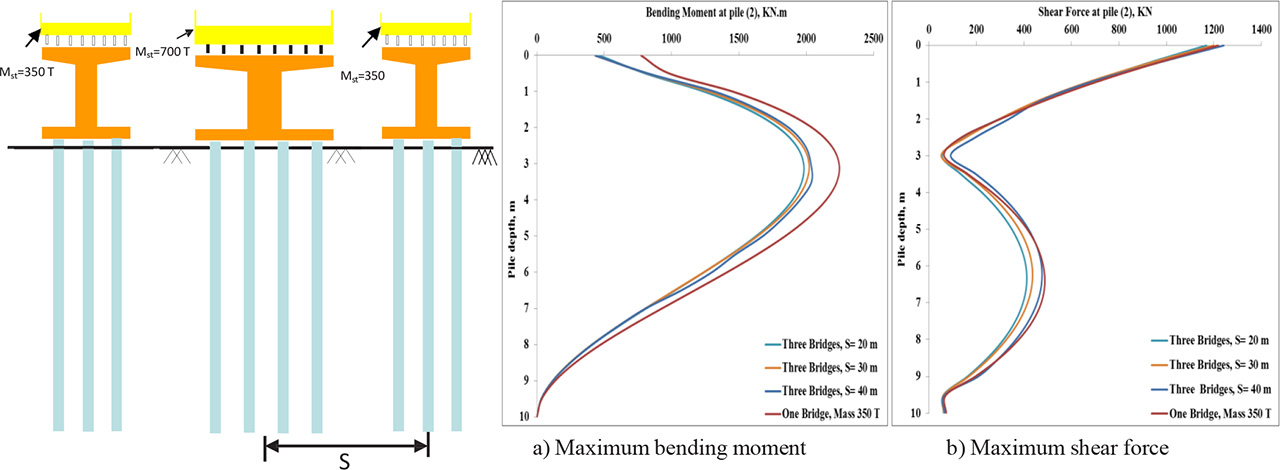
Figure 15:
Three dissimilar parallel bridges: Internal forces at central pile (16) of the bridge (350 t).
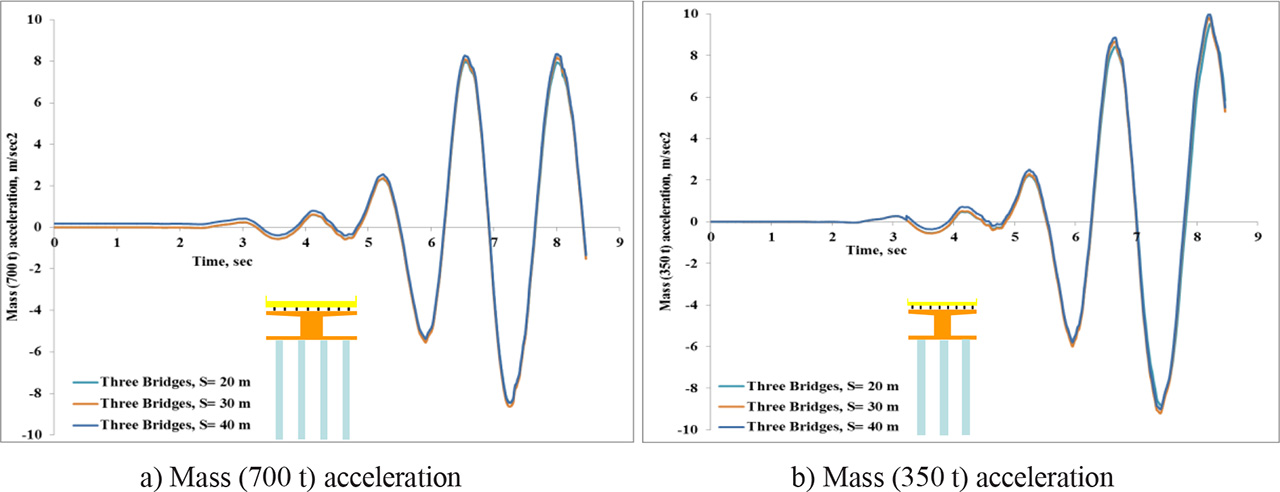
Figure 16:
Three dissimilar parallel bridges: Masses accelerations.
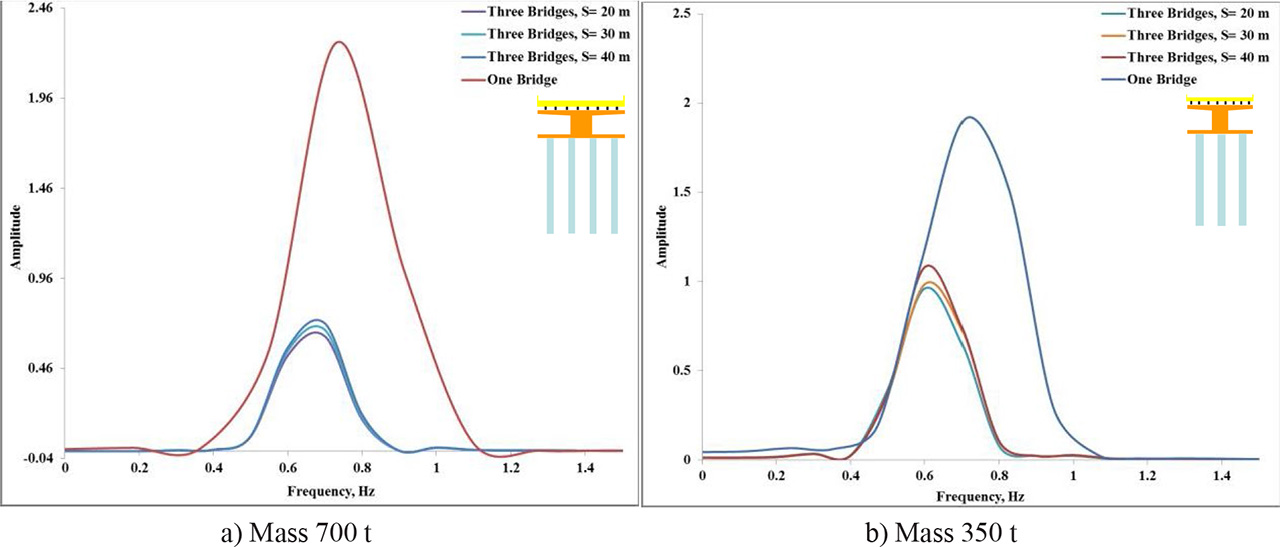
Figure 17:
Three dissimilar parallel bridges: Fourier spectra diagram.
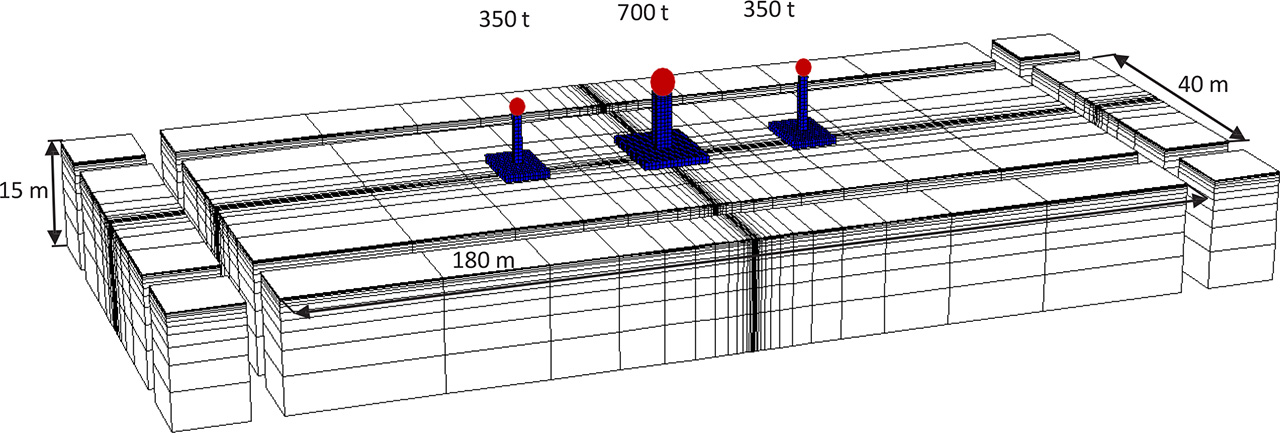
Figure 18:
Perpendicular bridges system 3D numerical mesh with adsorbing boundaries (552 structural elements and 77,990 nodes).
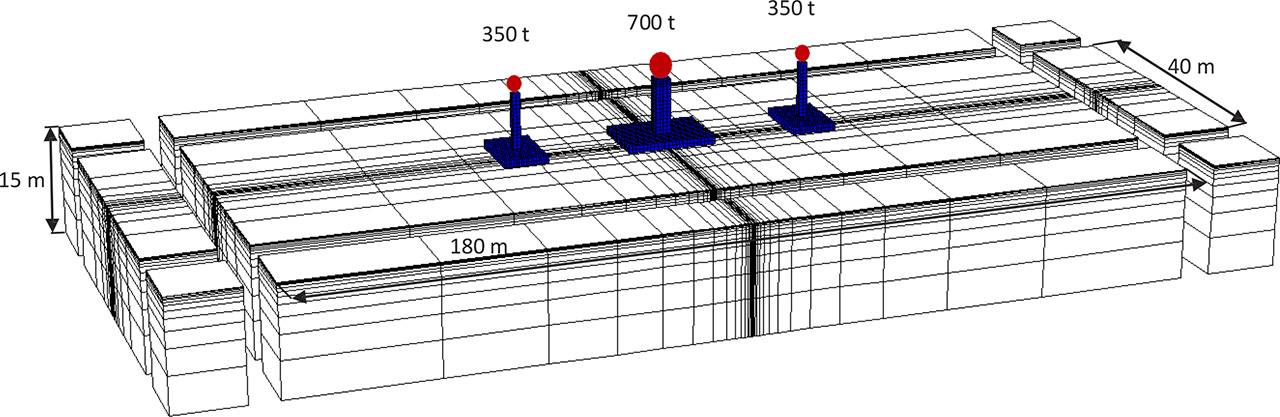
Figure 19:
Crossing bridges system 3D numerical mesh with adsorbing boundaries (552 structural elements and 77,990 nodes).
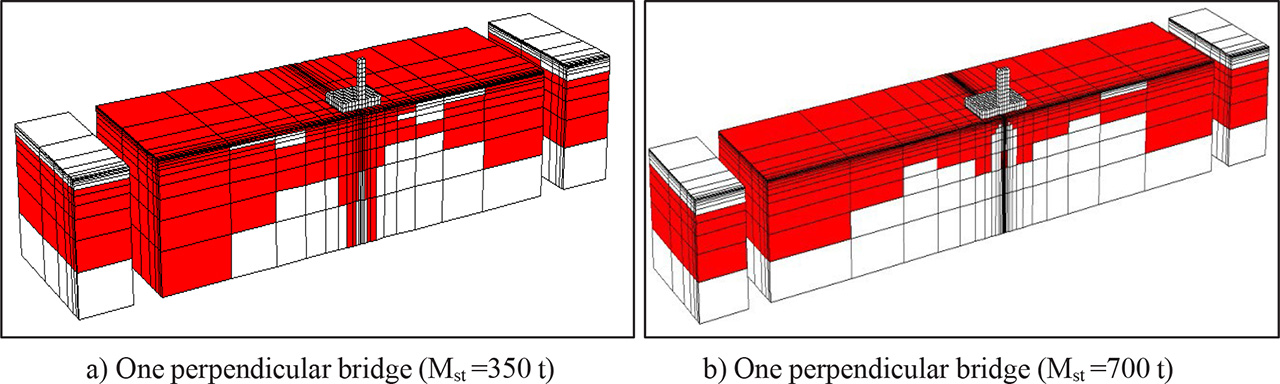
Figure 20:
Distribution of plasticity for two single isolated bridges (Mst =350 and 700 t).
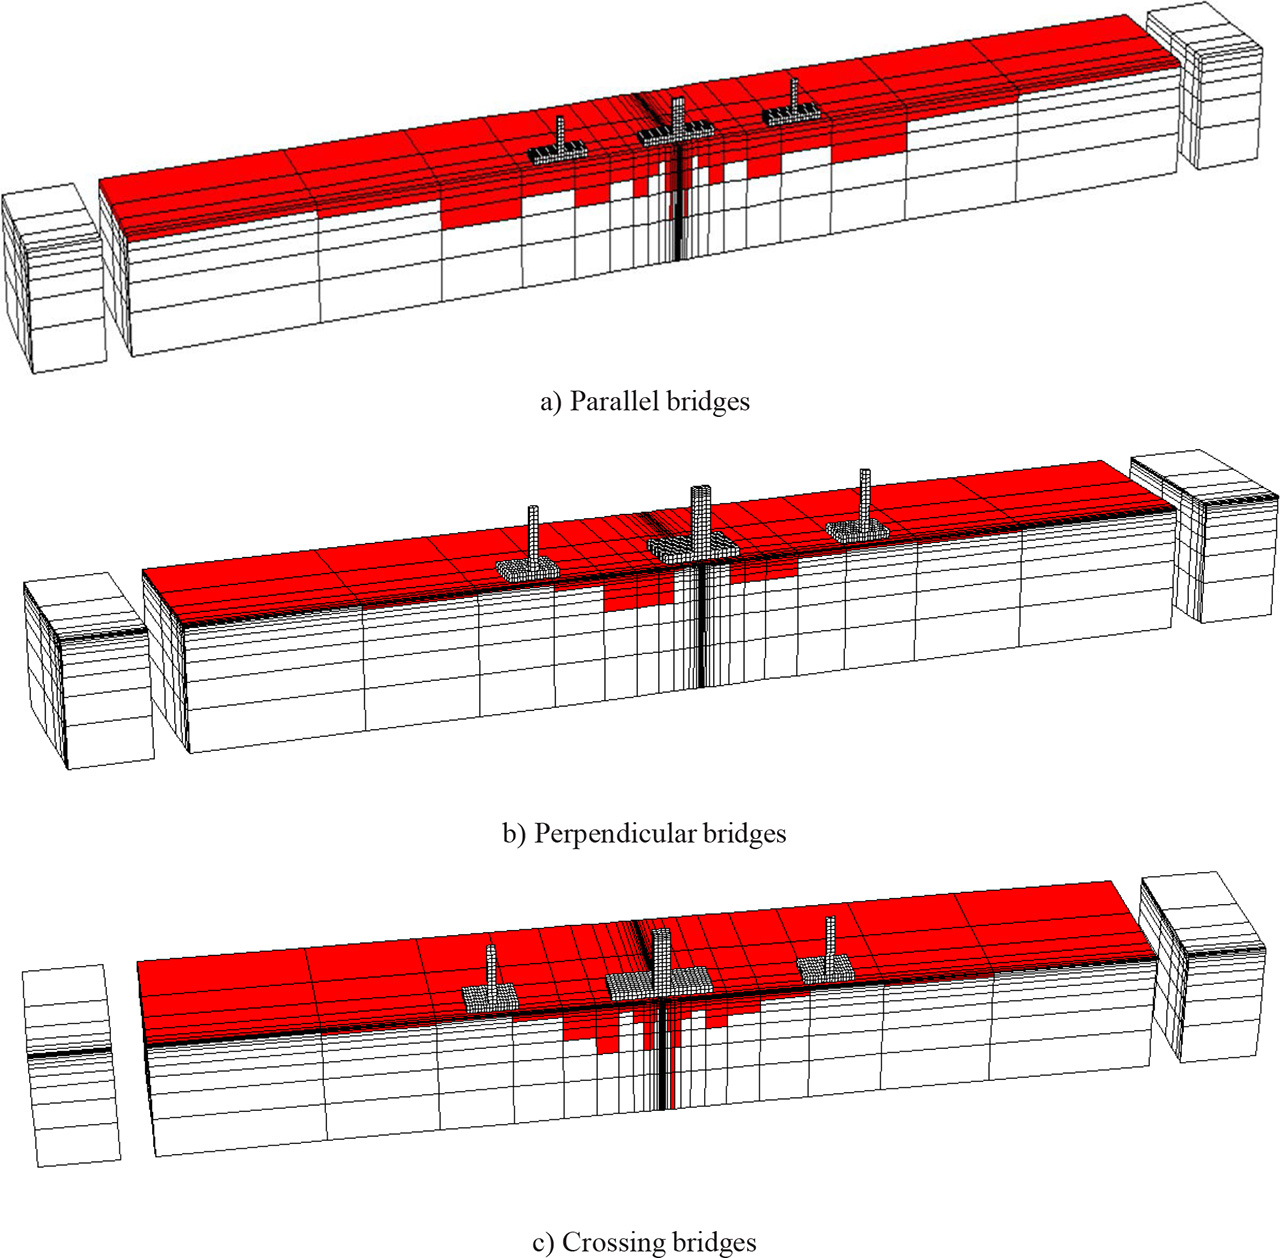
Figure 21:
Distribution of plasticity (red zones) for different positioning of the three dissimilar bridges (Mst = 350, 700, and 350 t).
Table 8:
Influence of different positioning of three dissimilar bridges on the seismic response system.
| Position | ast (m/s2) | acap (m/s2) | Internal forces | |||||||||
|---|---|---|---|---|---|---|---|---|---|---|---|---|
| Central piles | Corner piles | |||||||||||
| Pile (2) (Mst = 350 t) | Pile (15) (Mst = 700 t) | Pile (1) (Mst = 350 t) | Pile (7) (Mst = 700 t) | |||||||||
| Mmax (kN m) | Tmax (kN) | Mmax (kN m) | Tmax (kN) | Mmax (kN m) | Tmax (kN) | Mmax (kN m) | Tmax (kN) | |||||
| One perpendicular bridge (Mst = 350 t) | 20.1 | 11.5 | 3979 | 1268 | 4093 | 1330 | ||||||
| One perpendicular bridge (Mst = 700 t) | 20.53 | 12.49 | 2196 | 1325 | 2061 | 1294 | ||||||
| Position | Bridge (Mst = 350 t) | Bridge (Mst = 700 t) | Three dissimilar bridges | |||||||||
| ast | acap | ast | acap | Pile (2) (Mst = 350 t) | Pile (15) (Mst = 700 t) | Pile (1) (Mst = 350 t) | Pile (7) (Mst = 700 t) | |||||
| Parallel | 11.5 | 6.61 | 8.45 | 5.78 | 1981 | 1169 | 1218 | 1090 | 1890 | 1309 | 1218 | 1090 |
| Perpendicular | 0.54 | 6.52 | 1.83 | 1.44 | 501.9 | 155.4 | 1508 | 363.1 | 490.4 | 161.2 | 1438 | 328.6 |
| Crossing | 0.53 | 6.47 | 2.46 | 1.34 | 457.8 | 143.2 | 1367 | 545 | 478.7 | 159.6 | 1367 | 545.2 |
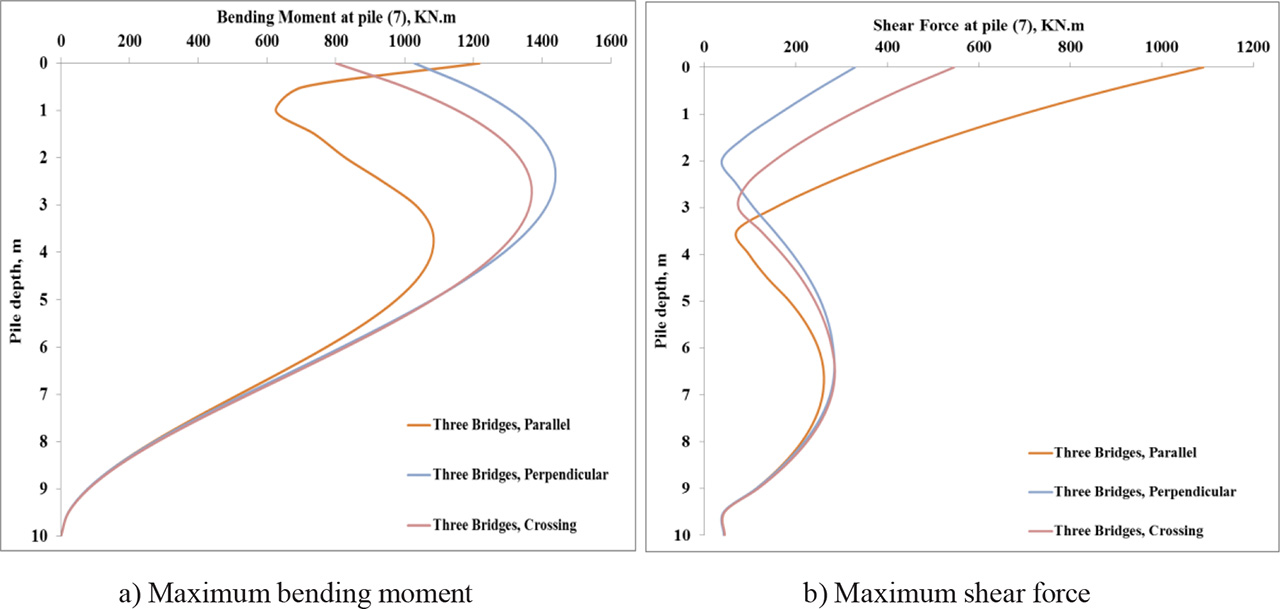
Figure 22:
Three dissimilar bridges: Internal forces at corner pile (7) of the bridge (700 t).
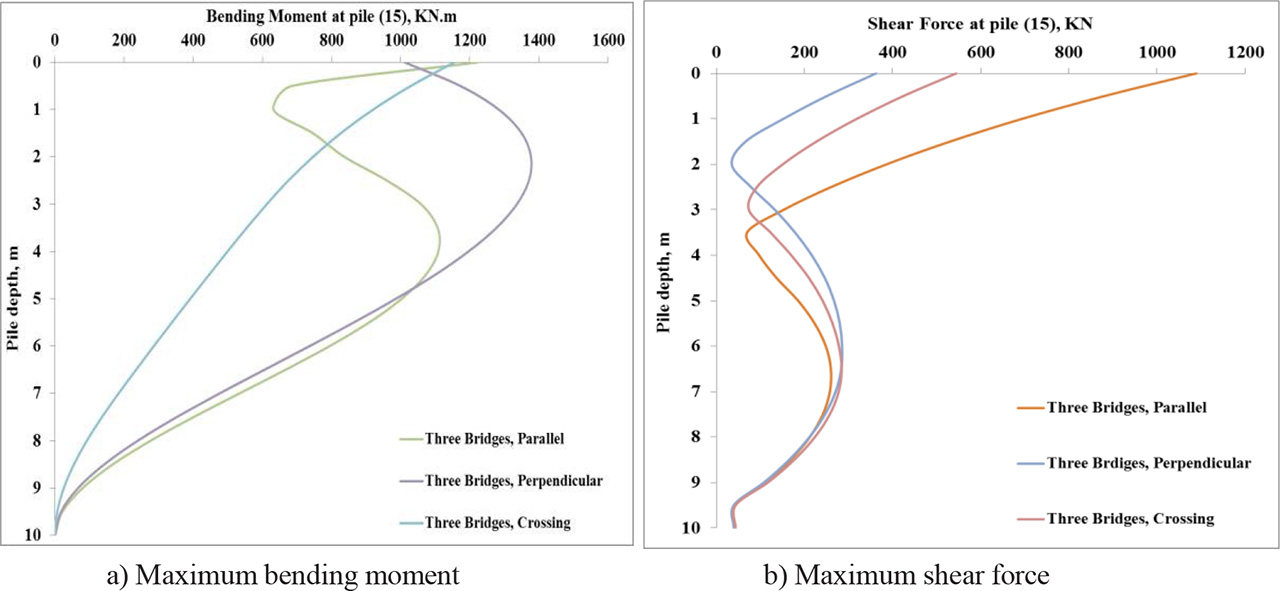
Figure 23:
Three dissimilar bridges: Internal forces at central pile (15) of the bridge (700 t).
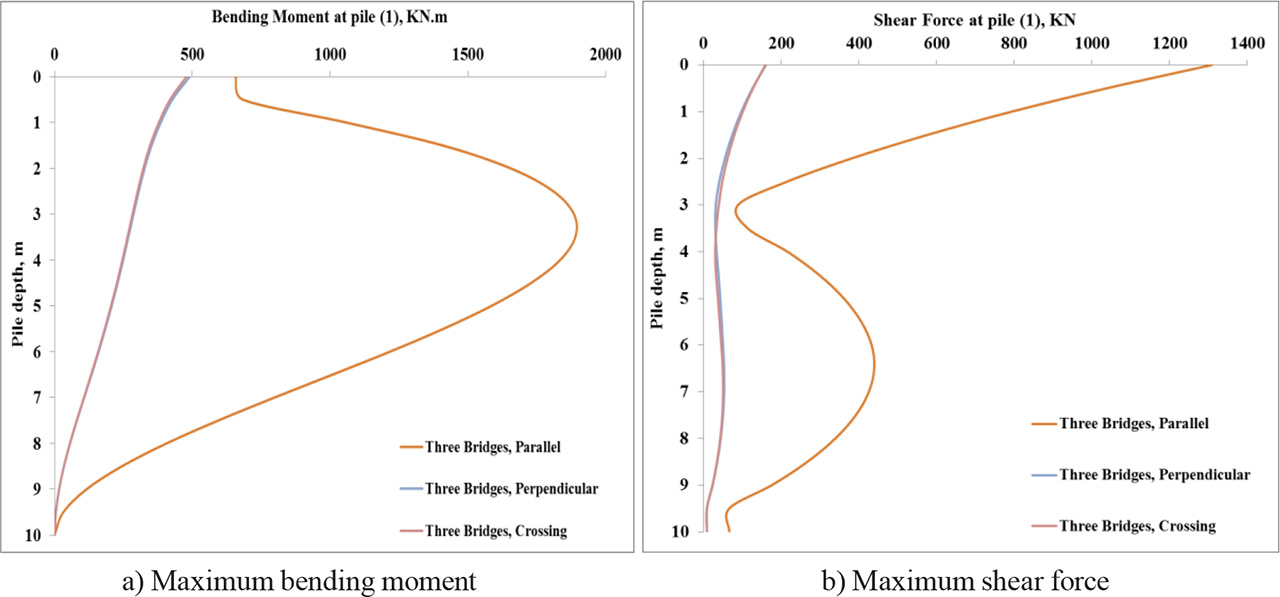
Figure 24:
Three dissimilar bridges: Internal forces at corner pile (1) of the bridge (350 t).
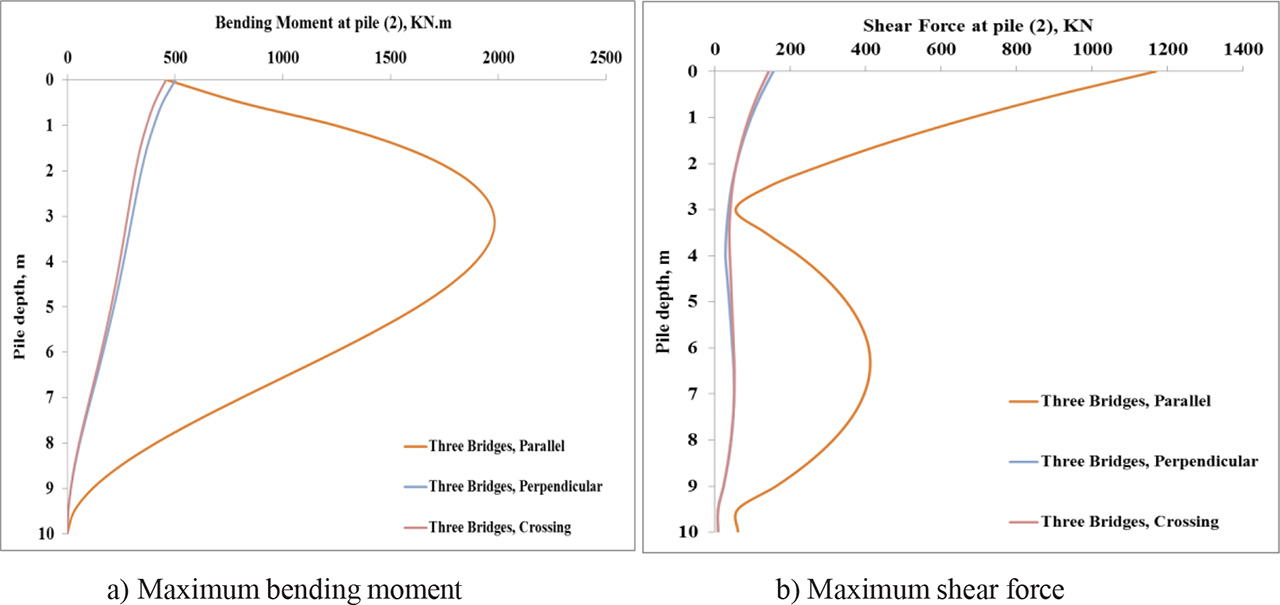
Figure 25:
Three dissimilar bridges: Internal forces at central pile (2) of the bridge (350 t).
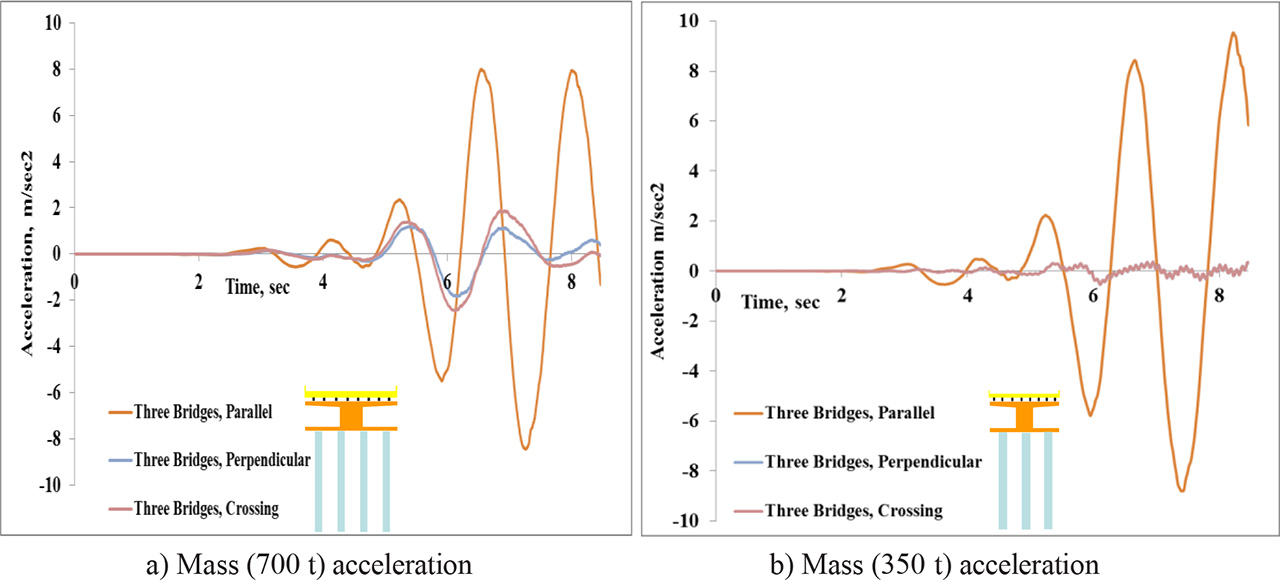
Figure 26:
Three dissimilar bridges: Masses accelerations.
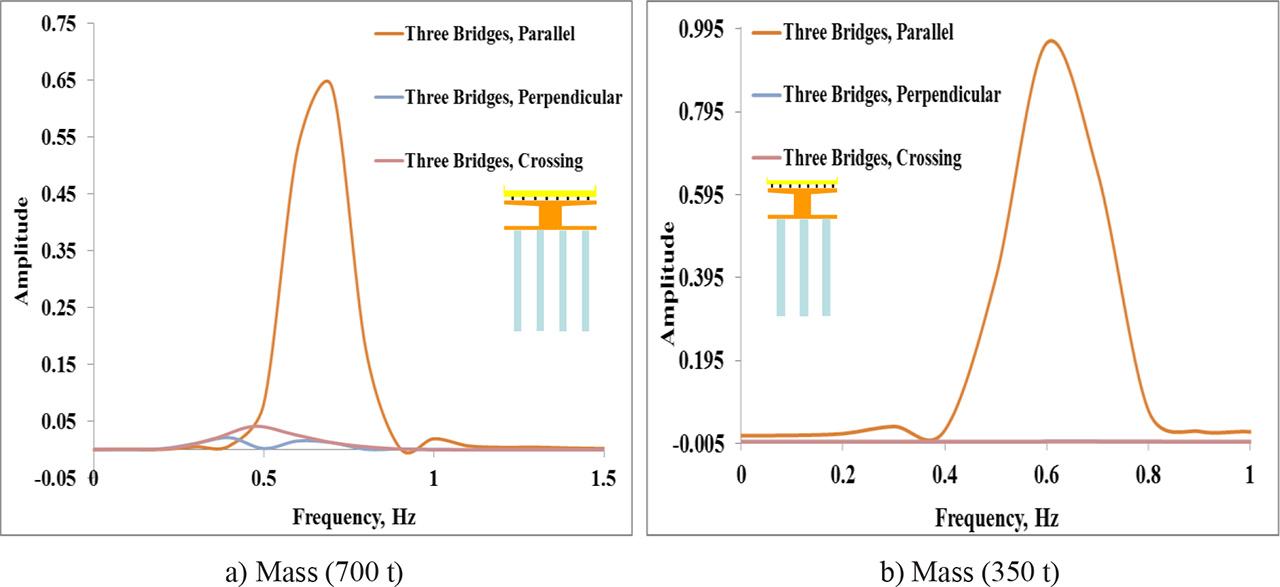
Figure 27:
Three dissimilar bridges: Fourier spectra diagram.
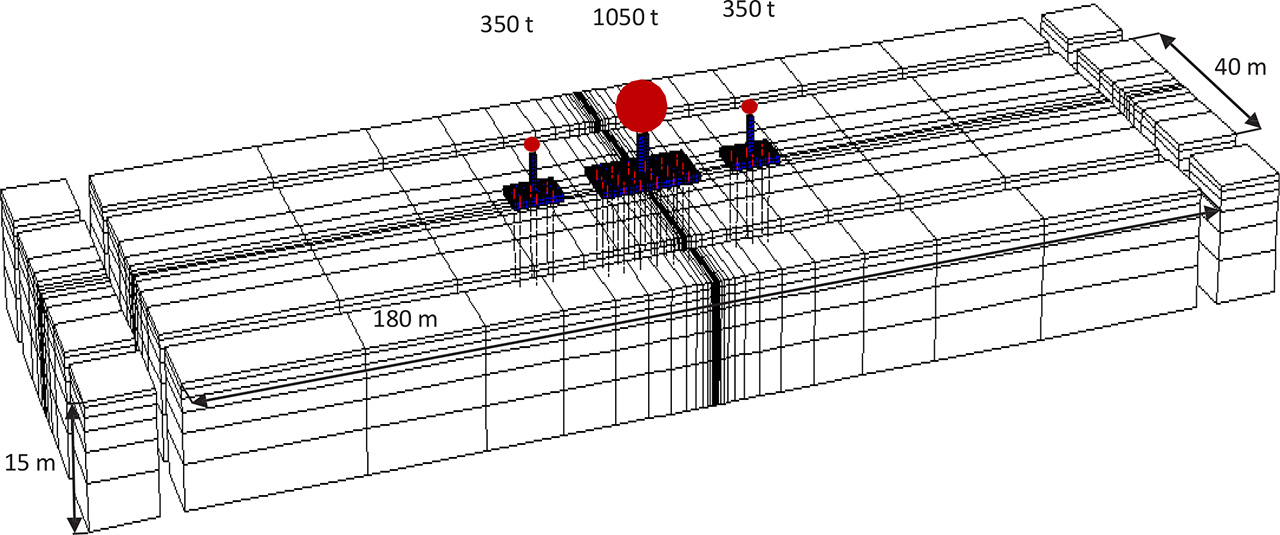
Figure 28:
Parallel bridges system 3D numerical mesh with adsorbing boundaries (552 structural elements and 33,072 nodes).
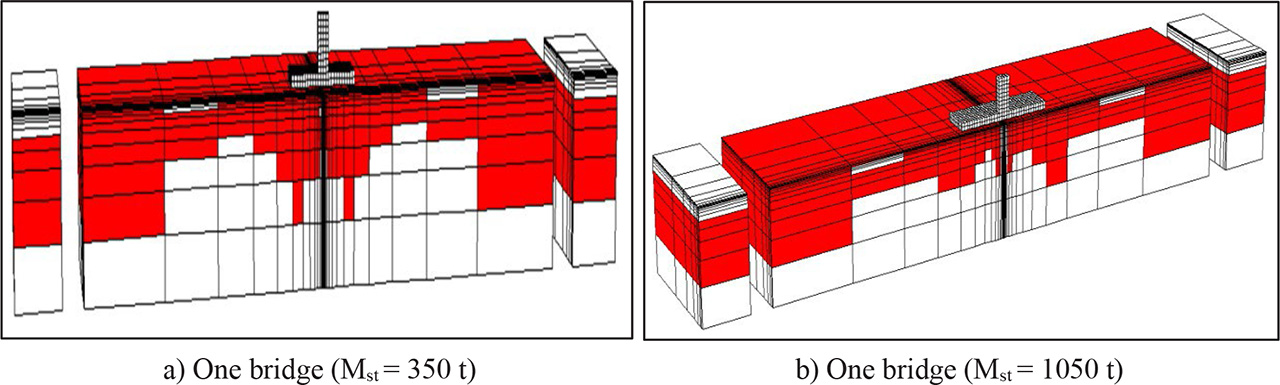
Figure 29:
Distribution of plasticity for two single isolated bridges.
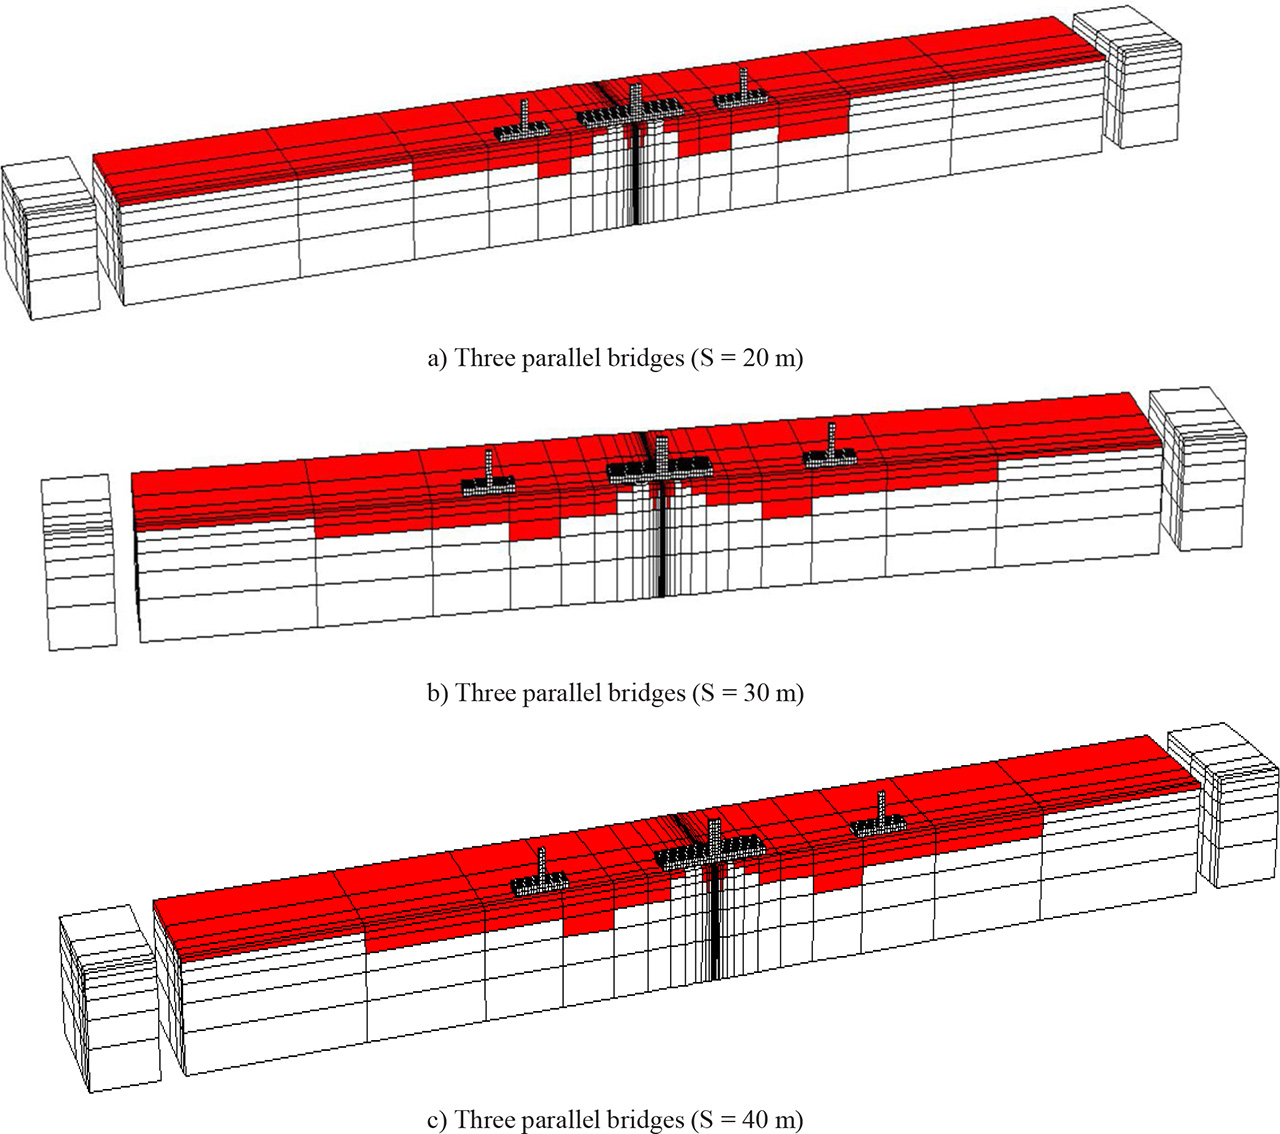
Figure 30:
Distribution of plasticity (red zones) for different spacing between the three dissimilar bridges (Mst = 350, 1050 T, and 350 t).
Table 9:
Influence of inter-bridge spacing on the seismic response of three dissimilar parallel bridges system
 | ||||||||||||
|---|---|---|---|---|---|---|---|---|---|---|---|---|
| S (m) | ast (m/s2) | acap (m/s2) | Internal forces | |||||||||
| Central piles | Corner piles | |||||||||||
| Pile (2) (Mst = 350 t) | Pile (15) (Mst = 1050 t) | Pile (1) (Mst = 350 t) | Pile (7) (Mst = 1050 t) | |||||||||
| Mmax (kN m) | Tmax (kN) | Mmax (kN m) | Tmax (kN) | Mmax (kN m) | Tmax (kN) | Mmax (kN m) | Tmax (kN) | |||||
| One bridge (Mst = 350 t and S = 0) | 20.1 | 11.5 | 3979 | 1268 | 4093 | 1330 | ||||||
| One bridge (Mst = 1050 t and S = 0) | 20.53 | 12.49 | 2196 | 1325 | 2061 | 1294 | ||||||
| S (m) | Bridge (Mst = 350 t) | Bridge (Mst = 1050 t) | Three dissimilar bridges | |||||||||
| Ast | acap | Ast | acap | Pile (2) (Mst = 350 t) | Pile (15) (Mst = 1050 t) | Pile (1) (Mst = 350 t) | Pile (7) (Mst = 1050 t) | |||||
| 20 m | 11.6 | 11.6 | 5.78 | 4.58 | 2091 | 1189 | 1260 | 294.8 | 1929 | 1236 | 1496 | 426.3 |
| 30 m | 12.1 | 12.2 | 5.95 | 4.79 | 2166 | 1271 | 1322 | 305.4 | 1969 | 1283 | 1517 | 428 |
| 40 m | 12.7 | 12.7 | 6.15 | 5.12 | 2241 | 1360 | 1392 | 316 | 2017 | 1333 | 1552 | 433 |
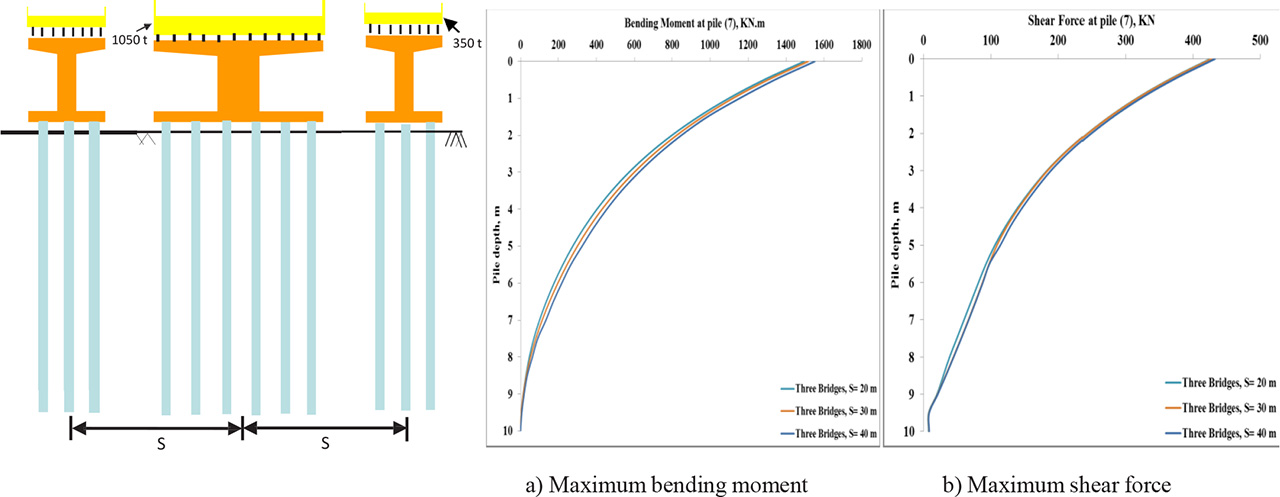
Figure 31:
Three dissimilar parallel bridges: Internal forces at corner pile (7) of the bridge (1050 t).
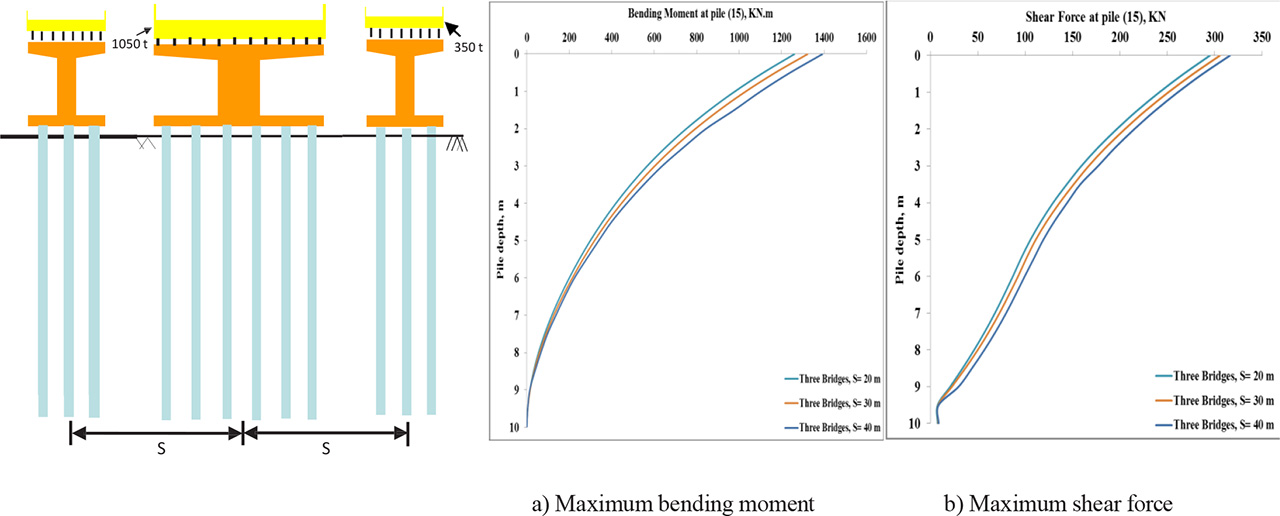
Figure 32:
Three dissimilar parallel bridges: Internal forces at corner pile (15) of the bridge (1050 t).
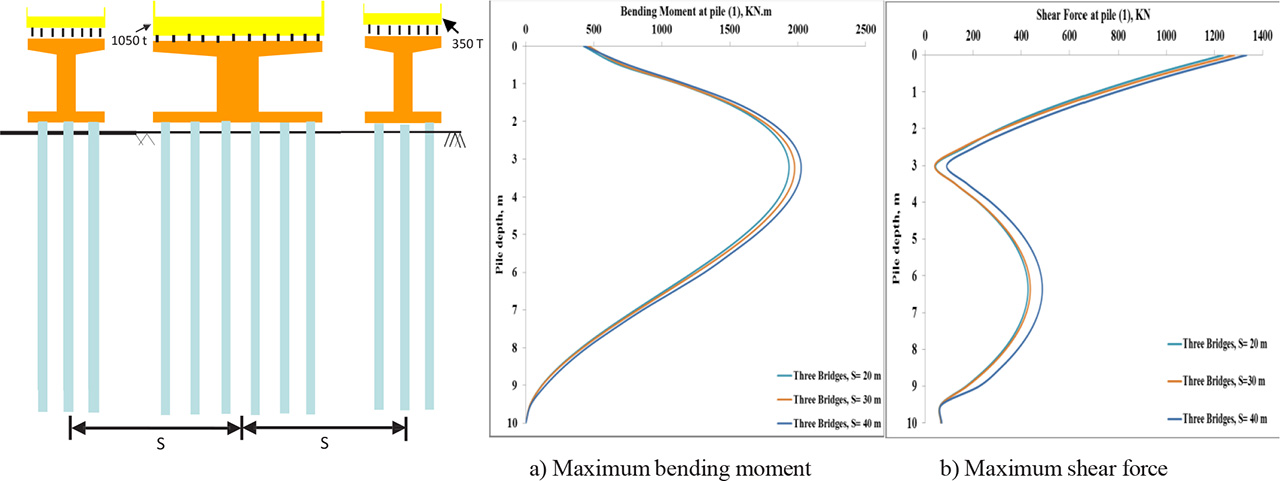
Figure 33:
Three dissimilar parallel bridges: Internal forces at corner pile (1) of the bridge (350 t).
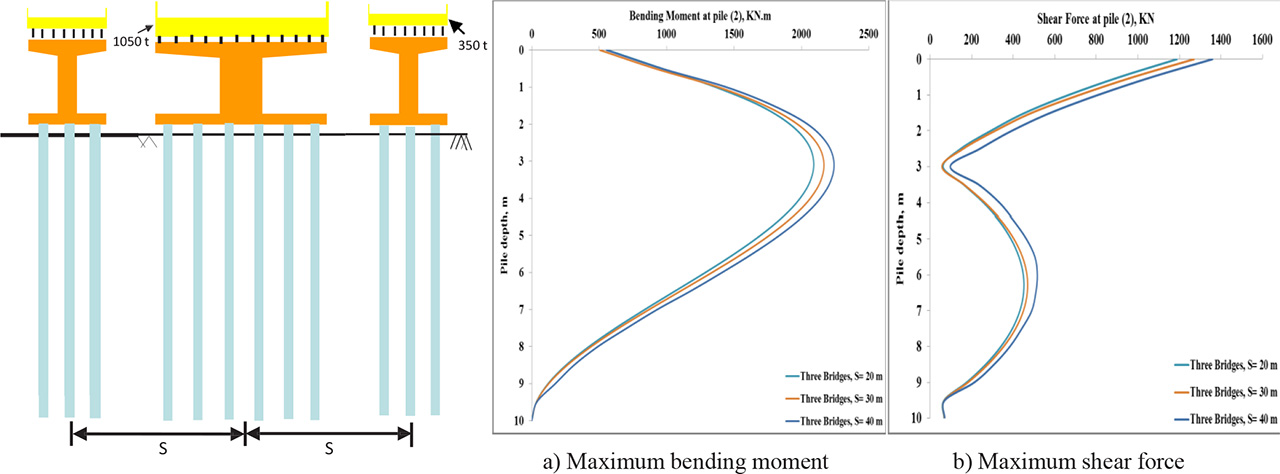
Figure 34:
Three dissimilar parallel bridges: Internal forces at central pile (2) of the bridge (350 t).
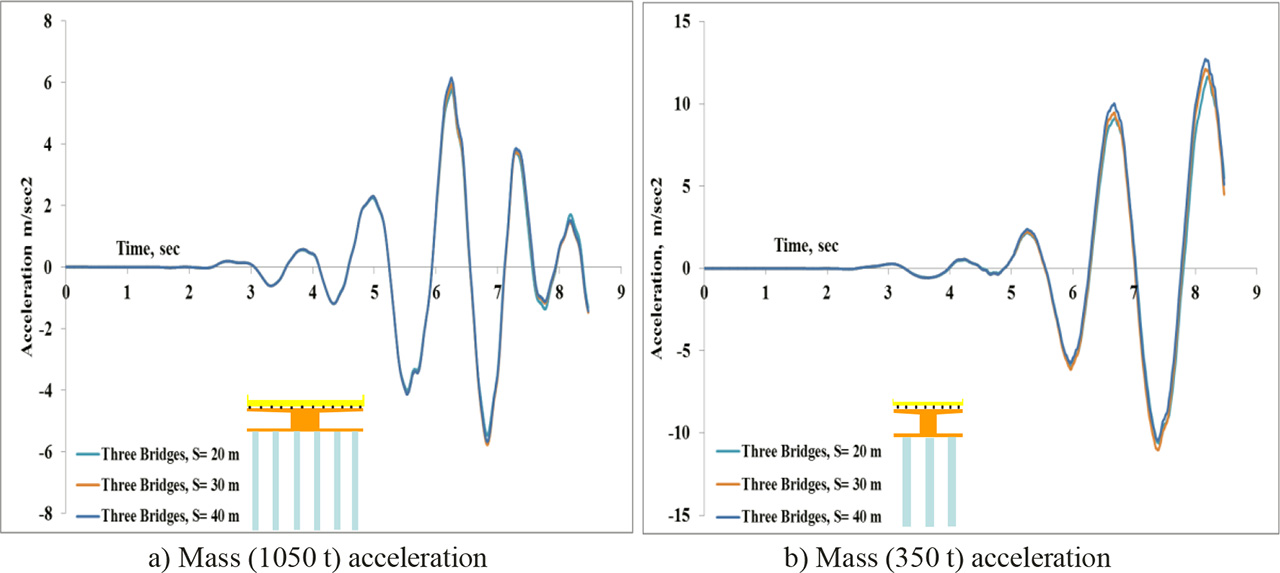
Figure 35:
Three dissimilar parallel bridges: Masses accelerations.
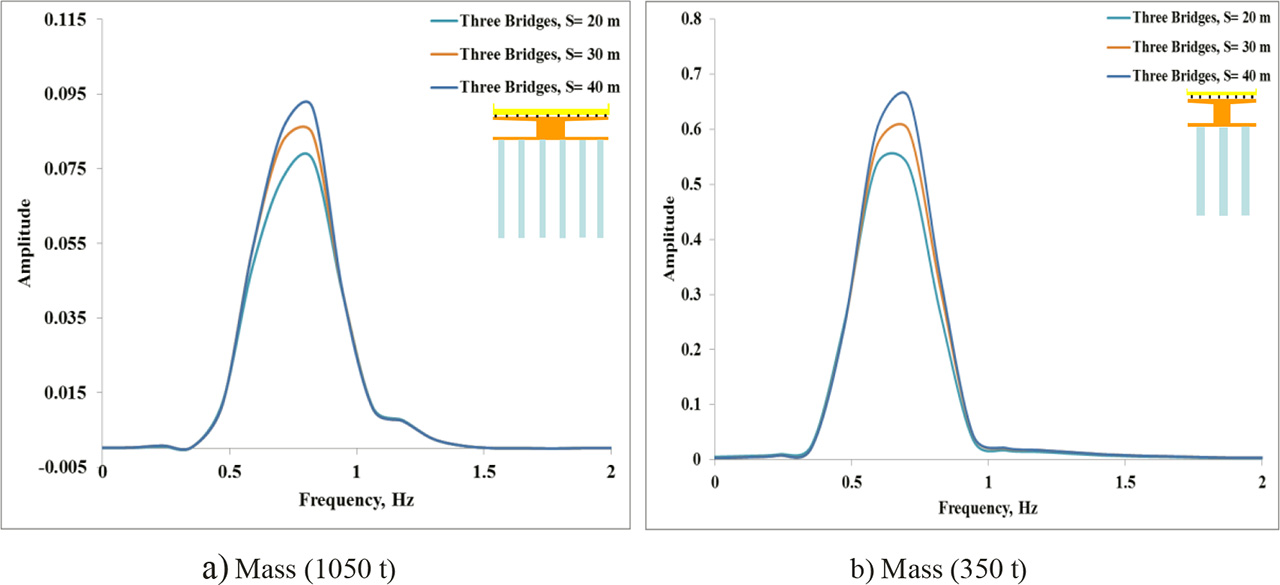
Figure 36:
Three dissimilar parallel bridges: Fourier spectra diagram.
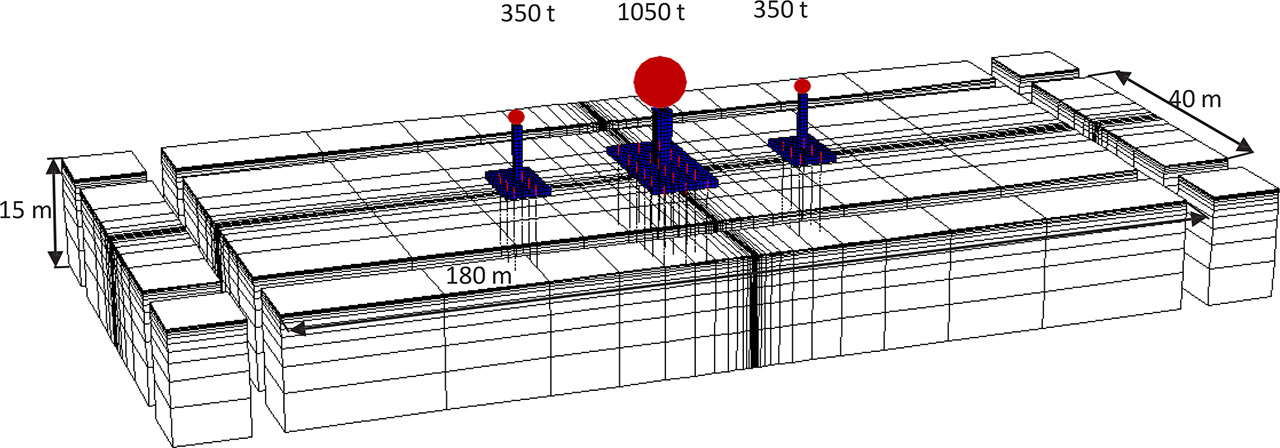
Figure 37:
Bridge–soil–bridge system 3D numerical mesh with adsorbing boundaries (690 structural elements and 78,286 nodes).
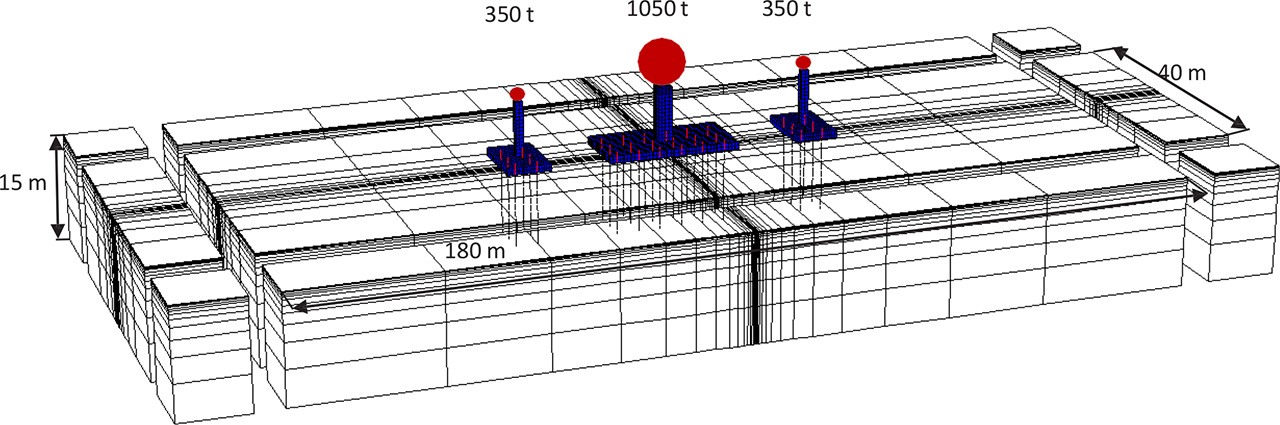
Figure 38:
Bridge–soil–bridge system 3D numerical mesh with adsorbing boundaries (690 structural elements and 78,286 nodes).
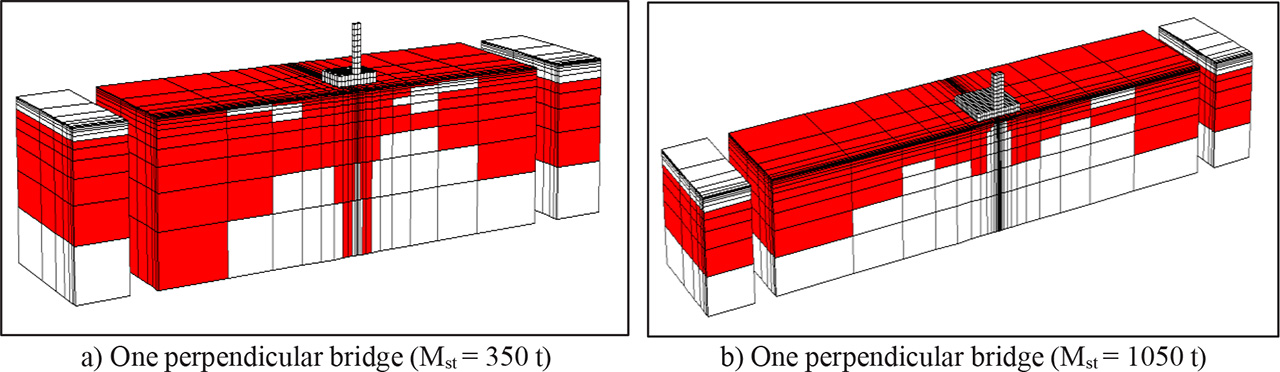
Figure 39:
Distribution of plasticity for two single isolated bridges (Mst = 350 and 1050 t).
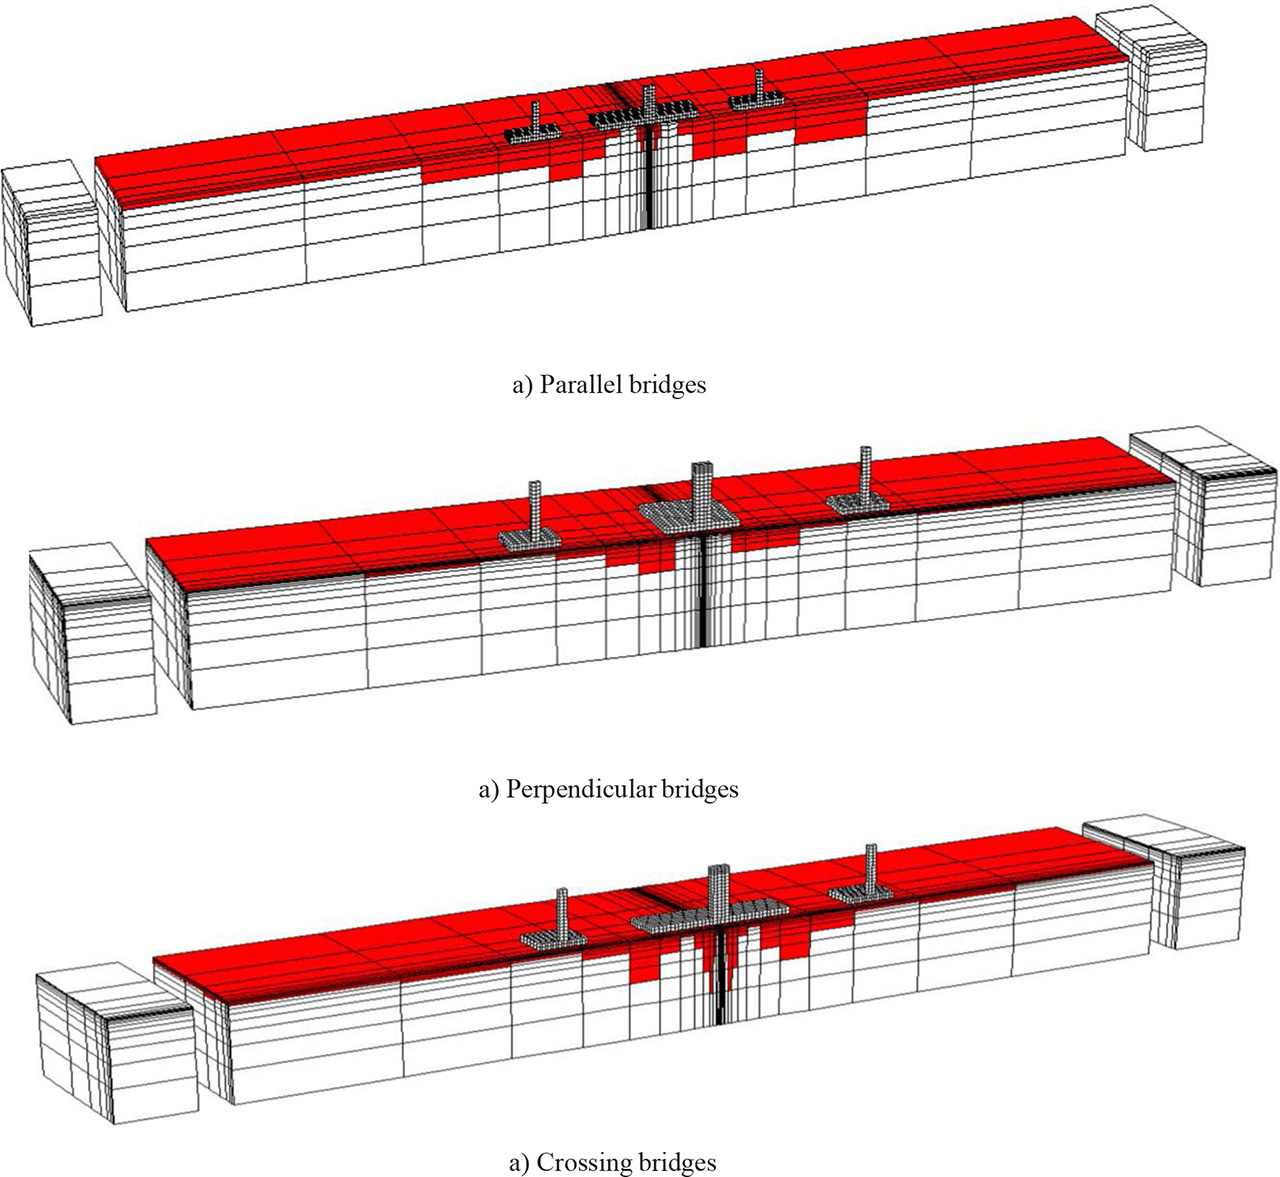
Figure 40:
Distribution of plasticity (red zones) for different positioning of the three dissimilar bridges (Mst = 350, 1050, and 350 t).
Table 10:
Influence of different positioning of three dissimilar bridges on the seismic response system.
| Position | ast (m/s2) | acap (m/s2) | Internal forces | |||||||||
|---|---|---|---|---|---|---|---|---|---|---|---|---|
| Central piles | Corner piles | |||||||||||
| Pile (2) (Mst = 350 t) | Pile (15) (Mst = 1050 t) | Pile (1) (Mst = 350 t) | Pile (7) (Mst = 1050 t) | |||||||||
| Mmax (kN m) | Tmax (kN) | Mmax (kN m) | Tmax (kN) | Mmax (kN m) | Tmax (kN) | Mmax (kN m) | Tmax (kN) | |||||
| One perpendicular bridge (Mst = 350 t) | 20.1 | 11.5 | 3979 | 1268 | 4093 | 1330 | ||||||
| One perpendicular bridge (Mst = 1050 t) | 20.53 | 12.49 | 2196 | 1325 | 2061 | 1294 | ||||||
| Position | Bridge (Mst = 350 t) | Bridge (Mst = 1050 t) | Three dissimilar bridges | |||||||||
| ast | acap | ast | acap | Pile (2) (Mst = 350 t) | Pile (15) (Mst = 1050 t) | Pile (1) (Mst = 350 t) | Pile (7) (Mst = 1050 t) | |||||
| Parallel | 11.6 | 11.6 | 5.78 | 4.58 | 2091 | 1189 | 1260 | 294.8 | 1929 | 1236 | 1496 | 426.3 |
| Perpendicular | 0.54 | 6.47 | 2.81 | 1.17 | 411.8 | 113.4 | 1580 | 282.7 | 388 | 130.5 | 1578 | 456.2 |
| Crossing | 0.51 | 6.3 | 5.67 | 2.39 | 370.2 | 110.6 | 1042 | 589.7 | 360.8 | 123.2 | 2412 | 1274 |
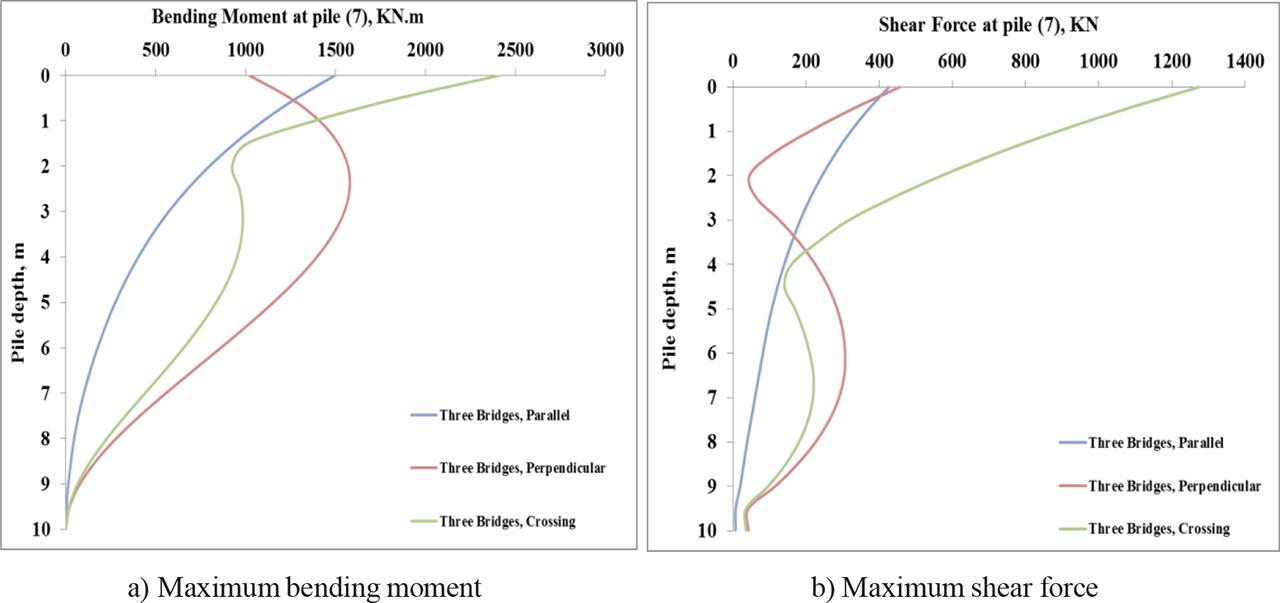
Figure 41:
Three dissimilar bridges: Internal forces at corner pile (7) of the bridge (1050 t).
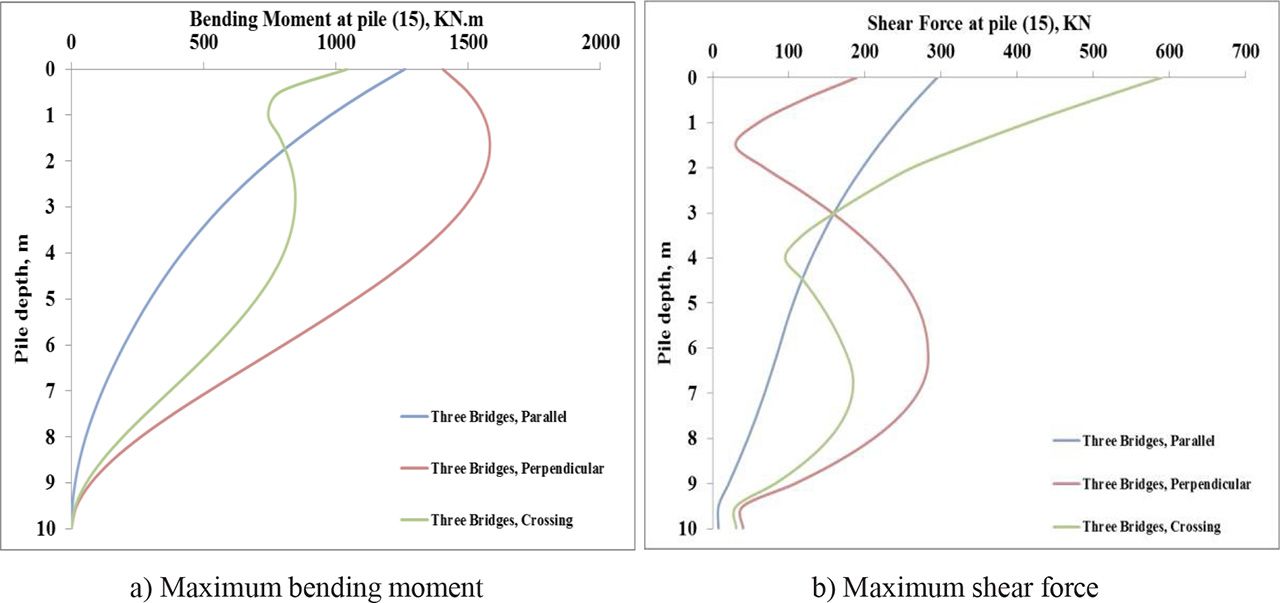
Figure 42:
Three dissimilar bridges: Internal forces at central pile (15) of the bridge (1050 t).
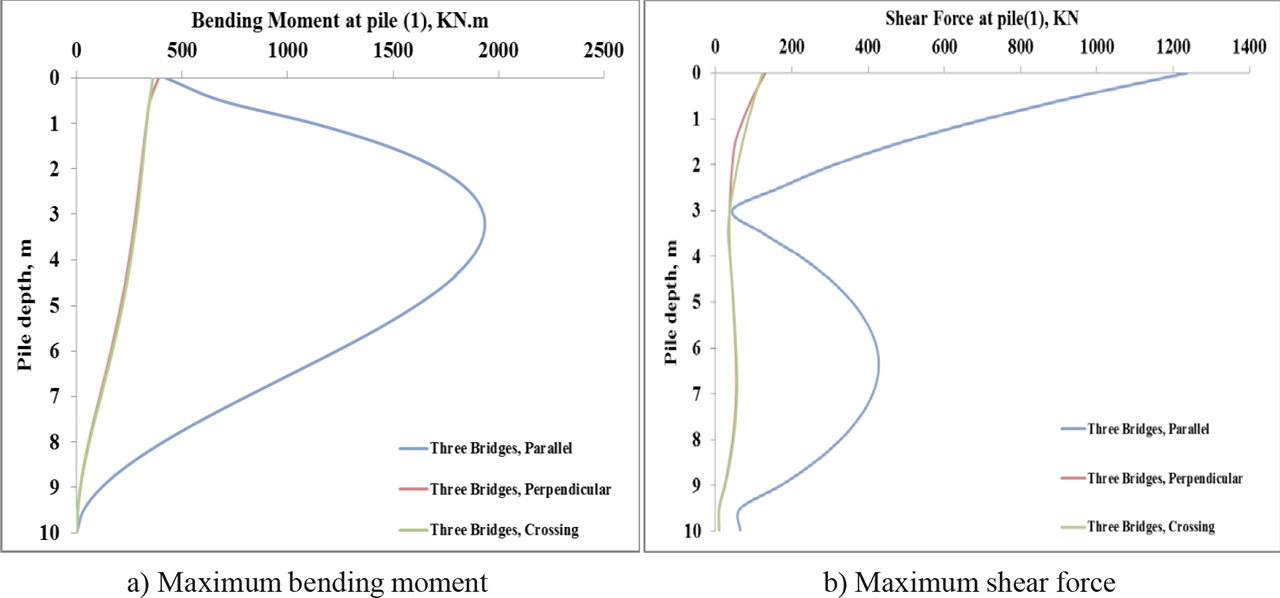
Figure 43:
Three dissimilar bridges: Internal forces at corner pile (1) of the bridge (350 t).
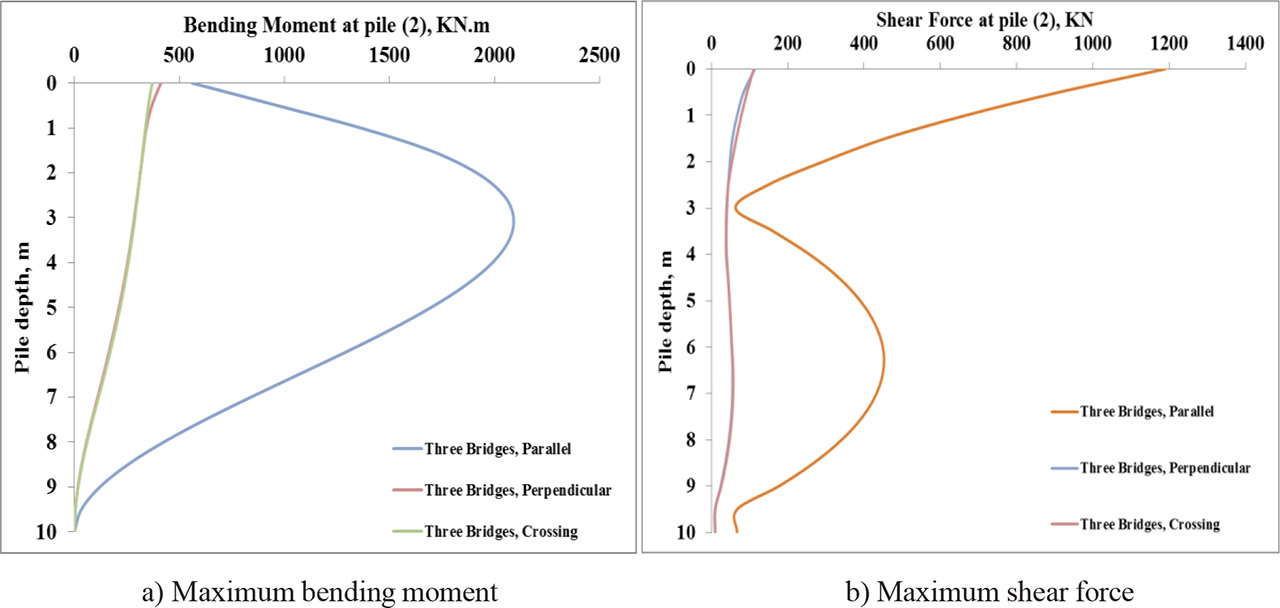
Figure 44:
Three dissimilar bridges: Internal forces at central pile (2) of the bridge (350 t).
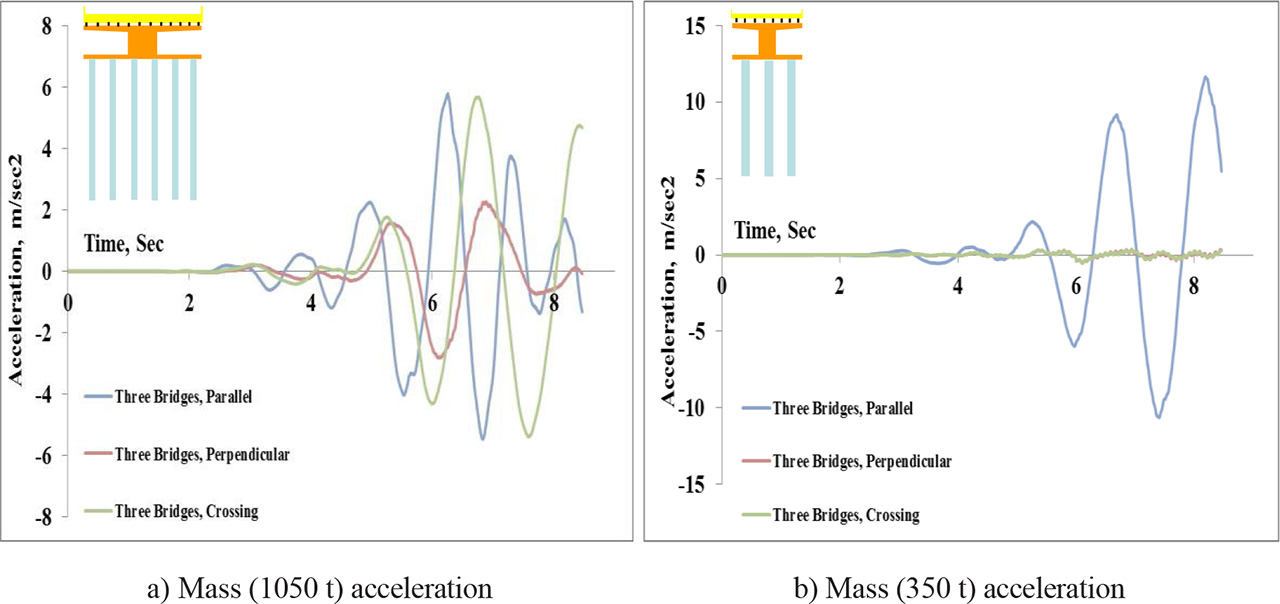
Figure 45:
Three dissimilar bridges: Masses accelerations.
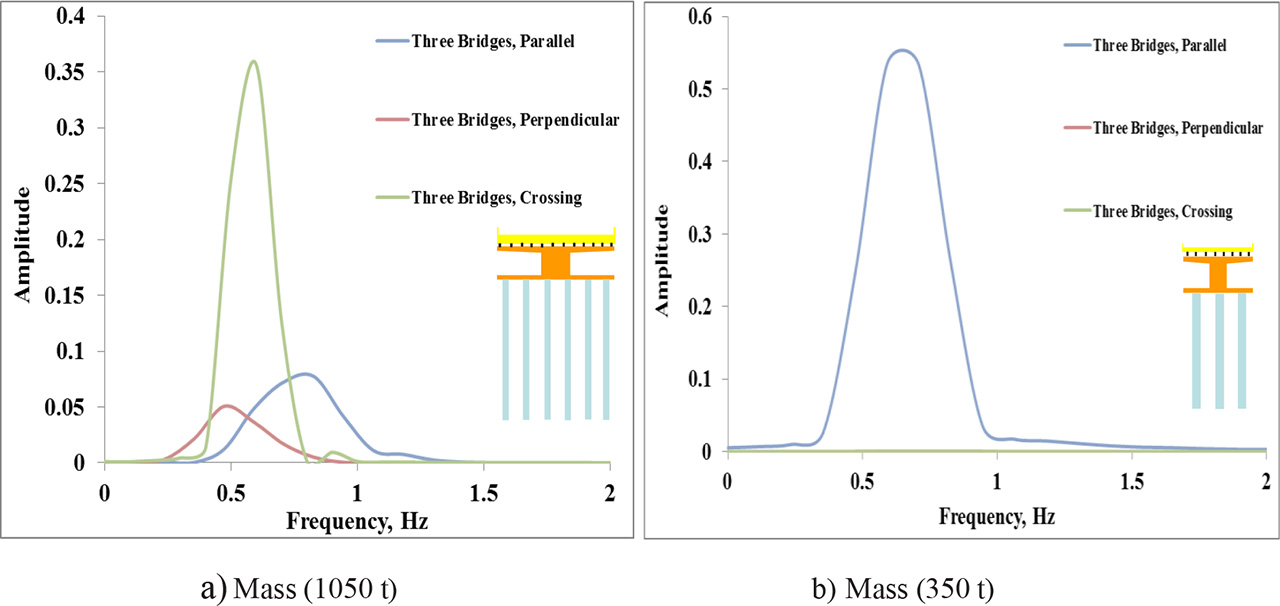
Figure 46:
Three dissimilar bridges: Fourier spectra diagram.