
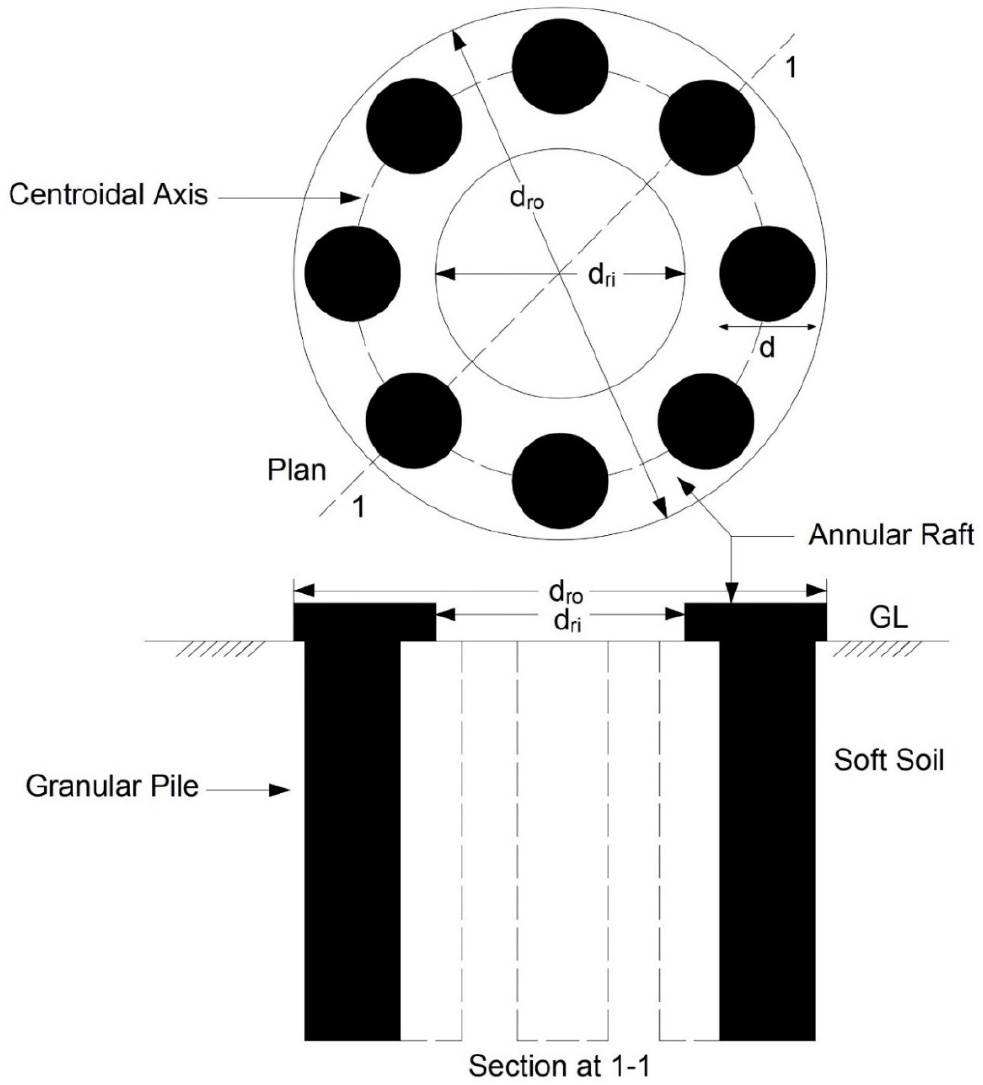
Figure 1:
Schematic diagram of the annular raft over GPs.
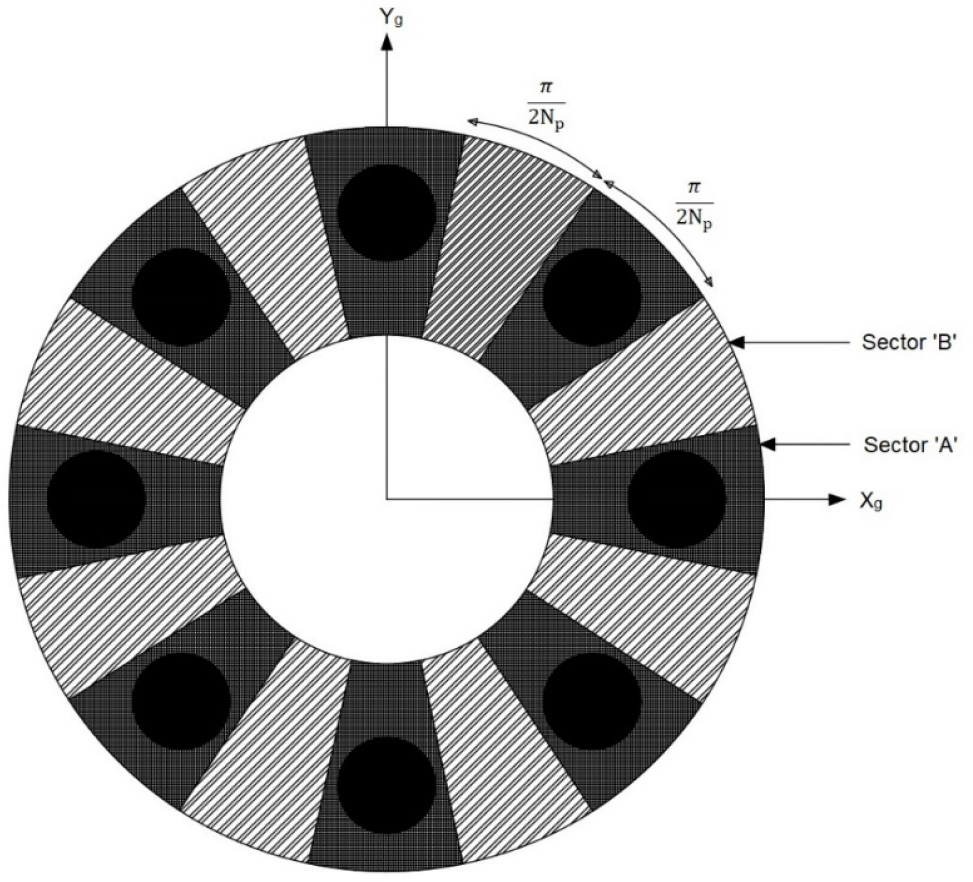
Figure 2:
Annular raft subdivisions into sectors
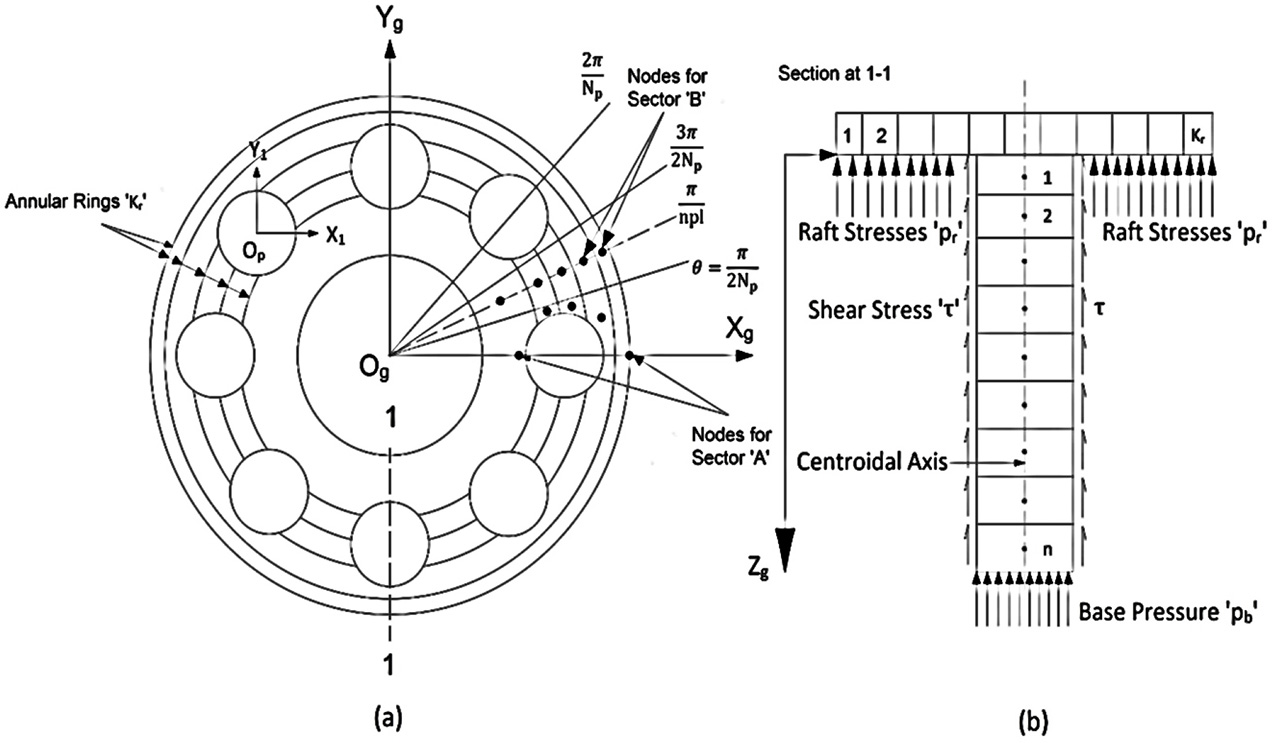
Figure 3:
Discretization of (a) annular raft and (b) granular pile.
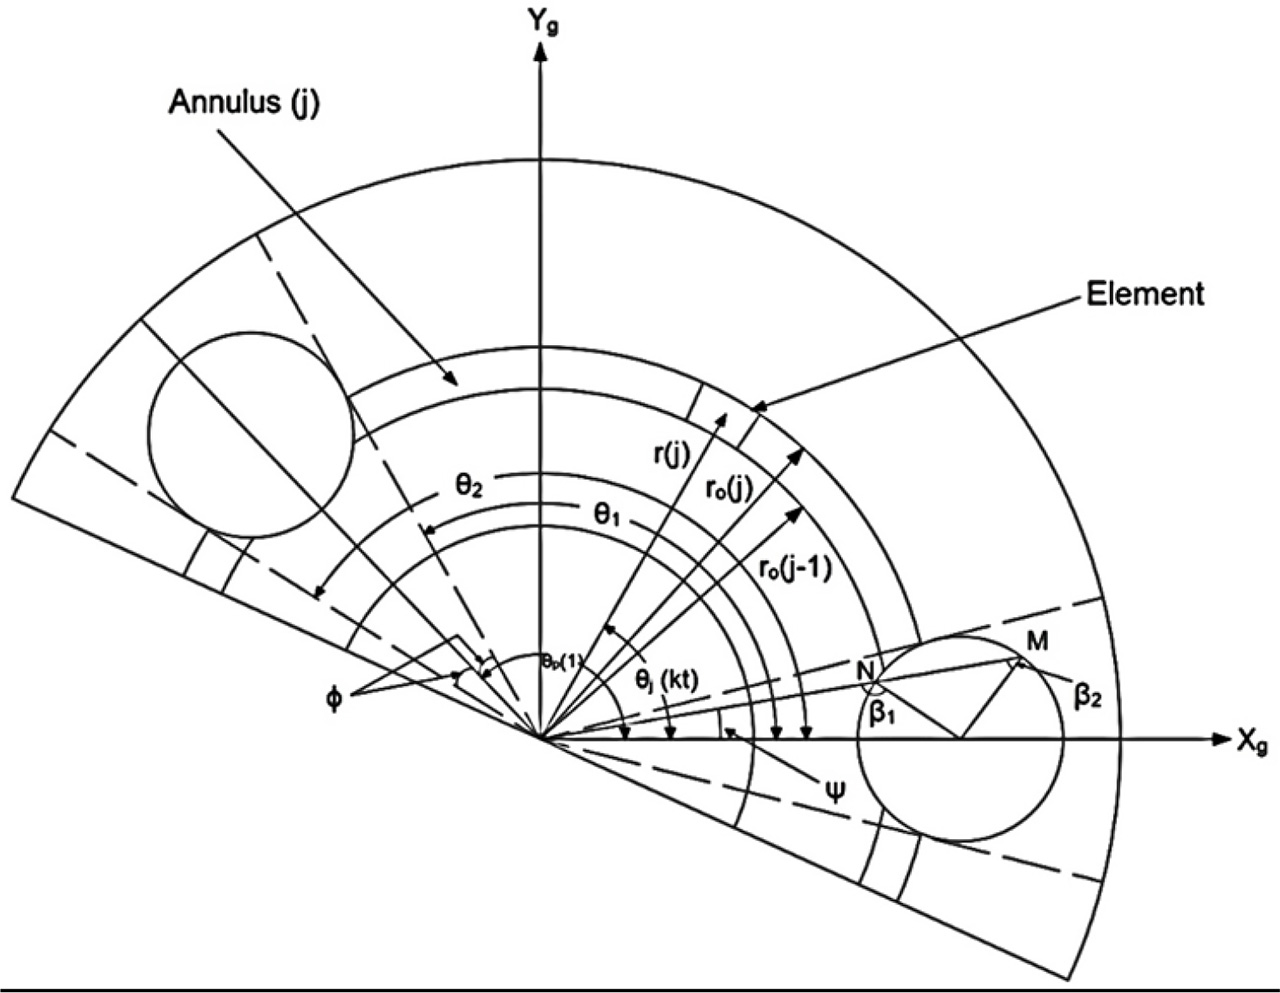
Figure 4:
Geometrical consideration in integration scheme.
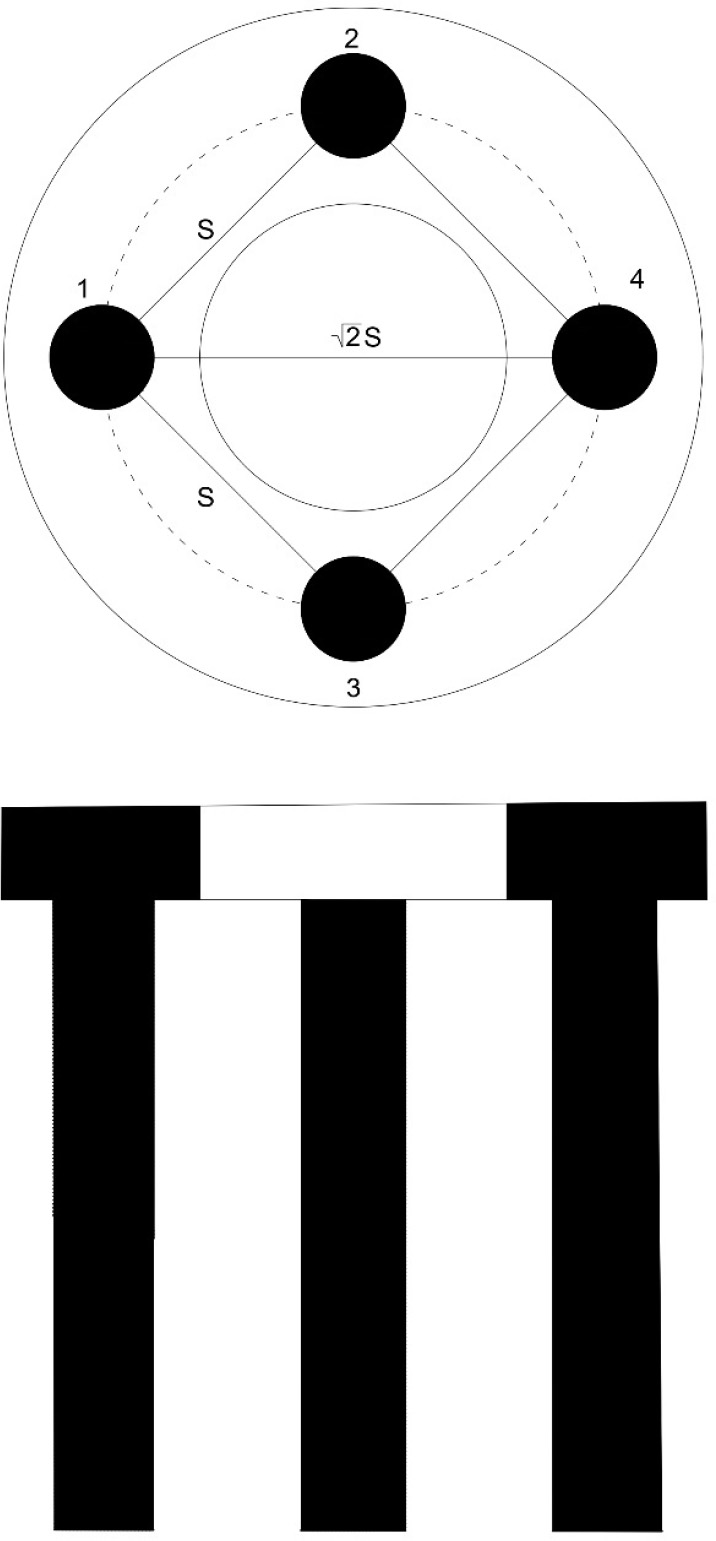
Figure 5:
Spacing of group of four GPs in terms of Dr and Dg.
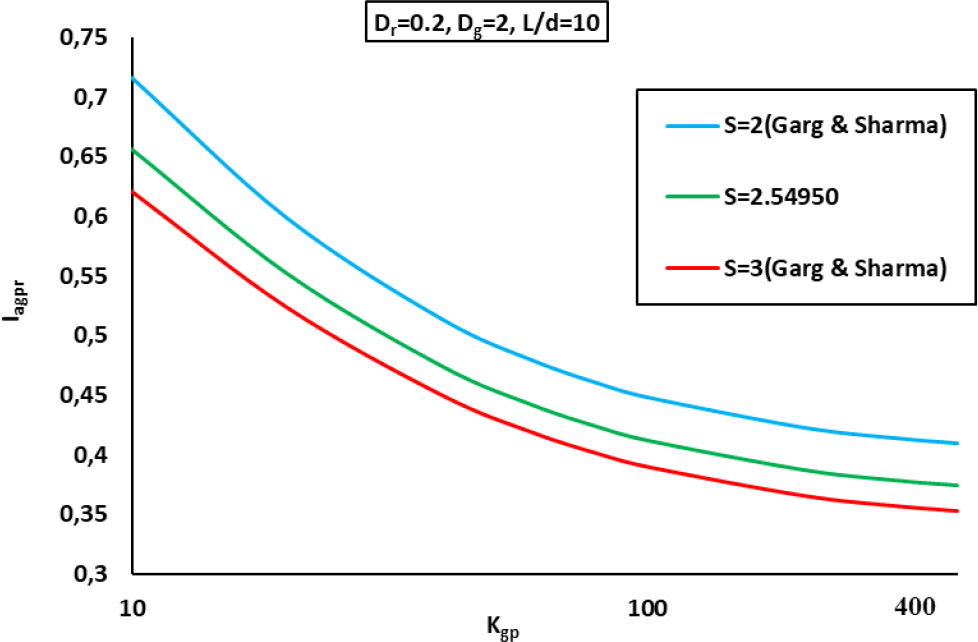
Figure 6:
Comparison of variation of SIF with Kgp for different spacing [45].
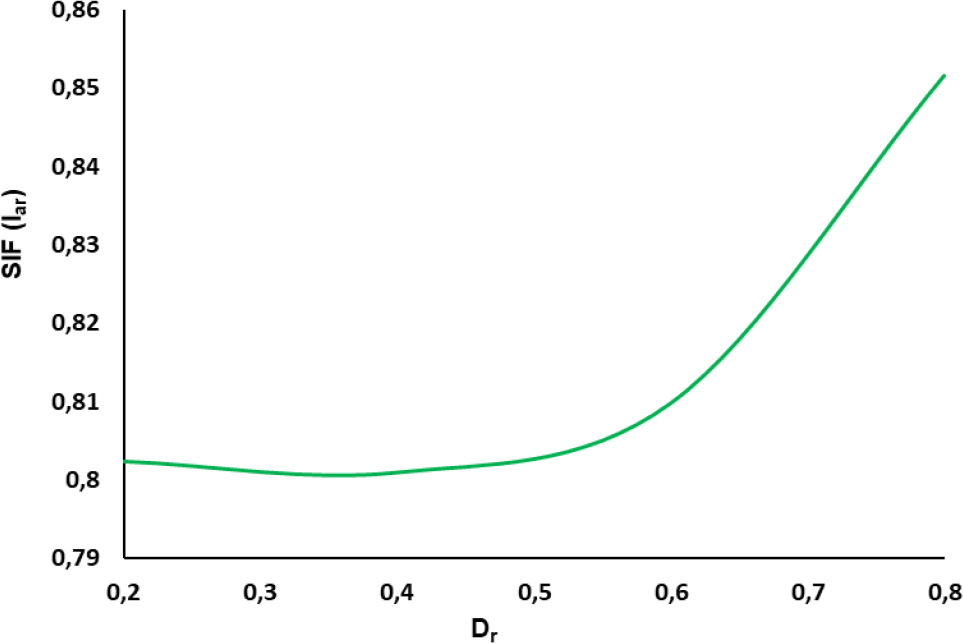
Figure 7:
Variation of SIF (only annular raft without GPs) with Dr.
Table 1:
Parameters used in the study.
| S. No. | Parameters | Corresponding values |
|---|---|---|
| 1. | Kgp | 10–400 |
| 2. | Dr | 0.2, 0.4, 0.6, 0.8 |
| 3. | Dg | 2, 3, 4, 5 |
| 4. | L/d | 5–40 |
| 5. | Np | 2–12 |
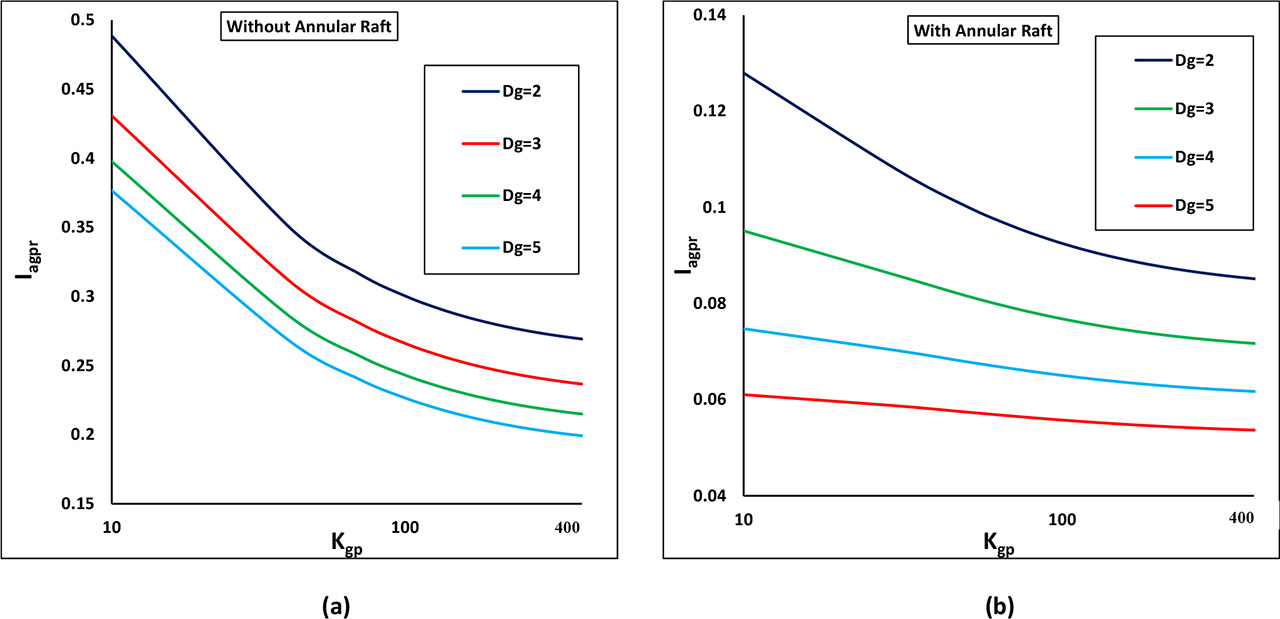
Figure 8:
Variation of Iagpr with Kgp for a group of four GPs having Dr=0.2 and L/d=10 (a) without the annular raft and (b) with the annular raft.
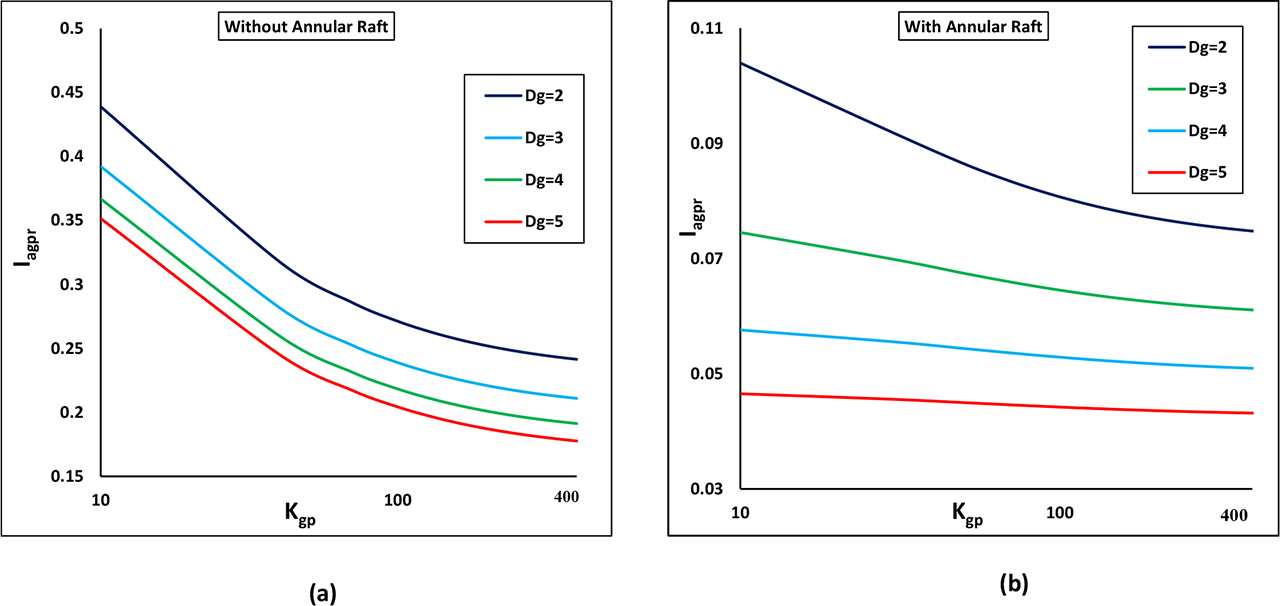
Figure 9:
Variation of Iagpr with Kgp of the group of four GPs with and without raft for Dr=0.4 and L/d=10: (a) without annular raft and (b) with annular raft.
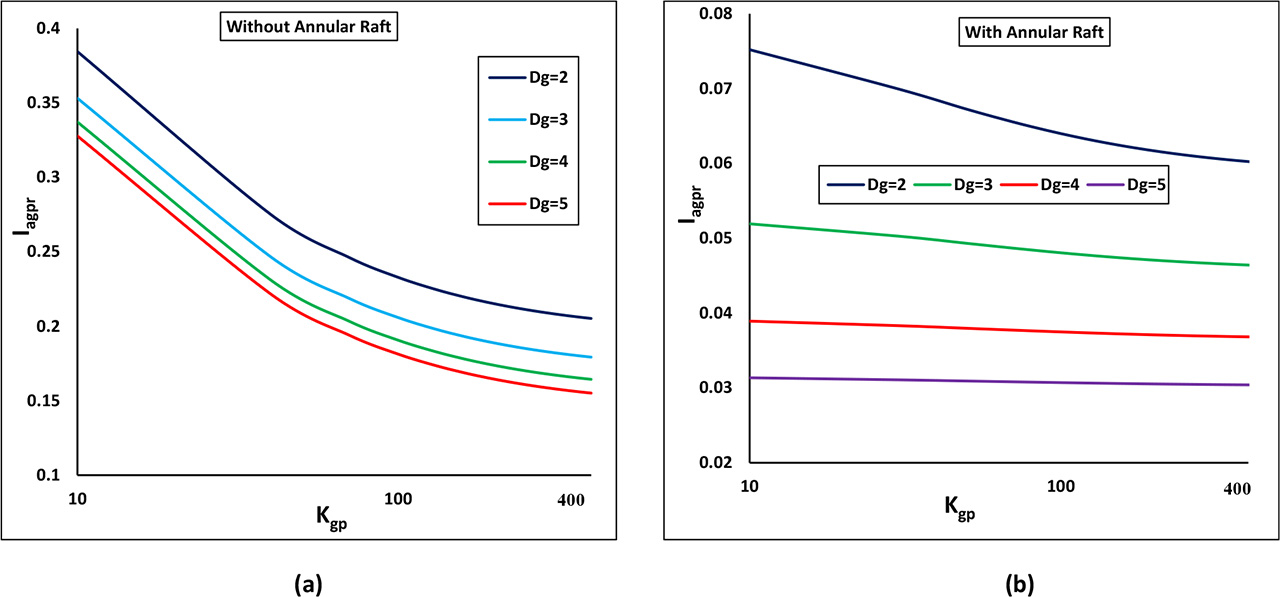
Figure 10:
Variation of Iagpr with Kgp of a group of four GPs with and without raft for Dr=0.6 and L/d=10: (a) without annular raft and (b) with annular raft.
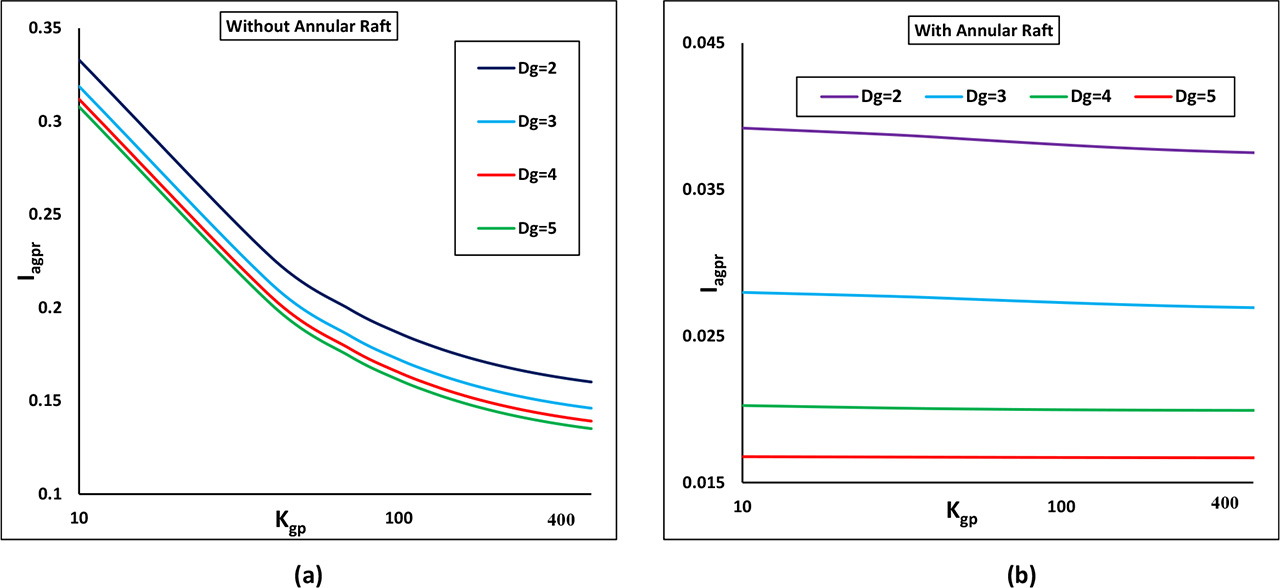
Figure 11:
Variation of Iagpr with Kgp of a group of four GPs with and without raft for Dr=0.8 and L/d=10.
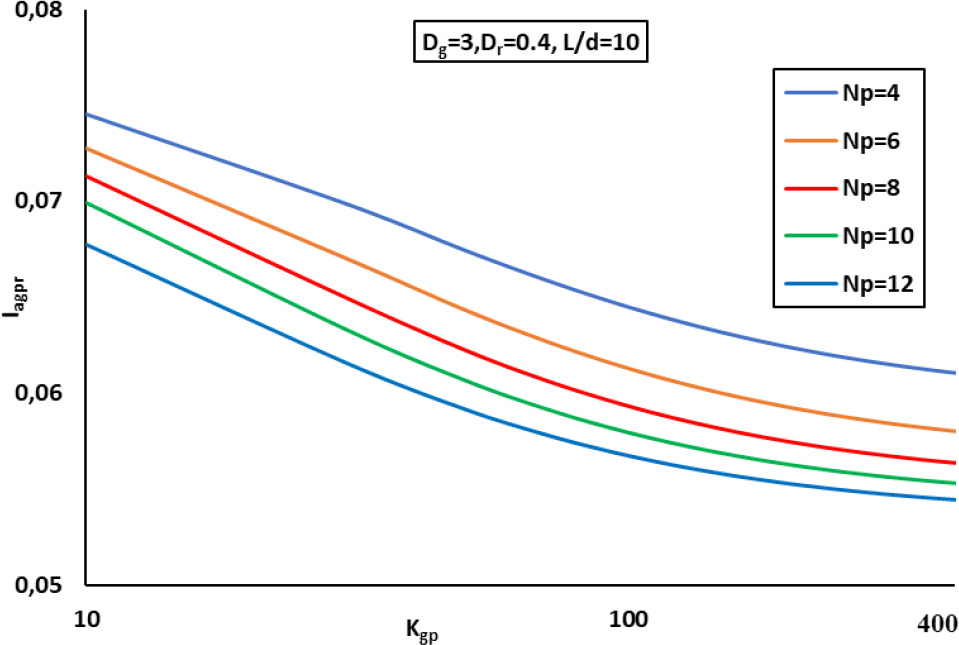
Figure 12:
Variation of Iagpr with Kgp - Effect of number of granular piles (Np).
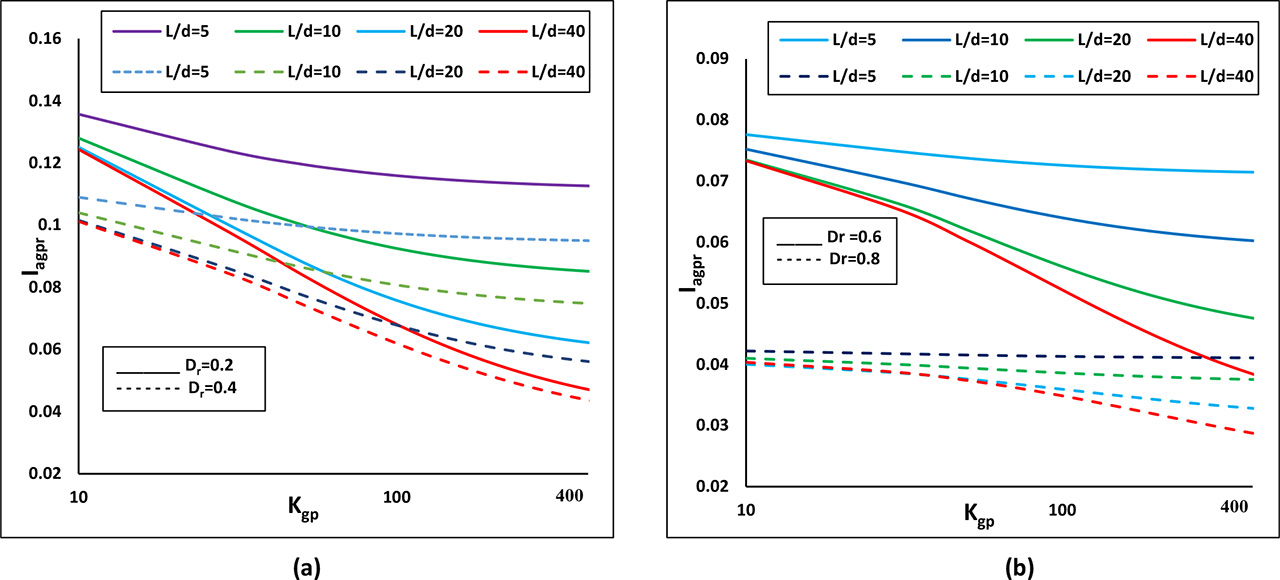
Figure 13:
Variation of Iagpr with Kgp for Dg=2, with the effect of Dr and L/d: (a) Dr=0.2 and 0.4 (b) Dr=0.6 and Dr=0.8.
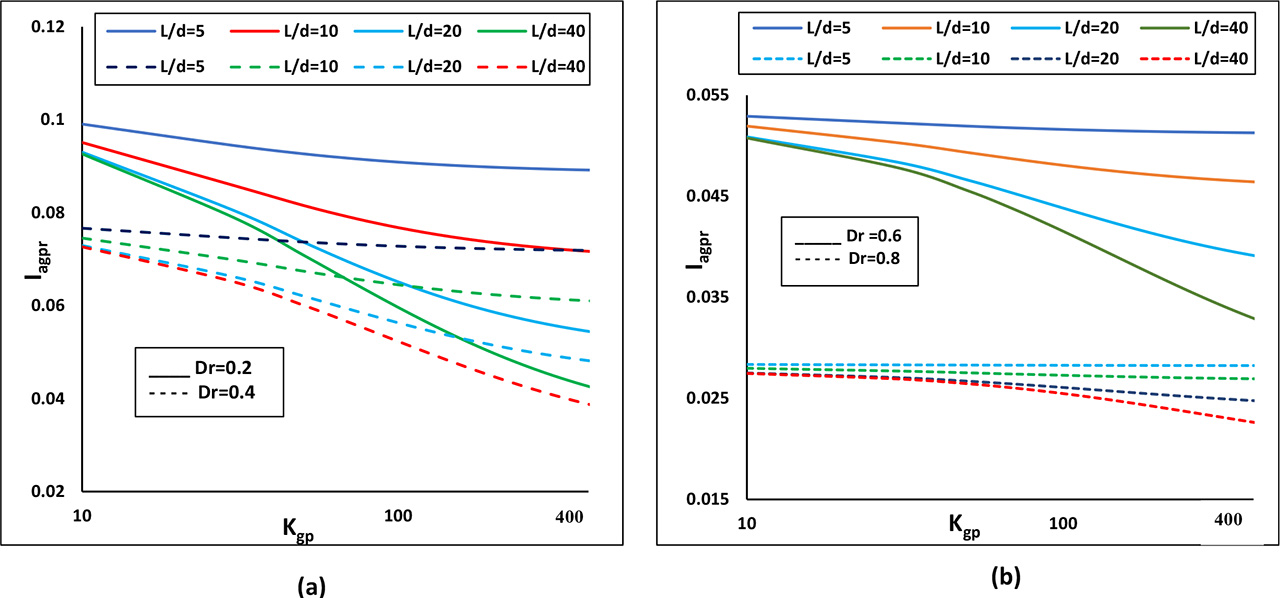
Figure 14:
Variation of Iagpr with Kgp for Dg=3 and with variation of Dr and L/d: (a) Dr=0.2 and Dr=0.4; (b) Dr=0.6 and Dr=0.8.
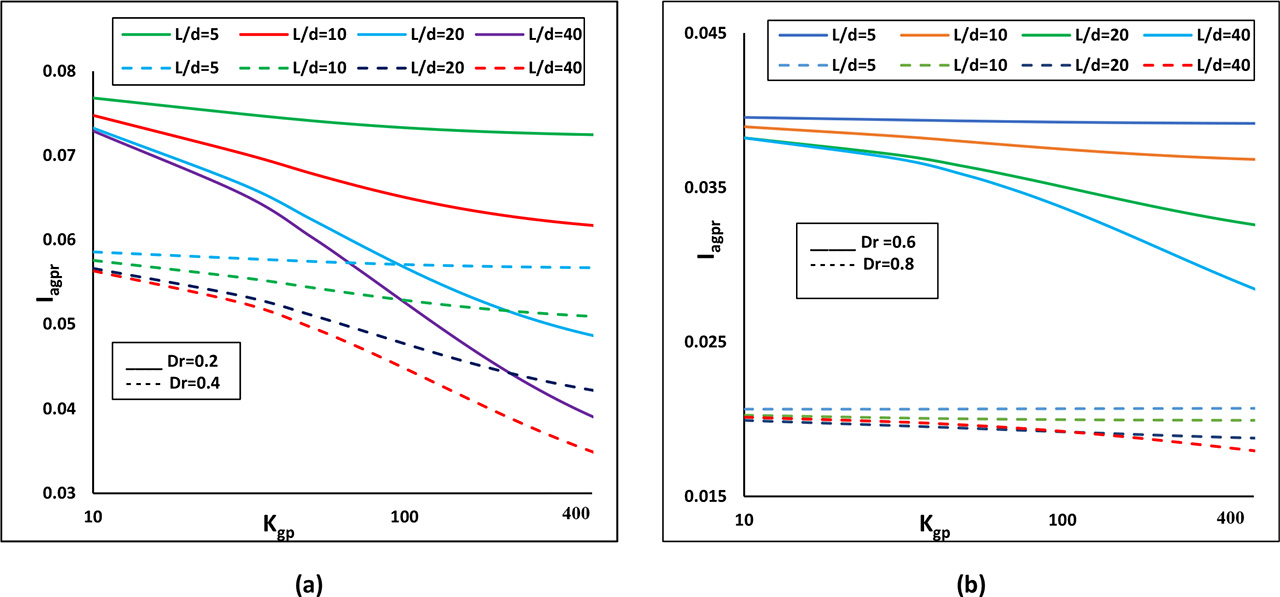
Figure 15:
Variation of Iagpr with Kgp for Dg=4 and with variation of Dr and L/d: (a) Dr=0.2 and Dr=0.4; (b) Dr=0.6 and Dr=0.8.
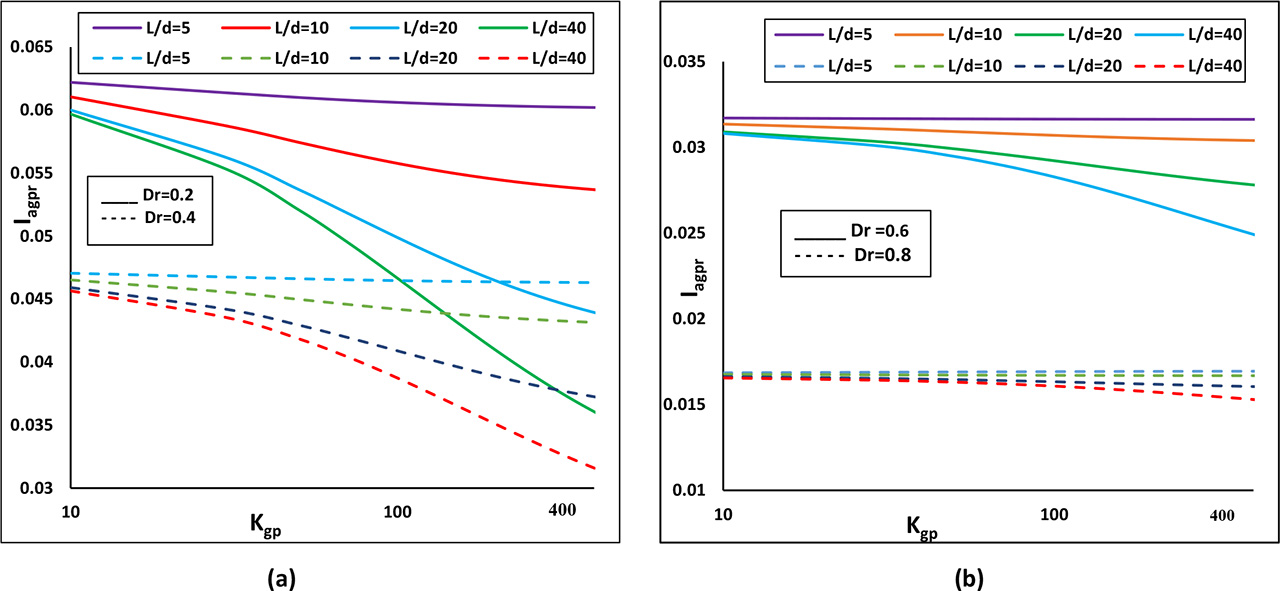
Figure 16:
Variation of Iagpr with Kgp for Dg=5 and with variation of Dr and L/d: (a) Dr=0.2 and Dr=0.4; (b) Dr=0.6 and Dr=0.8.
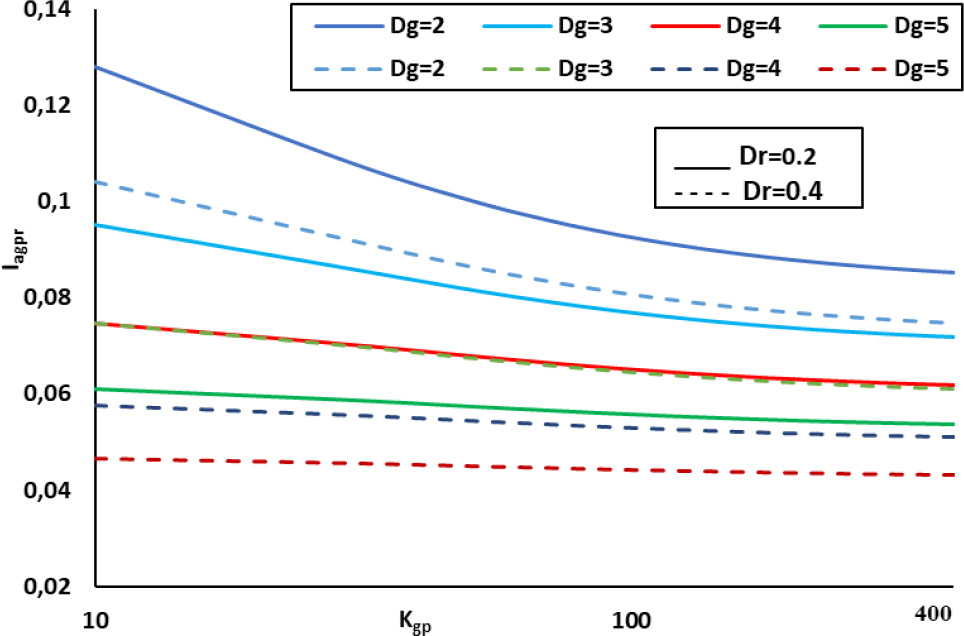
Figure 17:
Variation of Iagpr with Kgp, effect of Dr and Dg for L/d=10.
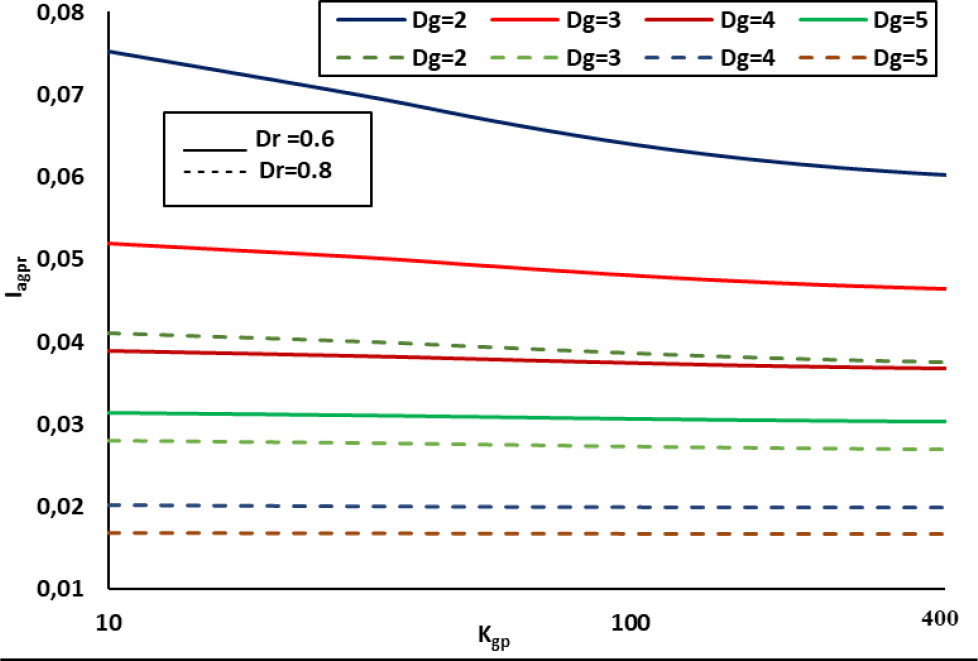
Figure 18:
Variation of Iagpr with Kgp, effect of Dr and Dg.
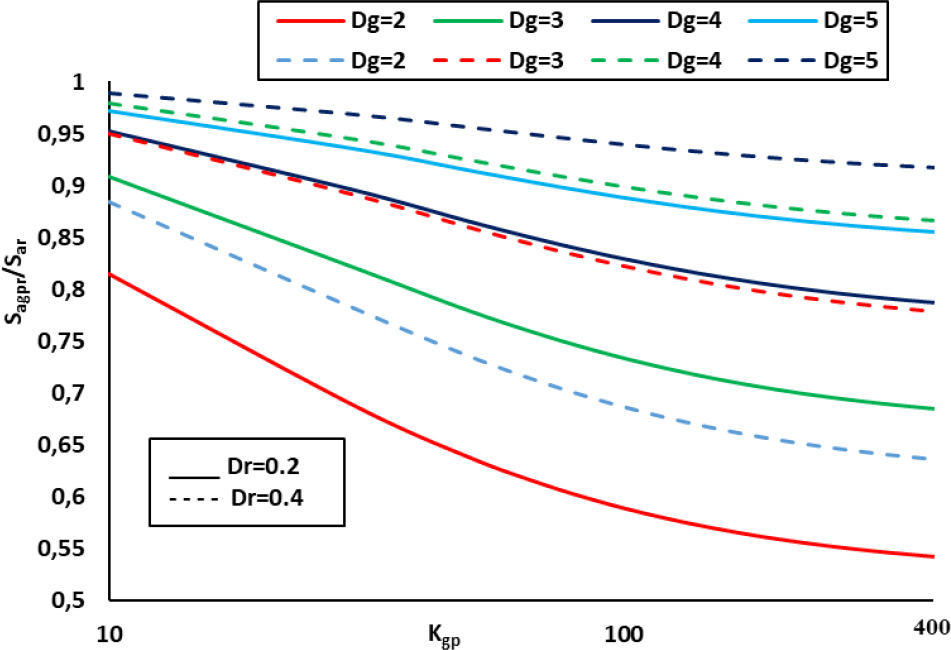
Figure 19:
Variation of the ratio of settlement of annular granular piled raft to the settlement of annular raft, Sr with Kgp – effect of Dg for L/d=10.
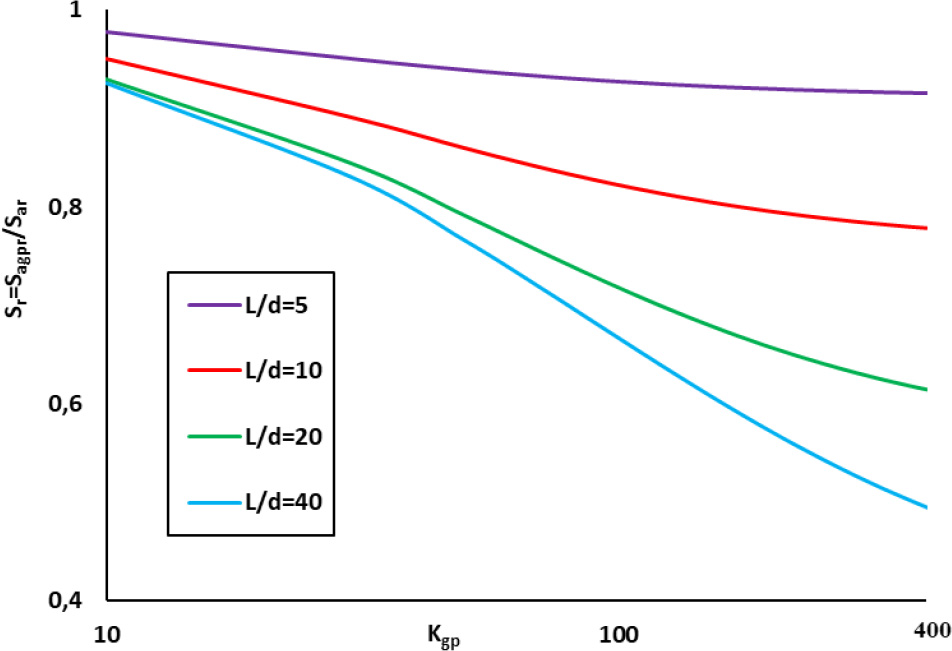
Figure 20:
Variation of the ratio of settlement of annular granular piled raft to the settlement of annular raft, Sr with Kgp – effect of L/d for Dr=0.4, Dg=3.
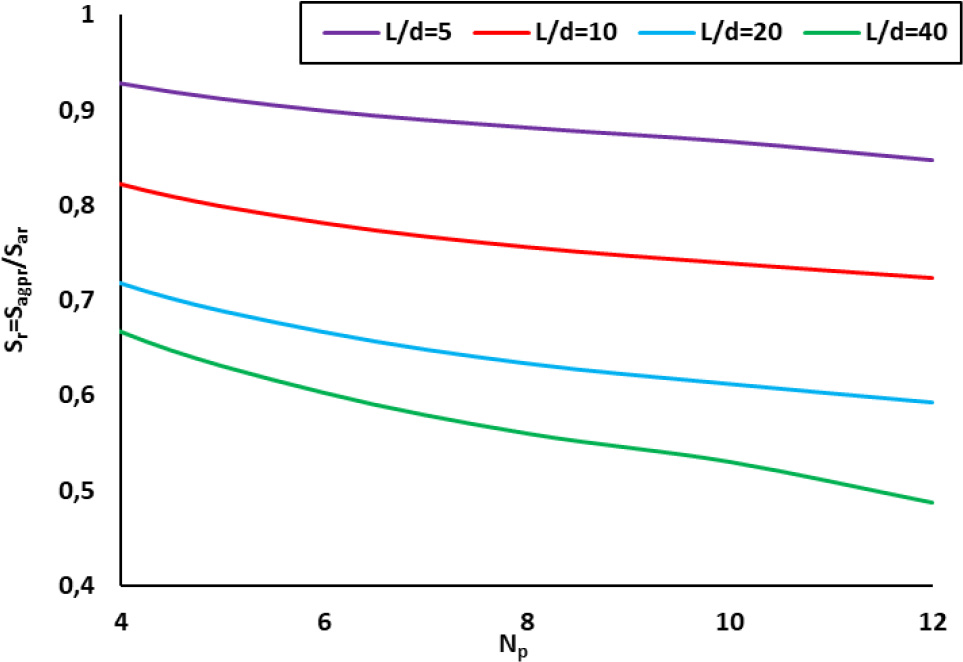
Figure 21:
Variation of the ratio of settlement of the annular granular piled raft to the settlement of annular raft, Sr with Np – effect of L/d for Dr=0.4, Dg=3, Kgp=100.
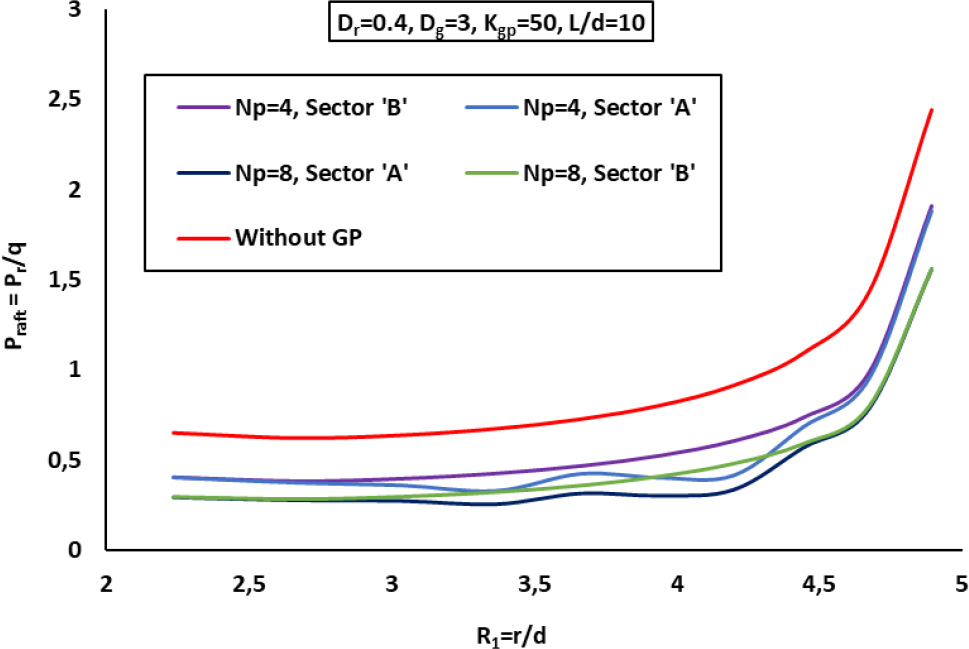
Figure 22:
Variation of normalized contact pressure distribution at raft–soil interface, Praft with normalized radial distance (R1) – effect of Np.
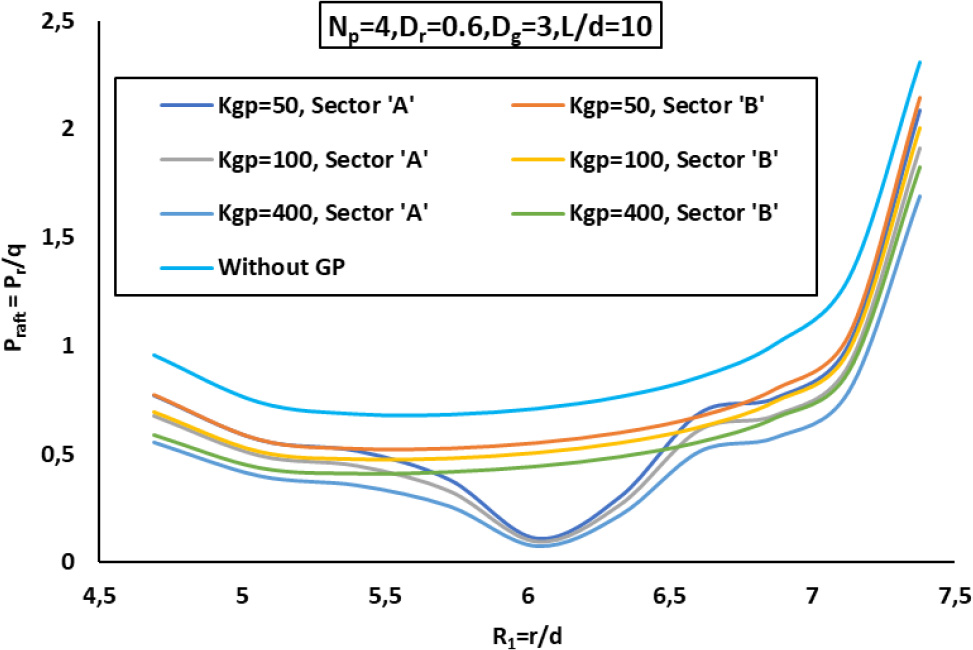
Figure 23:
Variation of normalized contact pressure distribution at raft–soil interface, Praft, with normalized radial distance (R1) – effect of Kgp.
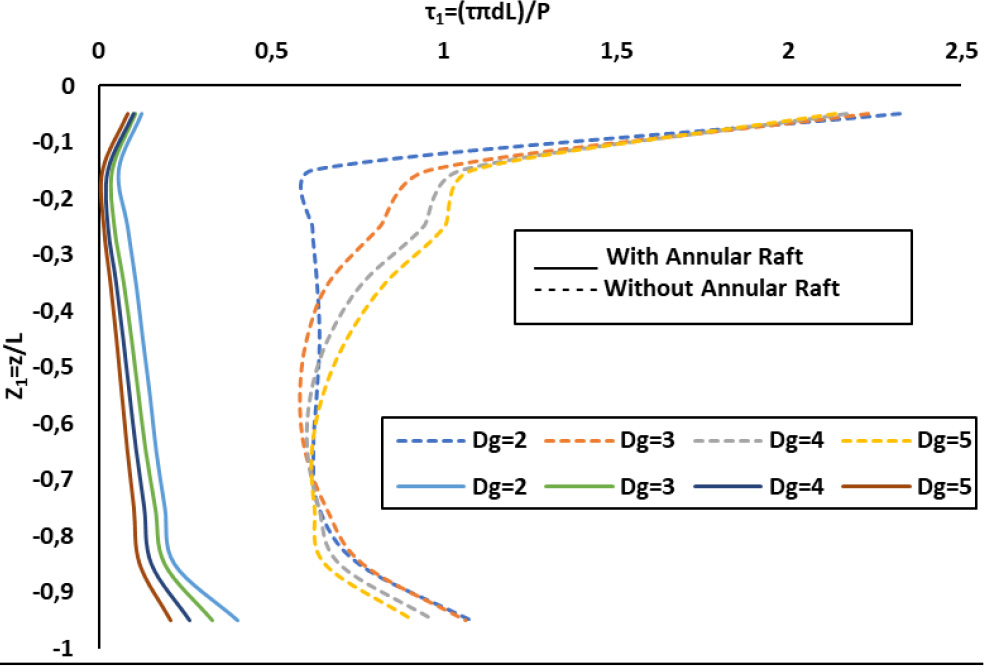
Figure 24:
Comparison of normalized shear stress variation with the normalized depth for a group of four GPs with and without annular raft for Dr=0.2, L/d=10, and Kgp=100.
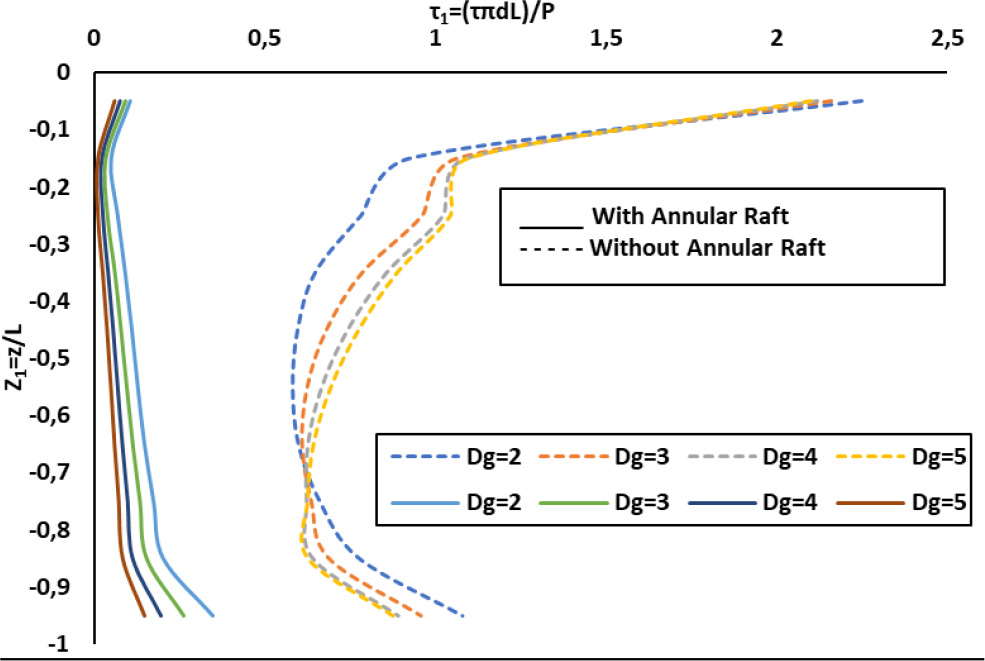
Figure 25:
Comparison of normalized shear stress variation with the normalized depth for a group of four GPs with and without annular raft for Dr=0.4, L/d=10, and Kgp=100.
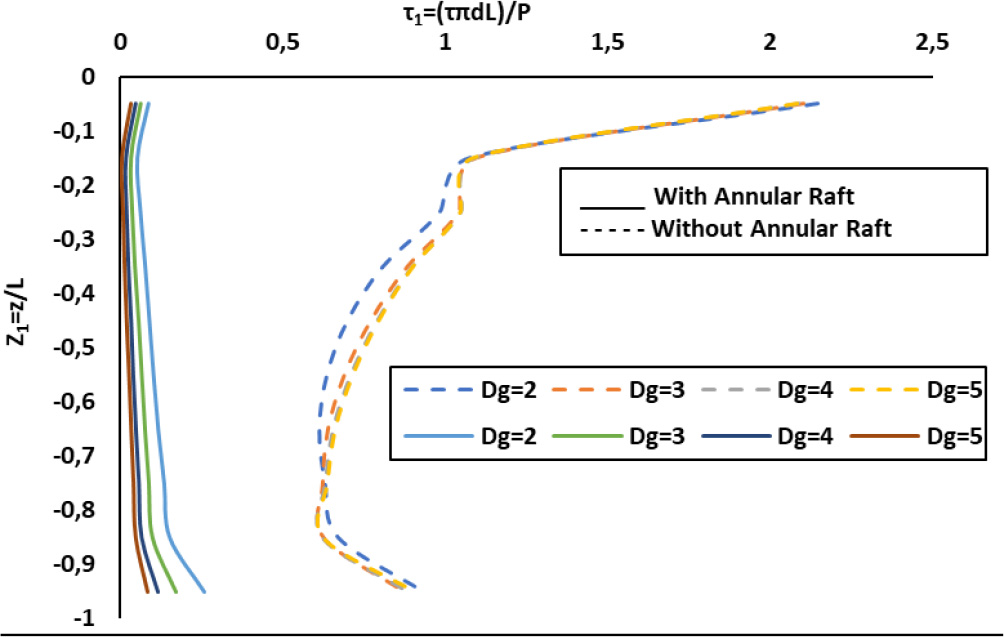
Figure 26:
Comparison of normalized shear stress variation with the normalized depth for a group of four GPs with and without the annular raft for Dr=0.6, L/d=10, and Kgp=100.
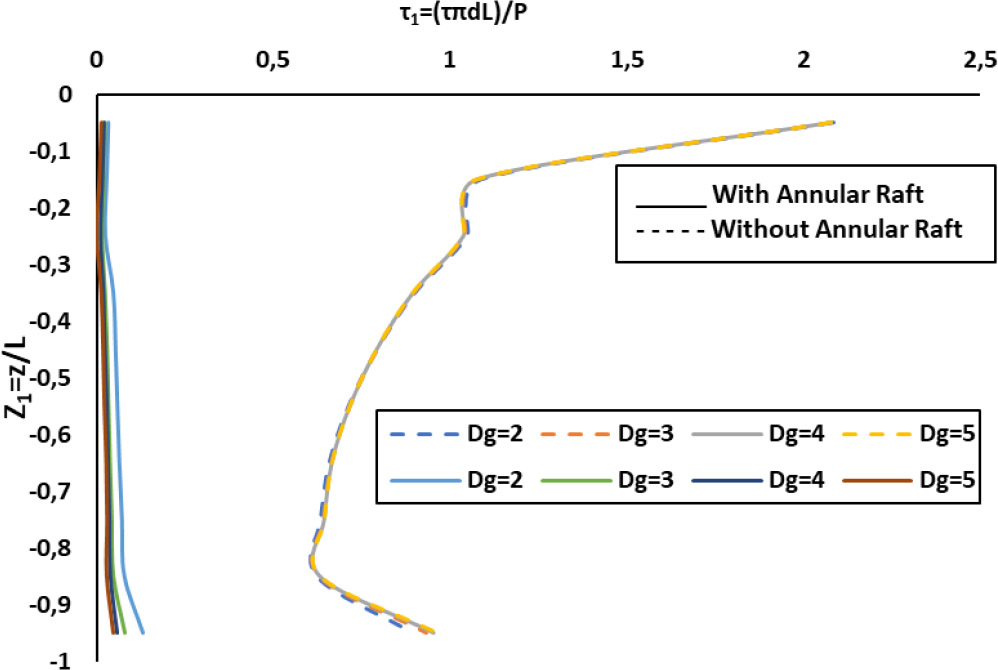
Figure 27:
Comparison of normalized shear stress variation with the normalized depth for a group of four GPs with and without the annular raft for Dr=0.8, L/d=10, and Kgp=100.
Table 3:
Shear stresses and its reduction due to the presence of an annular raft.
| Dr | Dg | Shear stresses of GPs without annular raft | Shear stresses of GPs with annular raft | Shear stresses reduction due to annular raft (%) | |||
|---|---|---|---|---|---|---|---|
| Top | Bottom | Top | Bottom | Top | Bottom | ||
| 0.2 | 2 | 2.324458 | 1.079298 | 0.123507 | 0.403755 | 94.70 | 62.65 |
| 3 | 2.232964 | 1.064219 | 0.107169 | 0.328567 | 95.20 | 69.17 | |
| 4 | 2.169796 | 0.974238 | 0.100482 | 0.263145 | 95.38 | 72.99 | |
| 5 | 2.134603 | 0.913877 | 0.084327 | 0.208937 | 96.06 | 77.21 | |
| 0.4 | 2 | 2.248837 | 1.079708 | 0.106494 | 0.349187 | 95.28 | 67.66 |
| 3 | 2.160045 | 0.957485 | 0.089982 | 0.261161 | 95.83 | 72.72 | |
| 4 | 2.120533 | 0.892764 | 0.074019 | 0.194048 | 96.51 | 78.26 | |
| 5 | 2.101452 | 0.876311 | 0.058483 | 0.145743 | 97.22 | 83.37 | |
| 0.6 | 2 | 2.147183 | 0.935131 | 0.087404 | 0.259689 | 95.93 | 72.23 |
| 3 | 2.103237 | 0.876795 | 0.063182 | 0.171468 | 97.00 | 80.44 | |
| 4 | 2.08833 | 0.886777 | 0.047783 | 0.11668 | 97.71 | 86.84 | |
| 5 | 2.082598 | 0.907918 | 0.03232 | 0.08452 | 98.45 | 90.69 | |
| 0.8 | 2 | 2.085437 | 0.895009 | 0.033402 | 0.132094 | 98.40 | 85.24 |
| 3 | 2.079723 | 0.934551 | 0.024073 | 0.080976 | 98.84 | 91.34 | |
| 4 | 2.079205 | 0.954441 | 0.020154 | 0.060053 | 99.03 | 93.71 | |
| 5 | 2.079428 | 0.963823 | 0.014868 | 0.047917 | 99.28 | 95.03 | |
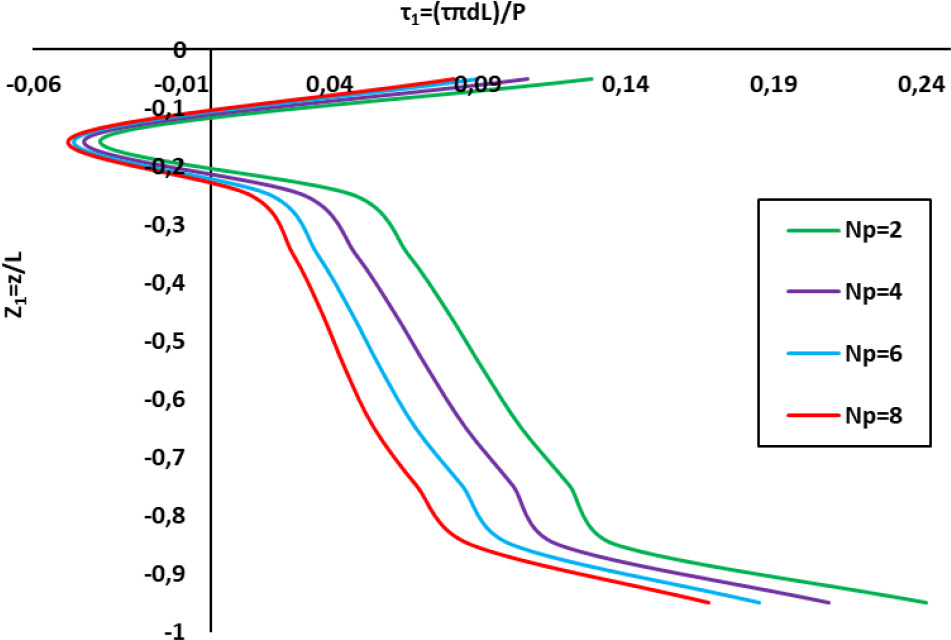
Figure 28:
Variation of τ1 with Z1 – effect of number of GPs for Dr=0.4, Dg=3, L/d=10, and Kgp=50.
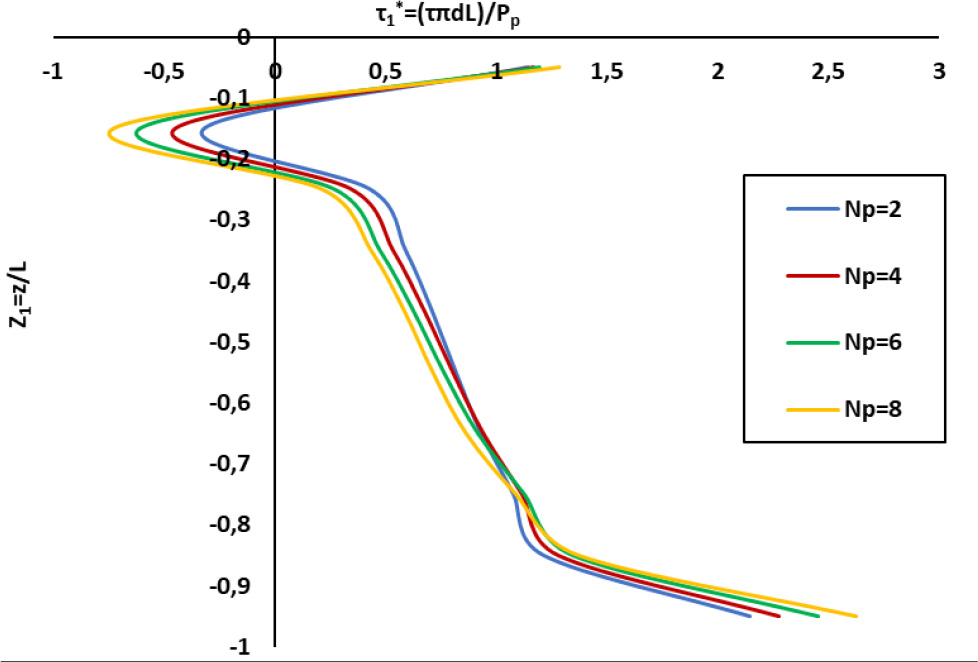
Figure 29:
Variation of τ1*τ1* with Z1 – effect of number of GPs for Dr=0.4, Dg=3, L/d=10, Kgp=50.
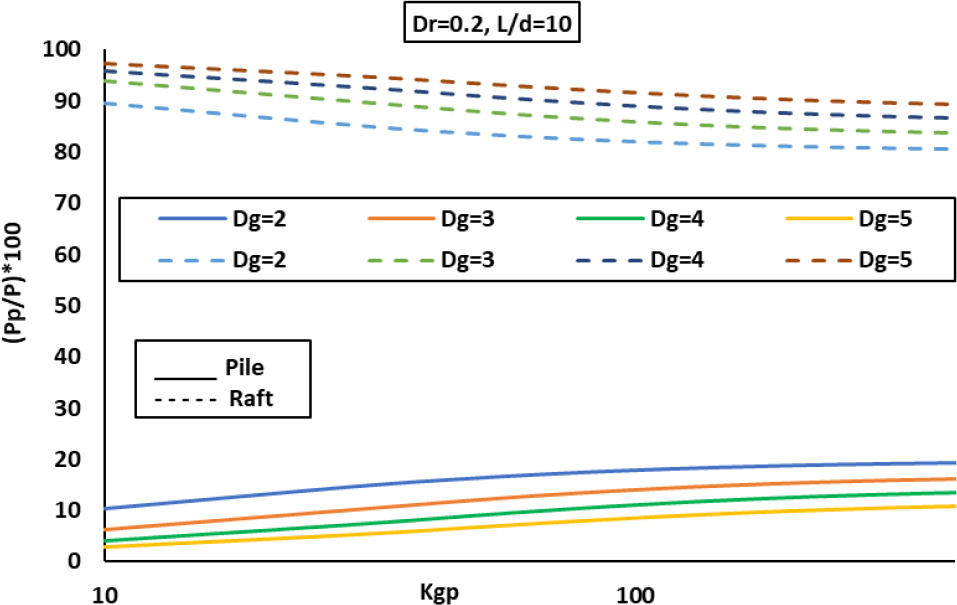
Figure 30:
Variation of percentage load shared by GP (Pgp) and Raft with Kgp – effect of annular width, Dg.
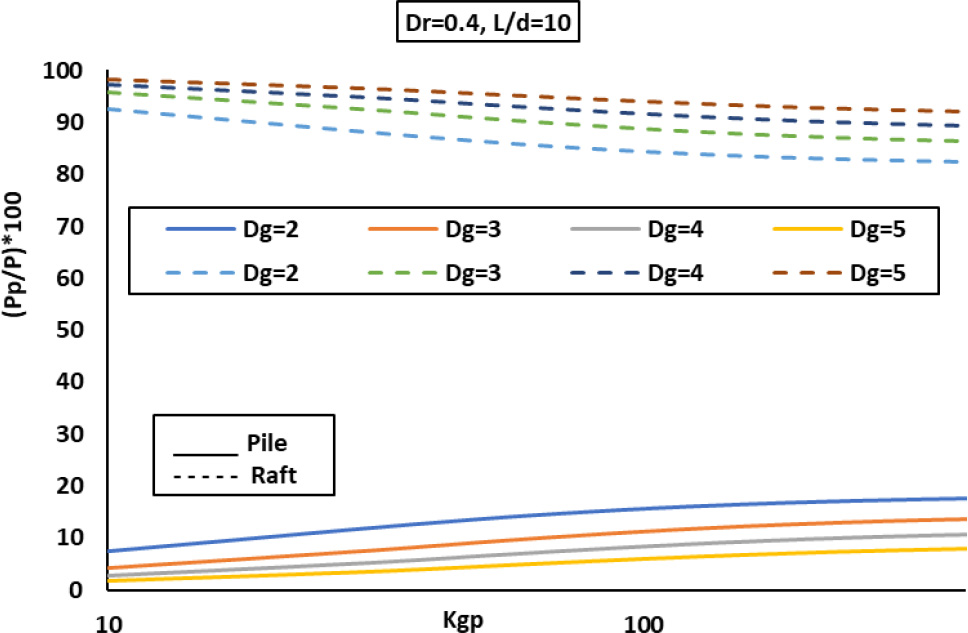
Figure 31:
Variation of percentage load shared by GP (Pgp) and raft with Kgp – effect of the annular width, Dg.
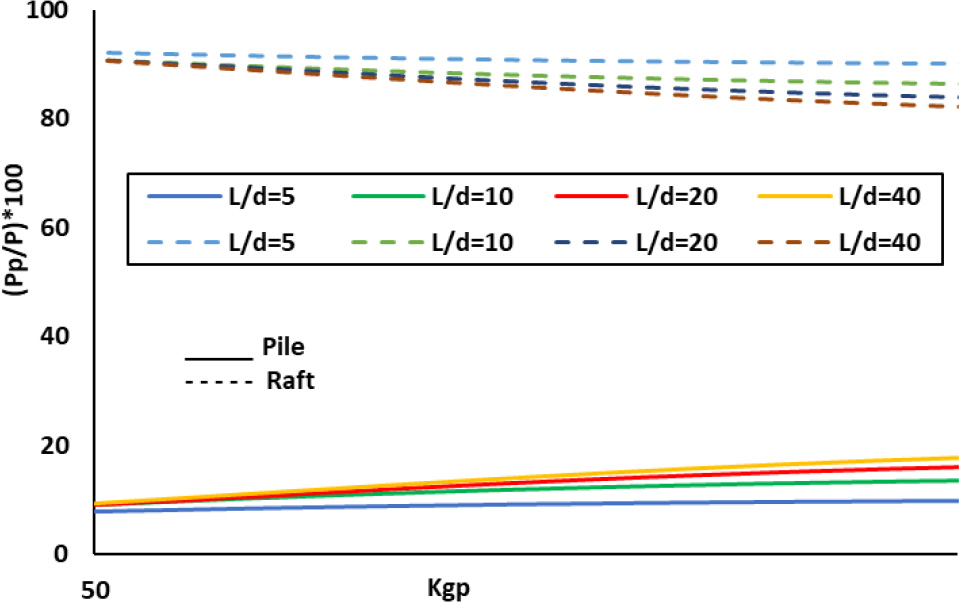
Figure 32:
Variation of percentage load shared by GP (Pgp) and raft with Kgp – effect of L/d.