
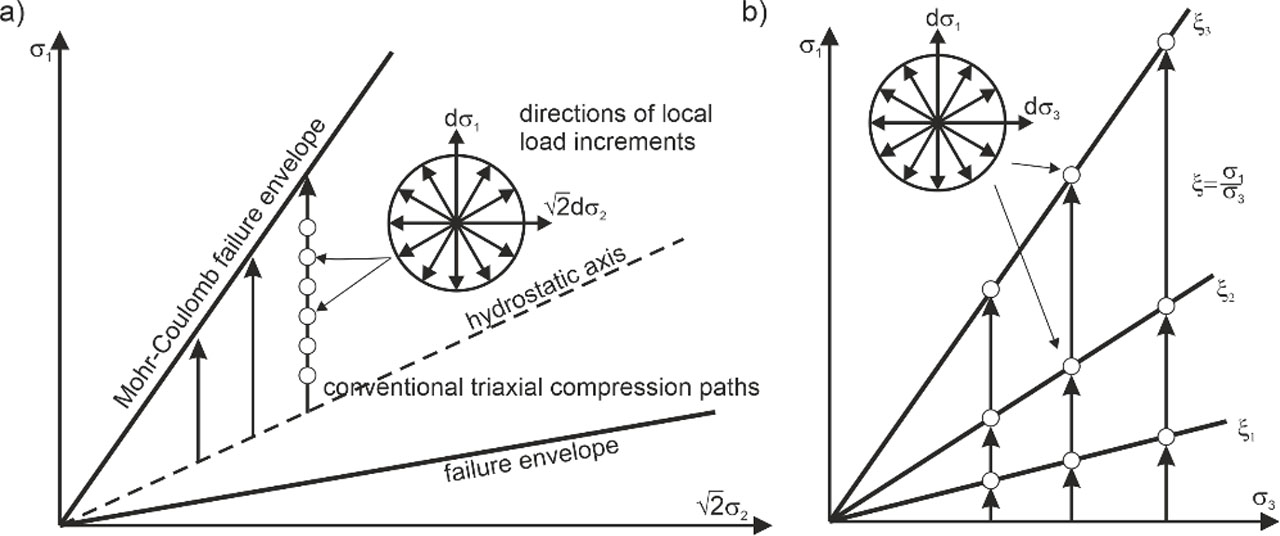
Figure 1:
Procedure of determination of the boundary of instability domain: a) triaxial compression in Rendulic plane, b) plane strain conditions.
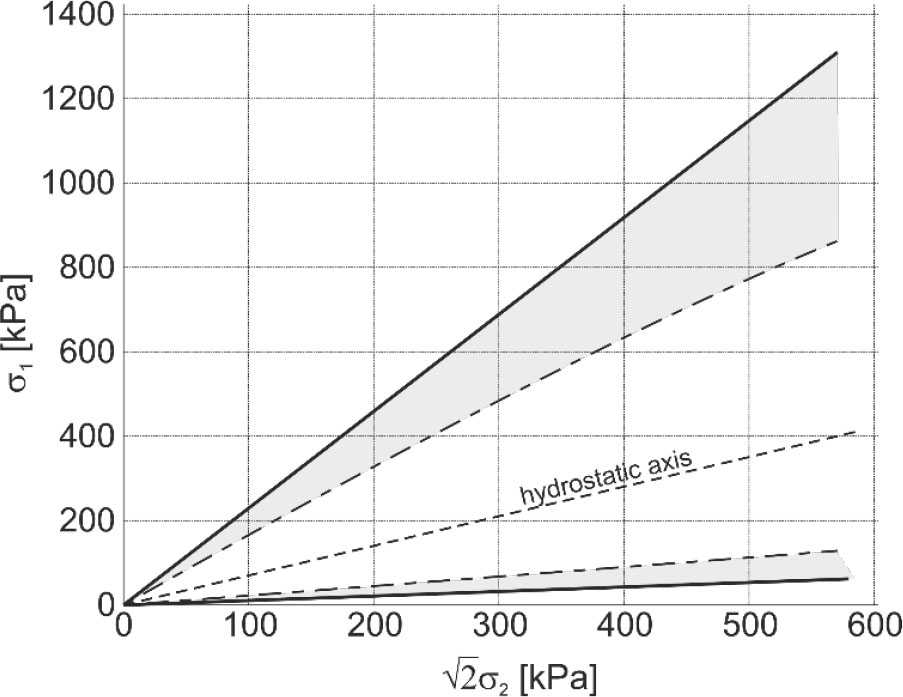
Figure 2:
Instability domains (shaded areas) in simulations of triaxial compression and extension for dense sand described by incrementally non-linear model [7].
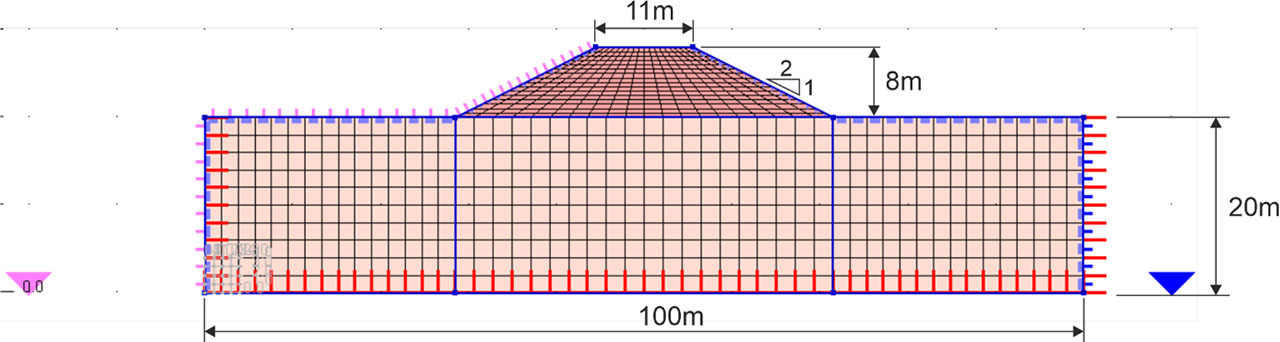
Figure 3:
Geometrical model of the earth dam and subgrade.
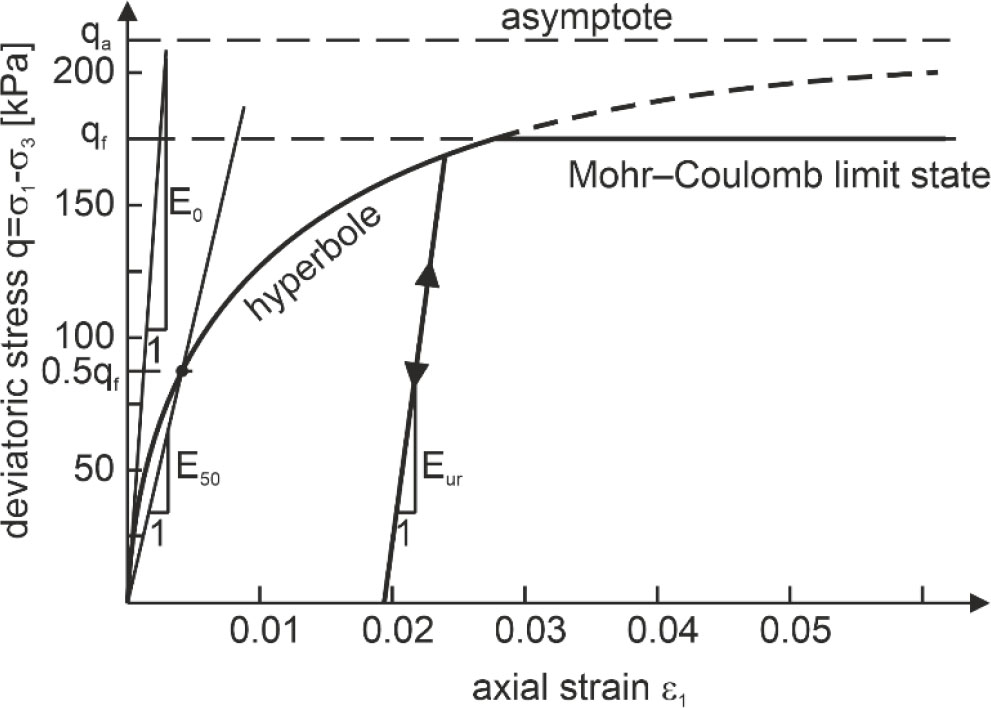
Figure 4:
Hyperbolic relationship ɛ1-q for virgin triaxial compression.
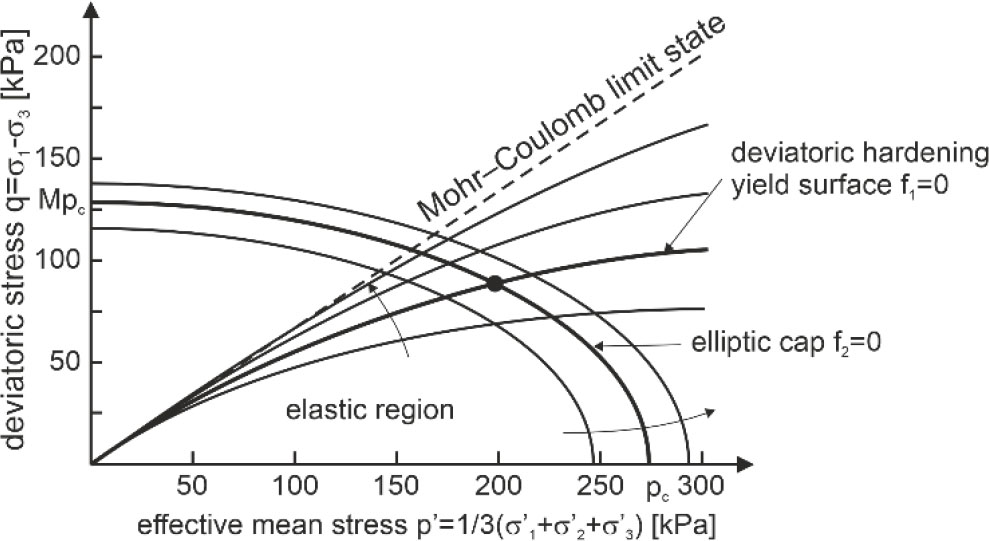
Figure 5:
Yield surface for Hardening Soil model.
Table 1:
Soil parameters assumed in the analysis.
| Parameter | earth dam (mSa) | subgrade (Si) |
|---|---|---|
| Eurref [MPa] | 100 | 30 |
| σref [kPa] | 100 | 100 |
| νur [−] | 0.2 | 0.3 |
| m [−] | 0.5 | 0.9 |
| σL [kPa] | 10 | 10 |
| E50ref [MPa] | 30 | 10 |
| ϕ [°] | 35 | 25 |
| c [kPa] | 0 | 10 |
| ψ [°] | 5 | 10 |
| Eoed [MPa] | 38 | 10 |
| OCR [−] | 3 | 3 |
| k [m/s] | 10−6 | 10−7 |
| Sr [−] | 0 | 0.2 |
| α [1/m] | 10 | 1 |
| K0 [−] | 0.8 | 0.92 |
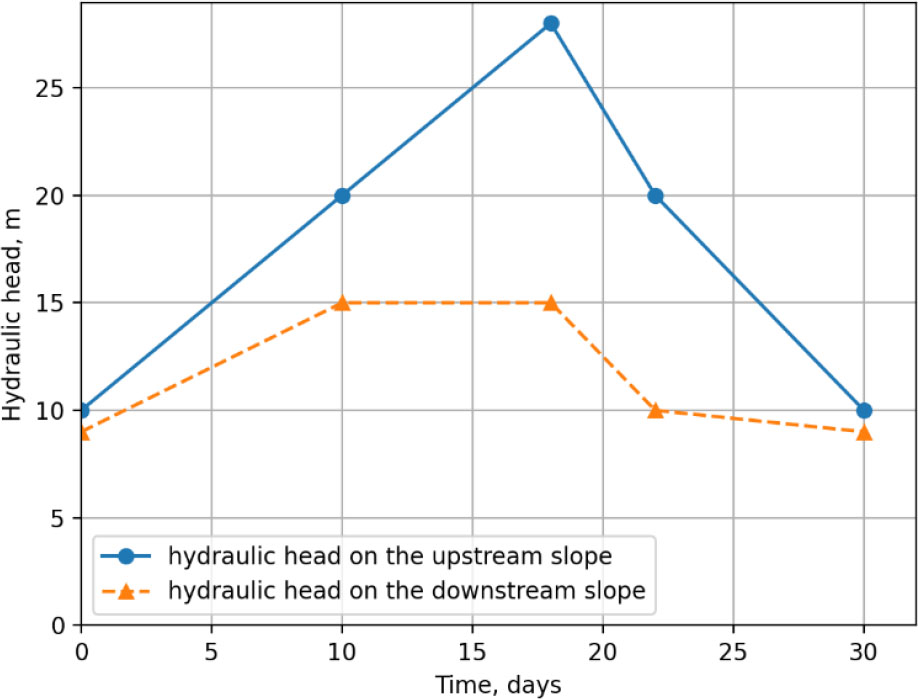
Figure 6:
Variations of hydraulic boundary conditions over time.
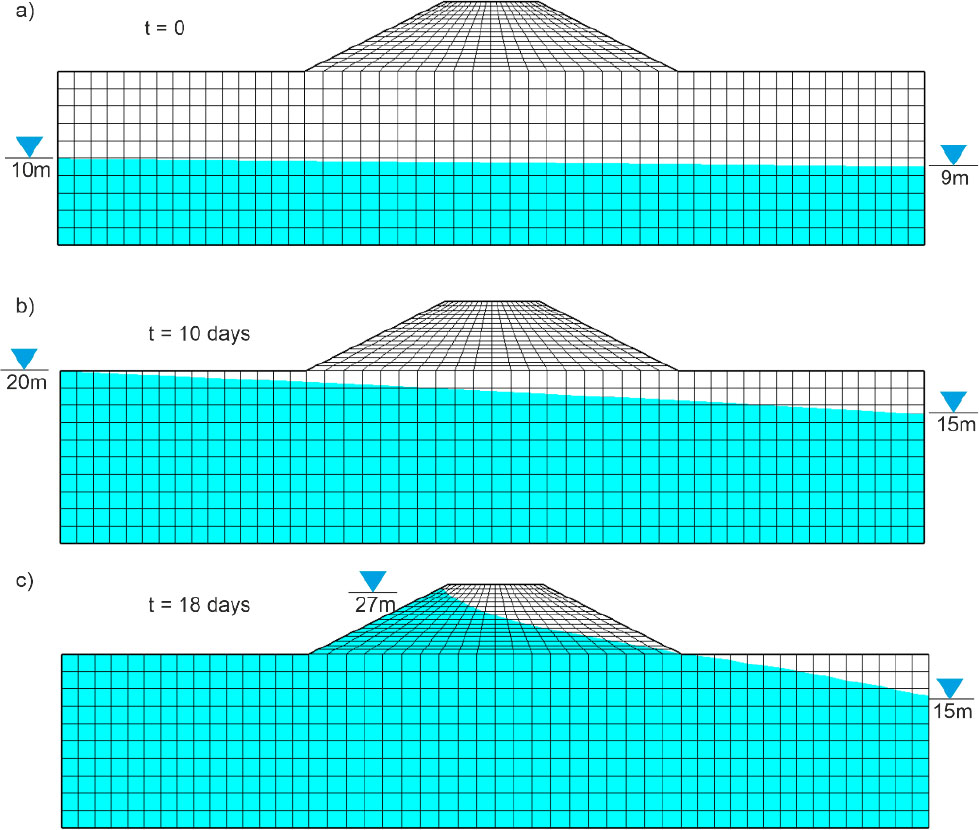
Figure 7:
Variations of the phreatic surface location over time.
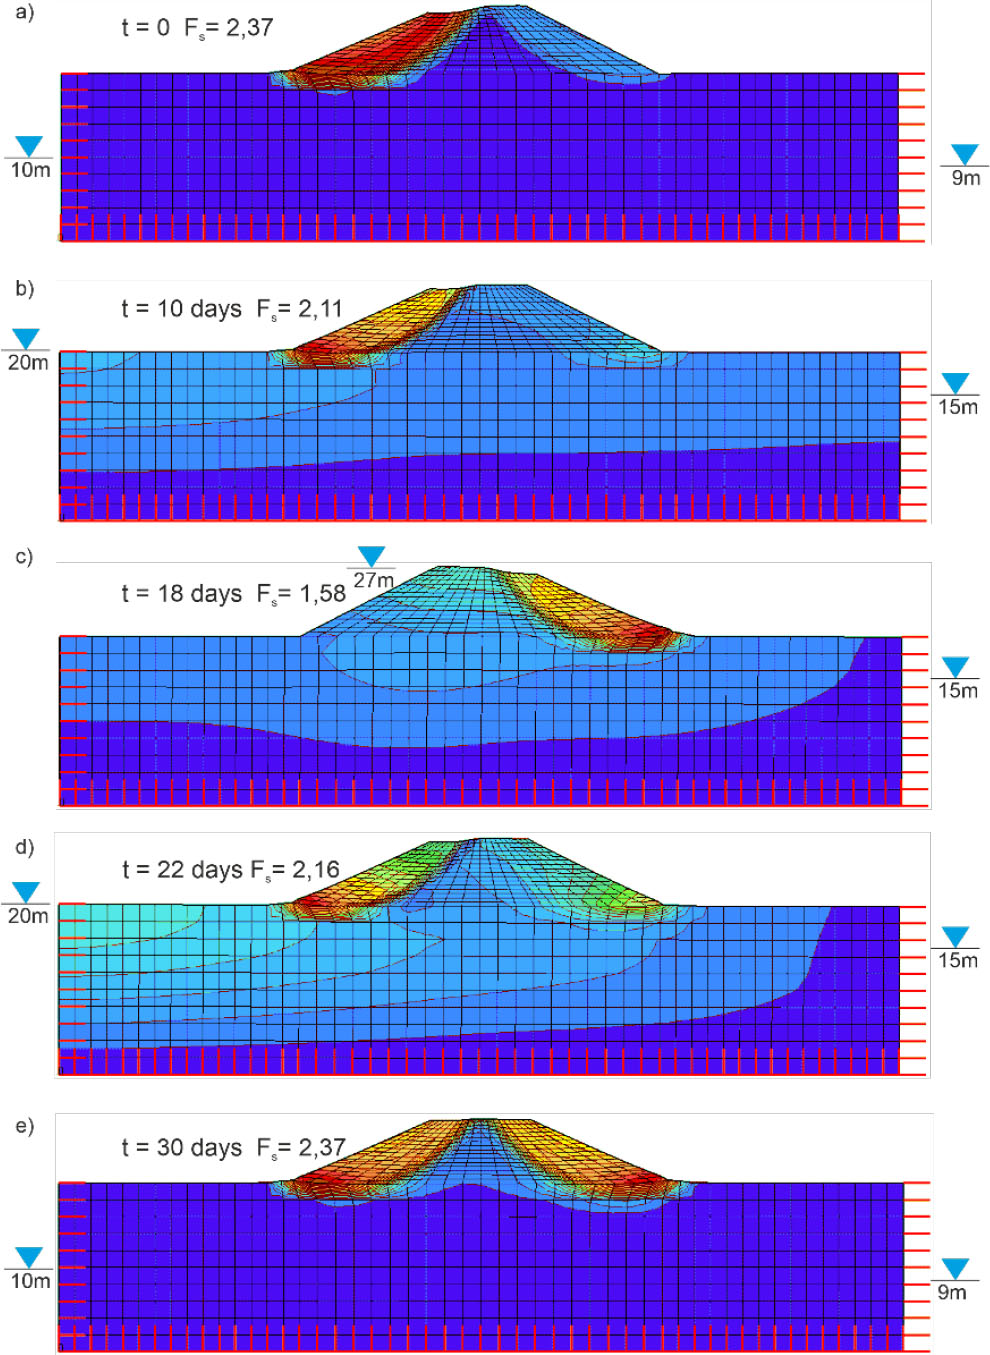
Figure 8:
Changes of safety factor at different locations of the phreatic surface.
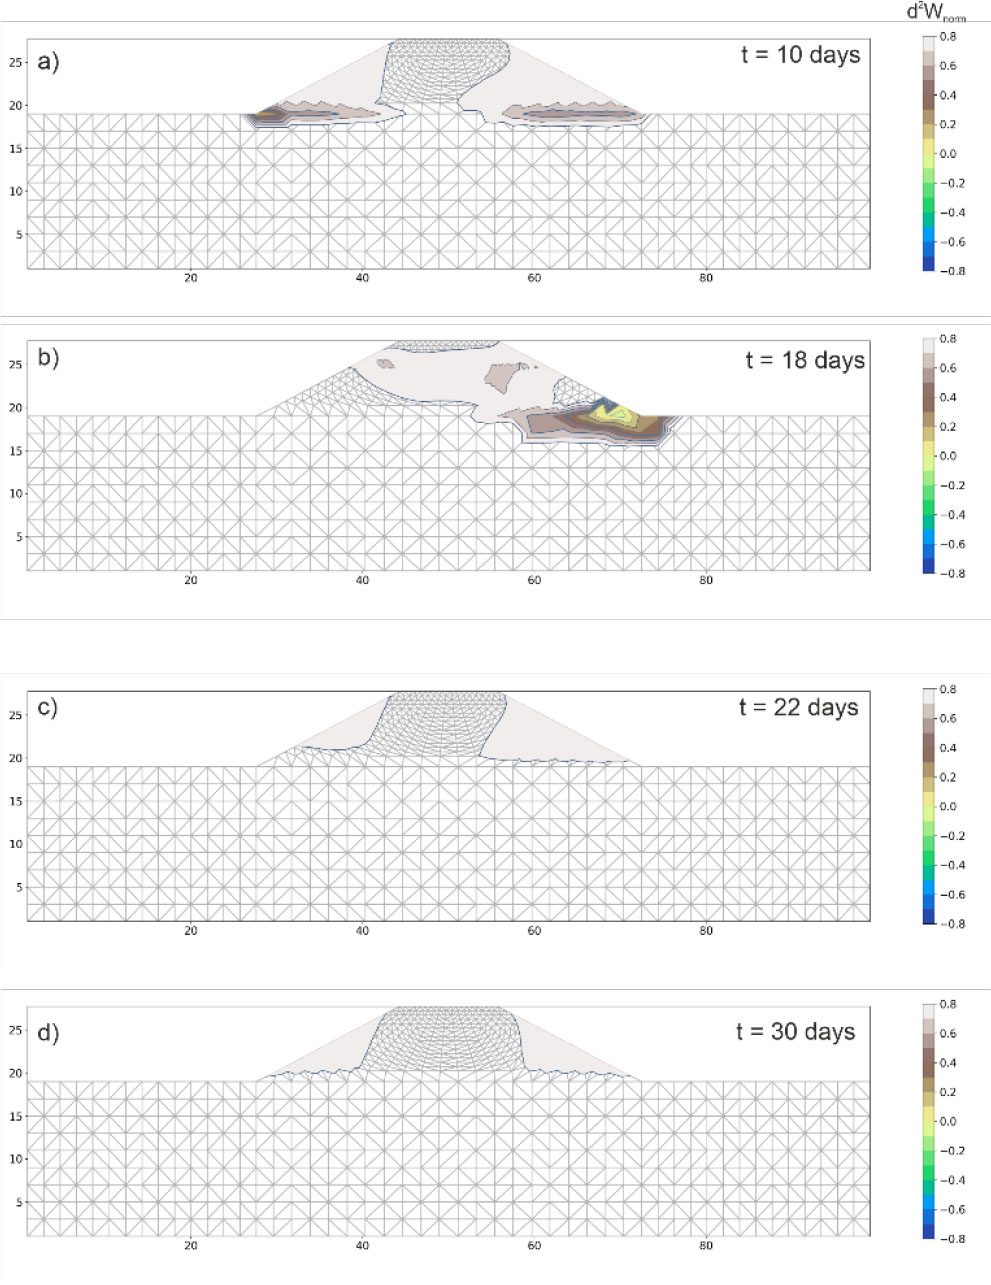
Figure 9:
Maps of the normalised second-order work at different levels of the phreatic surface.