
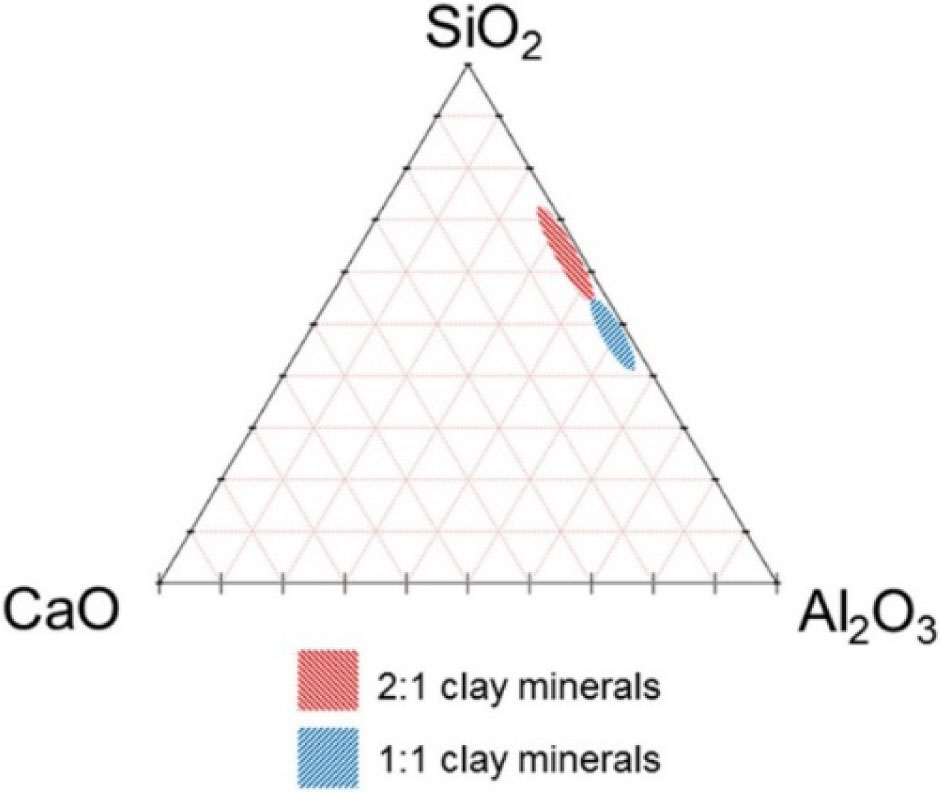
Figure 1
Compositional diagram showing the approximate composition range of clay minerals.
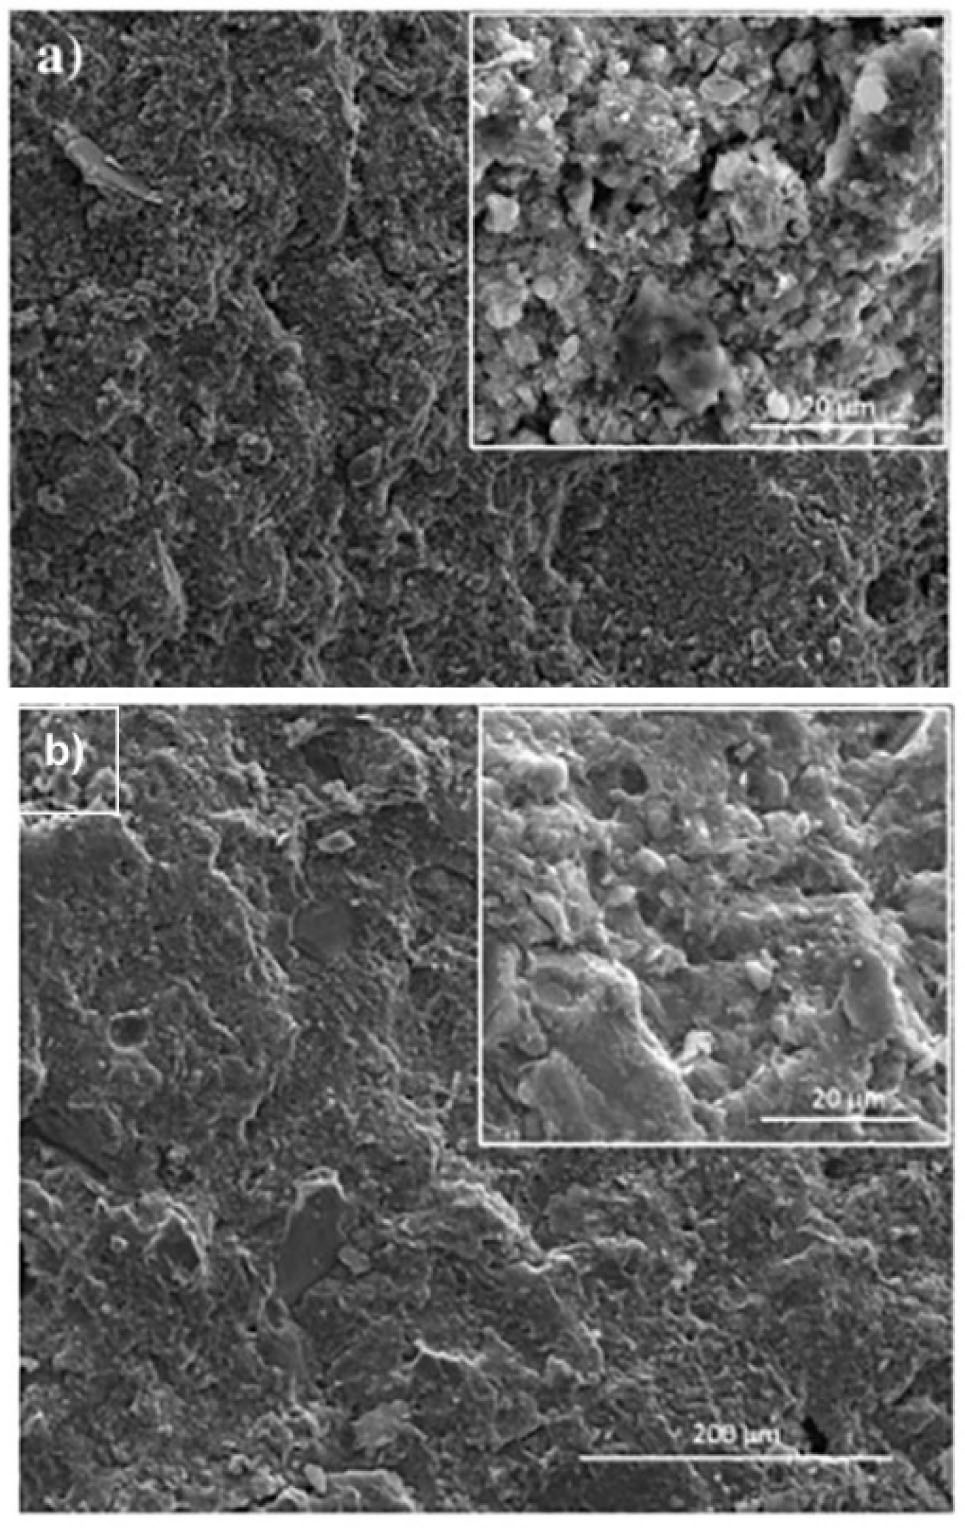
Figure 2
Micrographs of alkali-activated clay sediments showing that activation with NaOH (a) resulted in a more porous, less dense microstructure than activation with (b) Na-silicate solution (Ferone, et al., 2015).
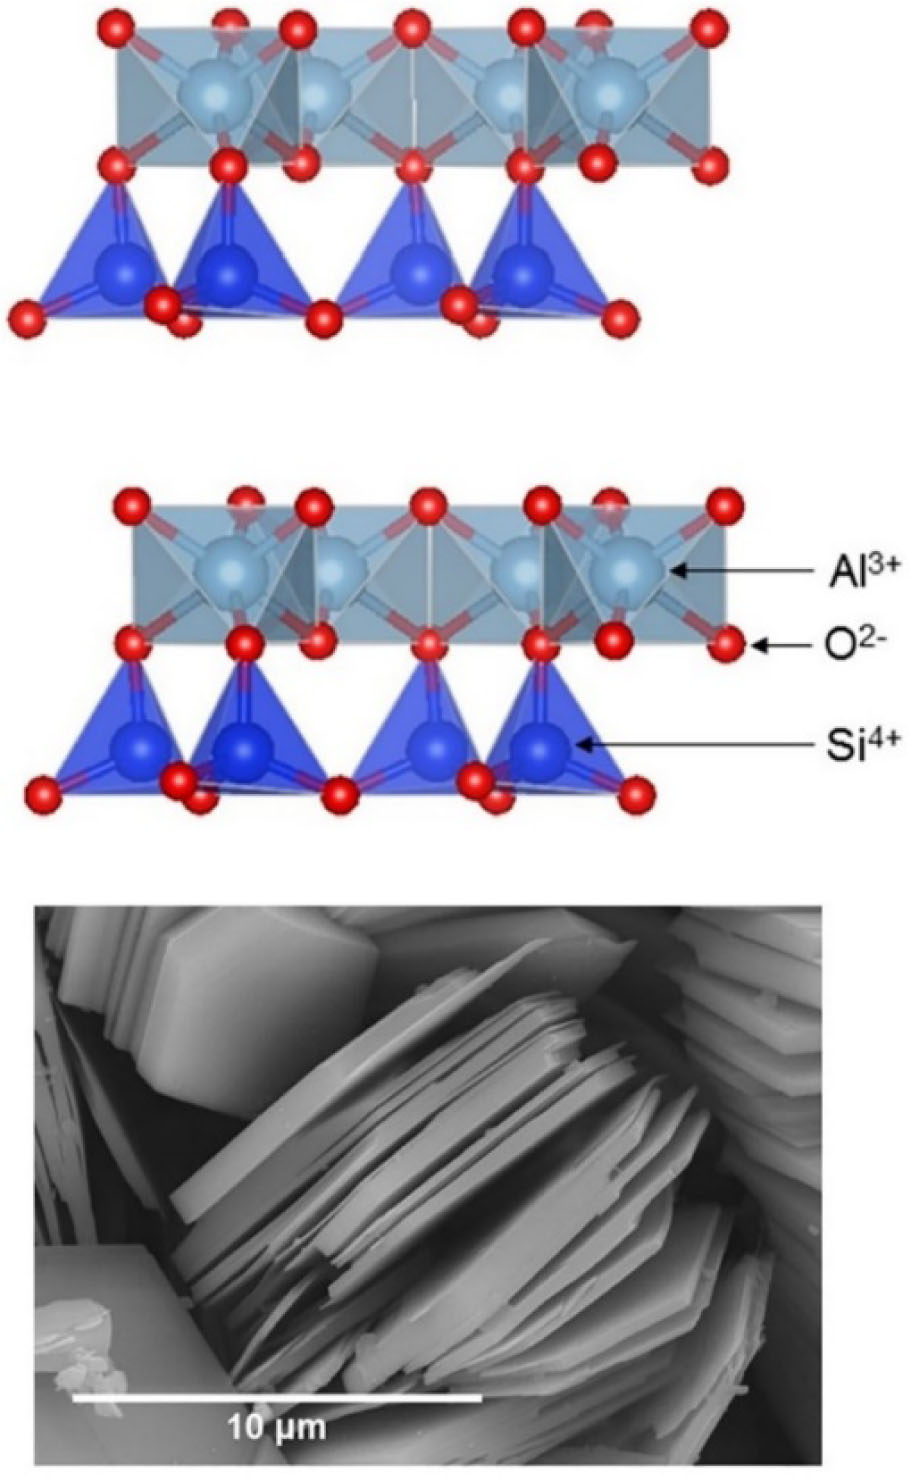
Figure 3
Atomic diagram of kaolinite (two layers), Image generated in VESTA (Larsen et al., 2017), using structural parameters from Bish (Bish, 1993).
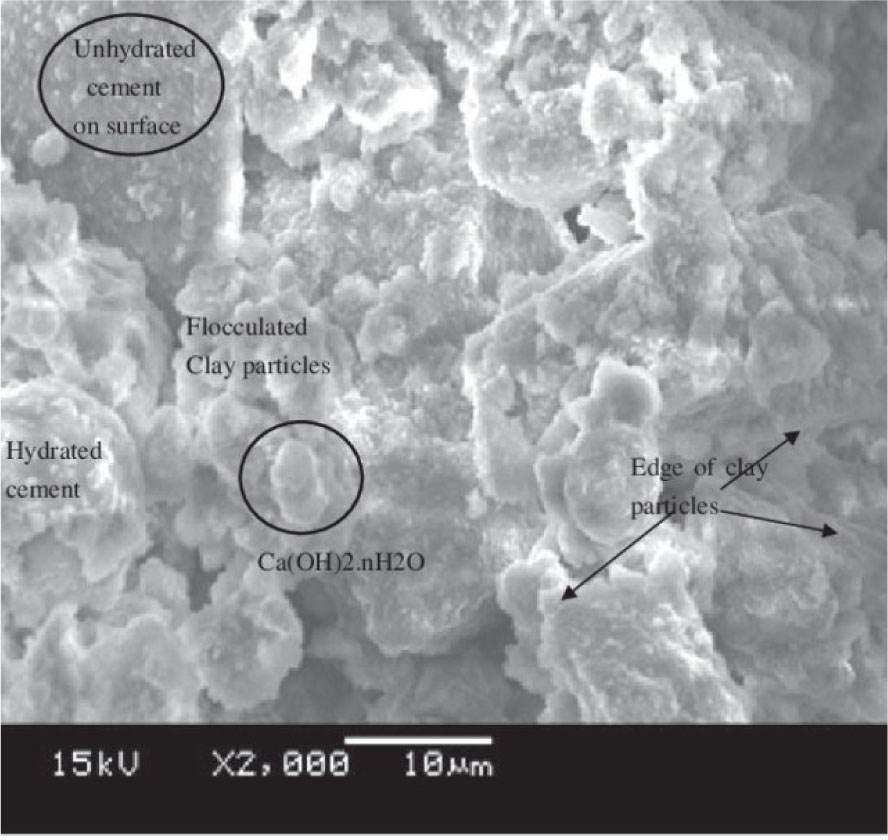
Figure 4
SEM image of cement-treated clay immediately after compaction (Zhao et al., 2016).
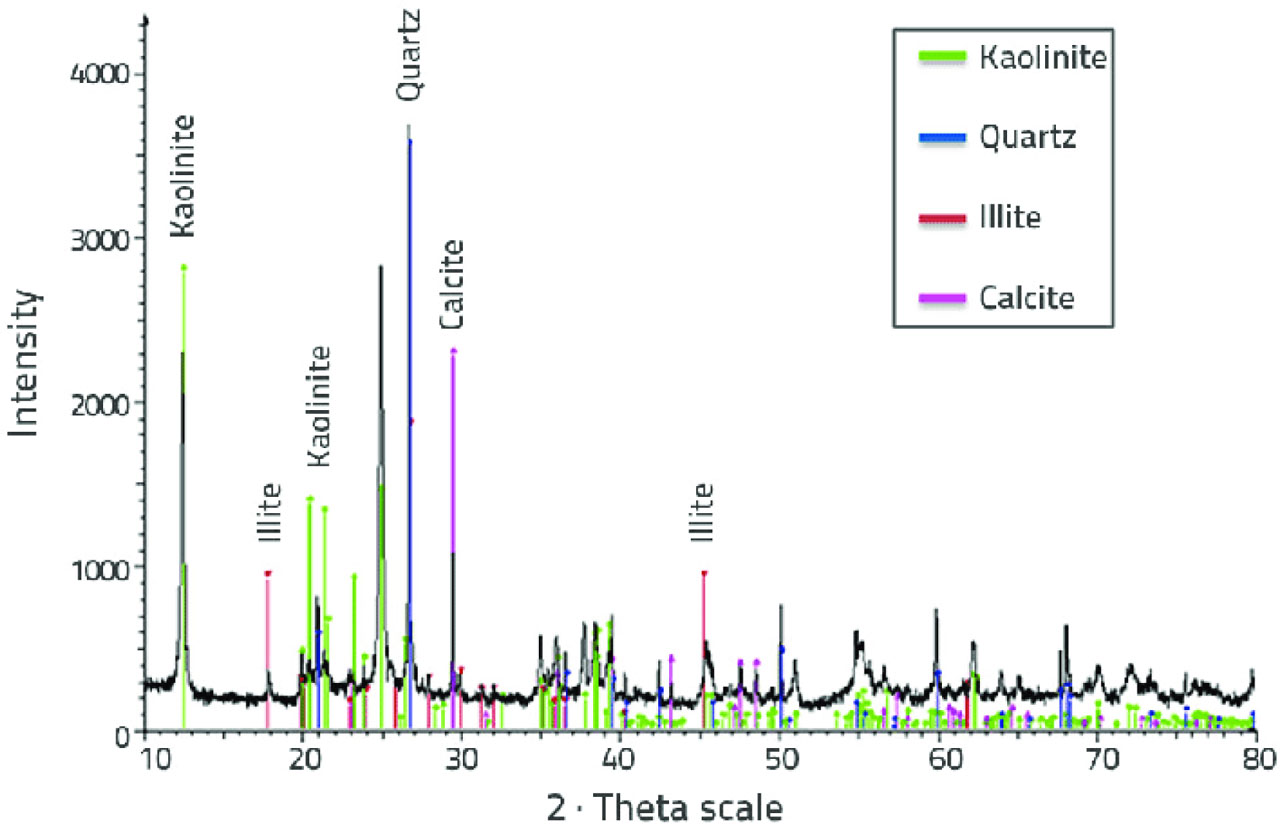
Figure 5
X-ray diffraction of clay sample. (Quartz, Illite, Kaolinite, and Calcite).
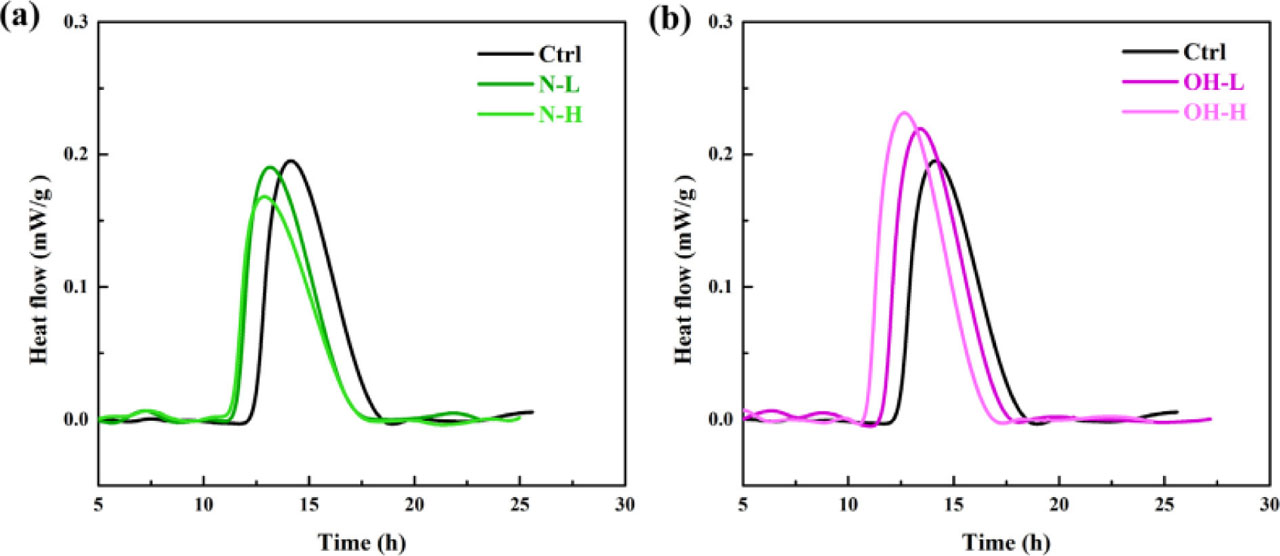
Figure 6
The determined heat flow curves of sulfate depletion peak in (a) N and (b) OH group (Chen et al., 2018).
Table 1
Physical properties of the clay used in the study.
| pH | Gs | Dry density | Natural moisture content | Soil classification (USCS) | Atterberg limits | ||
|---|---|---|---|---|---|---|---|
| PI | PL | LL | |||||
| 7.59 | 2.7 | 14.9 kN/m3 | 20.9% | CL | 19.7% | 23.8% | 43.5% |
Table 2
Swelling rate and swelling pressure.
| Soil type | Swelling pressure | Swelling rate | Swelling potential |
|---|---|---|---|
| CL | 16.15 kPa | 4.37% | Medium |
| 12.45 kPa | 2.81% | Medium | |
| 8.65 kPa | 1.68% | Medium |
Table 3
Physical properties of cement.
| Properties | Compressive strength | Setting time | Autoclave expansion | Specific surface area | ||
|---|---|---|---|---|---|---|
| 28 days | 2 days | Final | Initial | |||
| ASTM C150 | more than 38.5 kPa | more than 7 kPa | less than 6 hours | more than 45 minutes | less than 0.8% | more than 2800 gr/cm2 |
Table 4
Chemical properties of cement.
| Properties | Loss on ignition | Remaining insoluble | C3A | MgO | Fe2O3 | AL2O3 | SiO2 |
|---|---|---|---|---|---|---|---|
| ASTM C150 | 3% | 0.75% | 8% | 5% | 6% | 6% | 20% |
Table 5
The used buffer specification.
| Environmental condition | Degree of acidity |
|---|---|
| Acid | 4 |
| Neutral | 7 |
| Alkaline | 10 |
Table 6
Specifications of water.
| Chemical compounds existing in water | Ppm |
|---|---|
| HCO3 | 329.4 |
| CL | 14.2 |
| SO4 | 9.6 |
| Ca | 92 |
| Mg | 14.4 |
| Na | 6.9 |
| K | 2.3 |
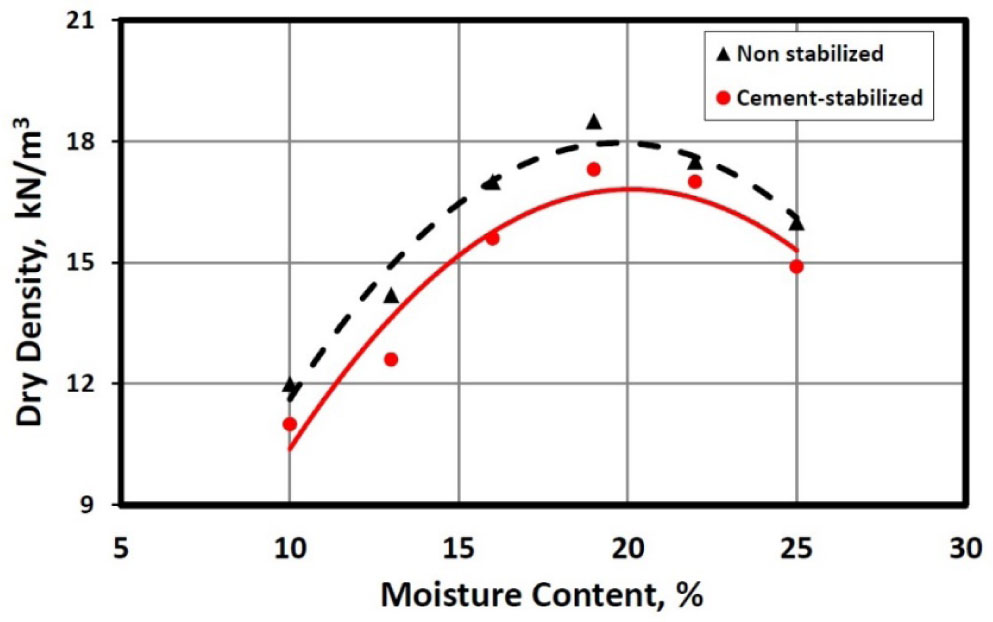
Figure 7
Density curve of cement-stabilized and unsterilized soil.
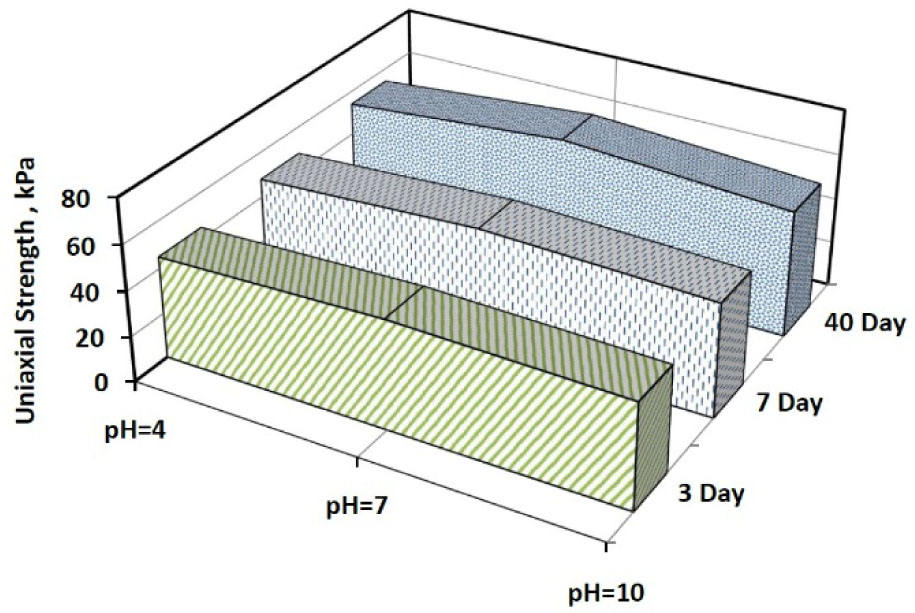
Figure 8
Unconfined compressive strength of nonstabilized samples in various environments in terms of acidity.
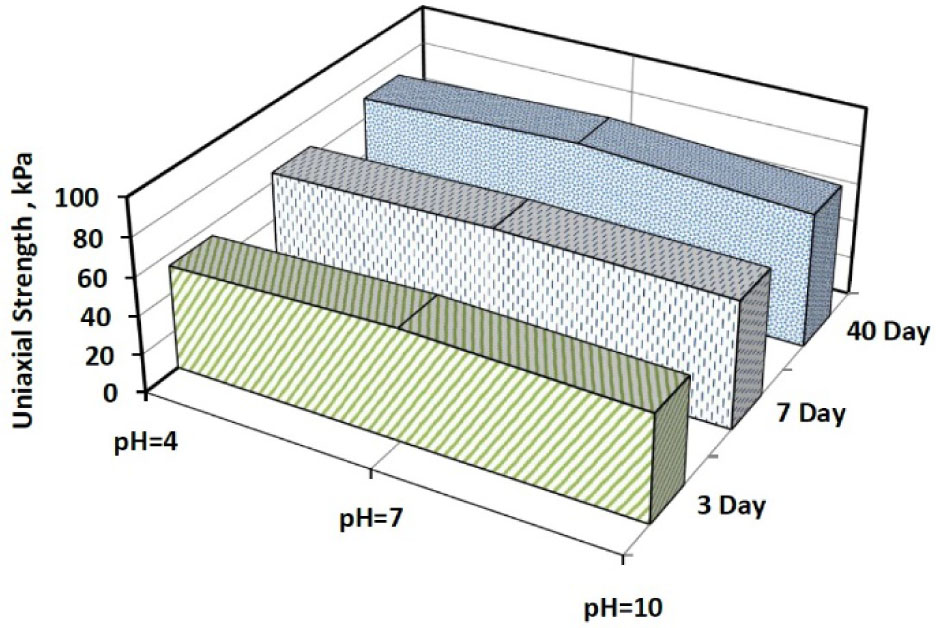
Figure 9
Unconfined compressive strength of samples stabilized by 5% cement in various environments in terms of acidity.
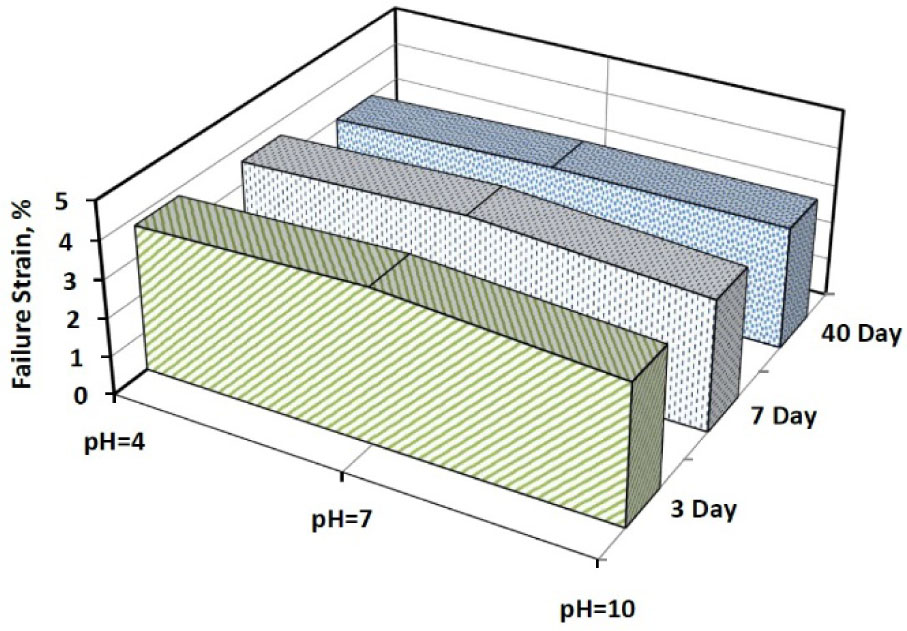
Figure 9
Failure strain of nonstabilized samples in various environments in terms of acidity.
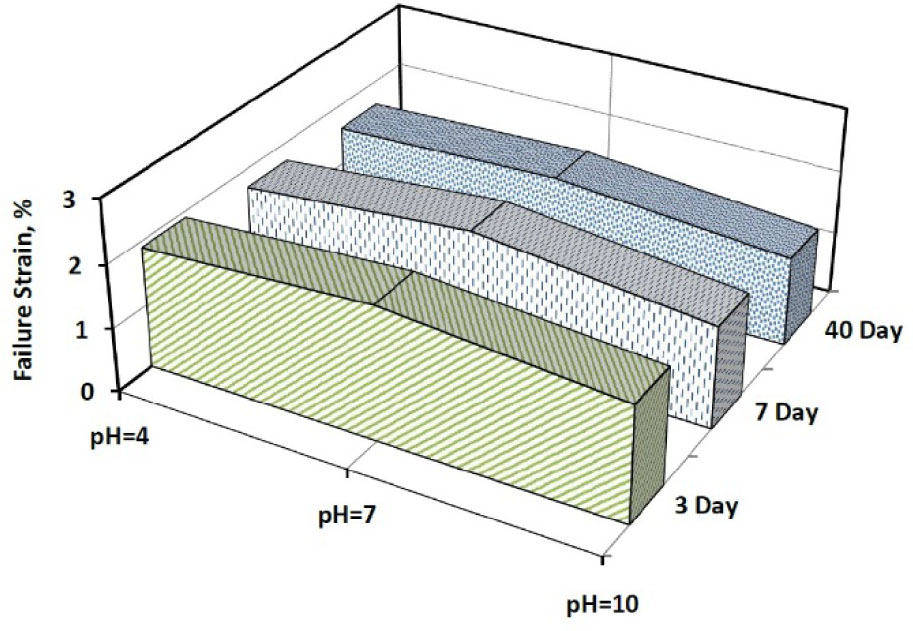
Figure 10
Failure strain of 5% cement-stabilized samples in various environments in terms of acidity.
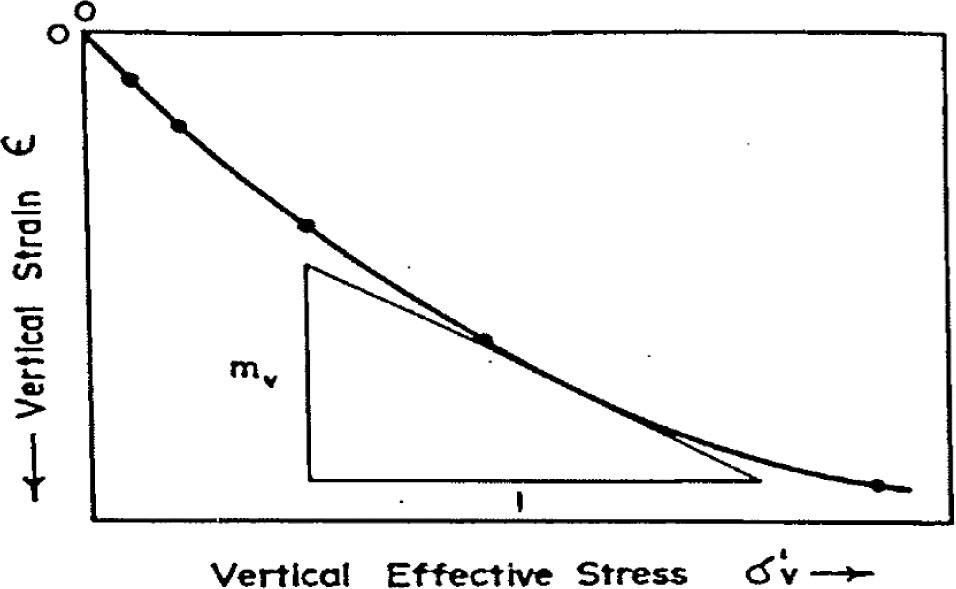
Figure 11
Stress–strain curve from an oedometer test.
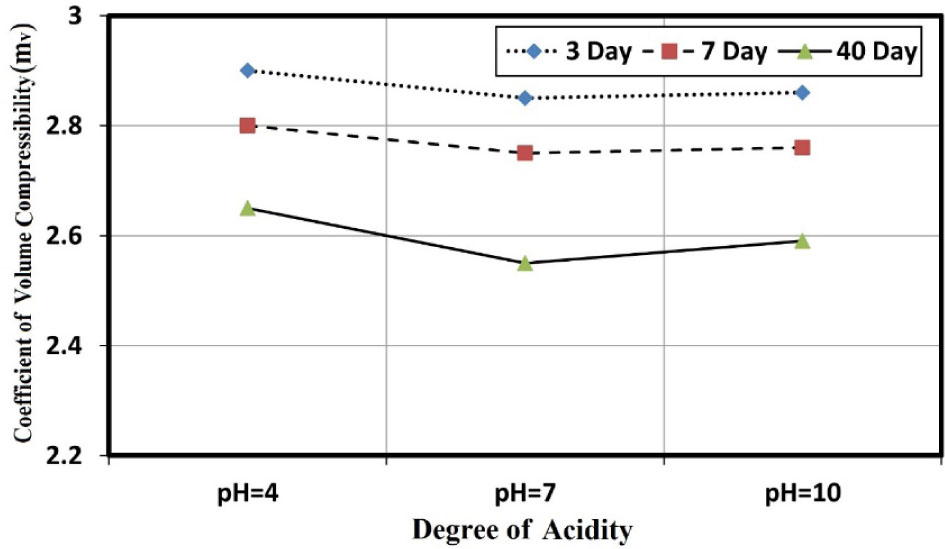
Figure 12
Volume change coefficient of nonstabilized samples in various environments in terms of acidity.
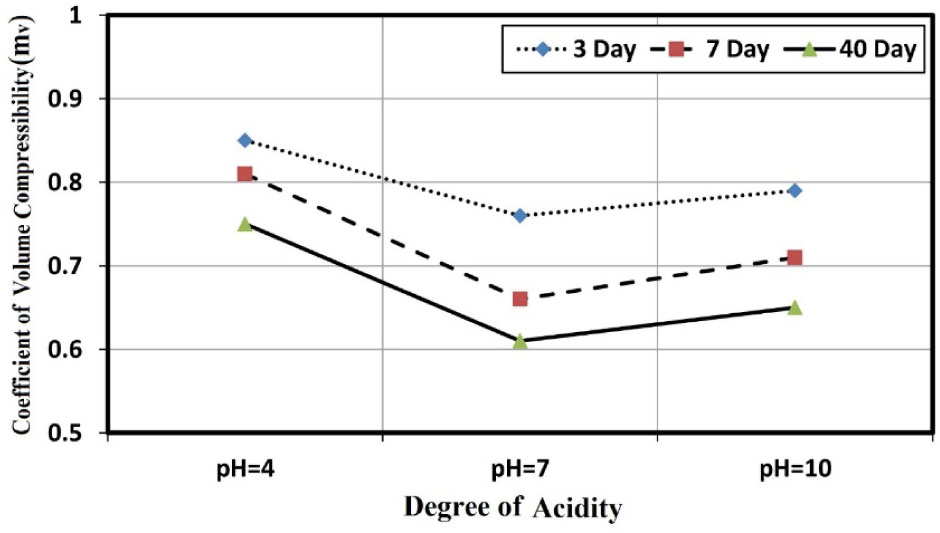
Figure 13
Volume change coefficient of 5% cement-stabilized samples in various environments in terms of acidity.