
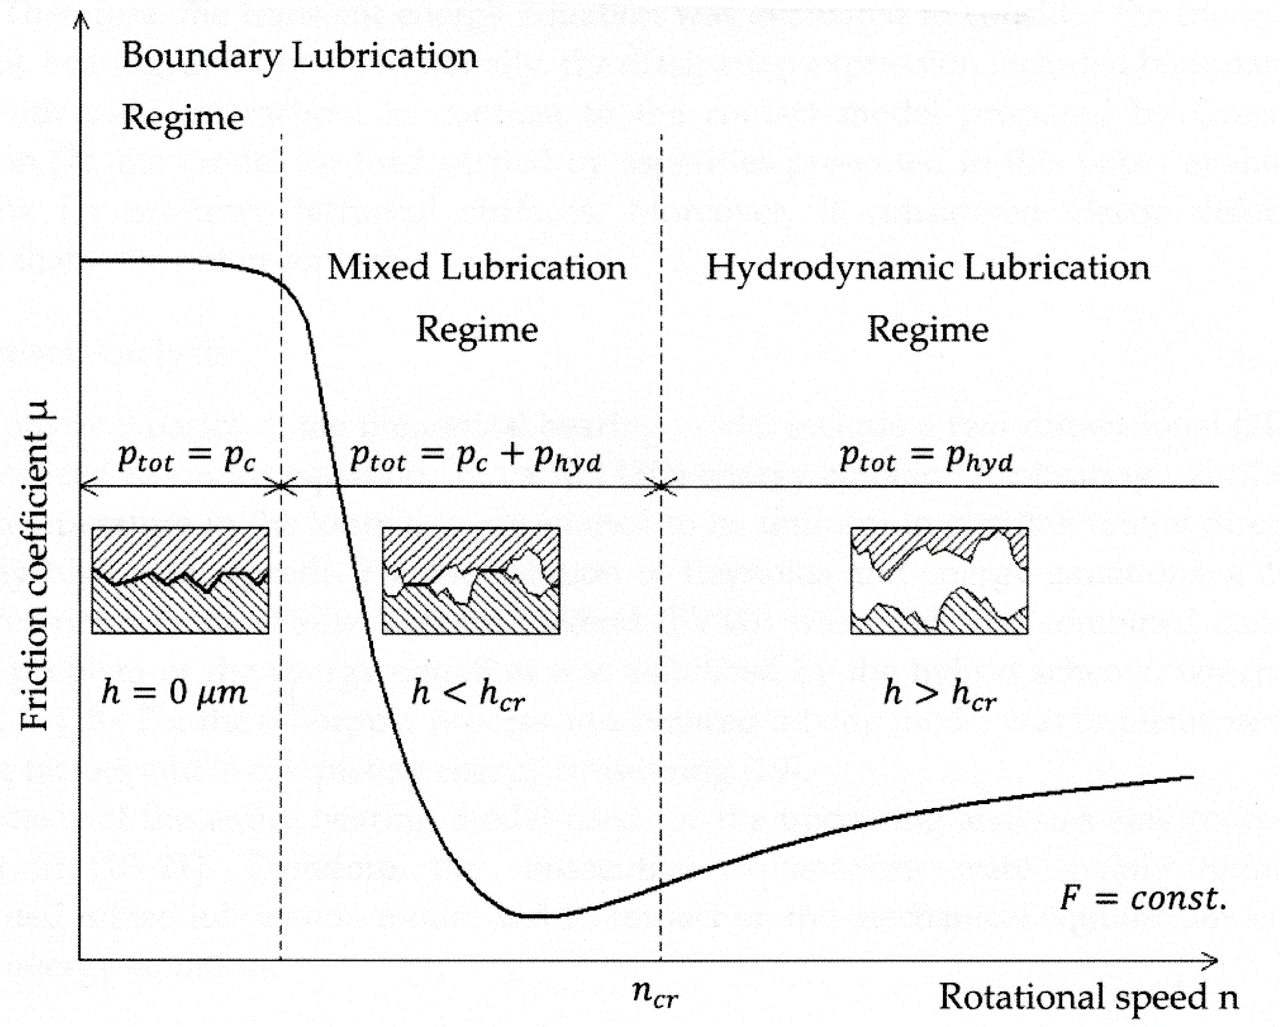
Figure 1
Stribeck curve with different lubrication regimes (after Prölß et al. 2018).
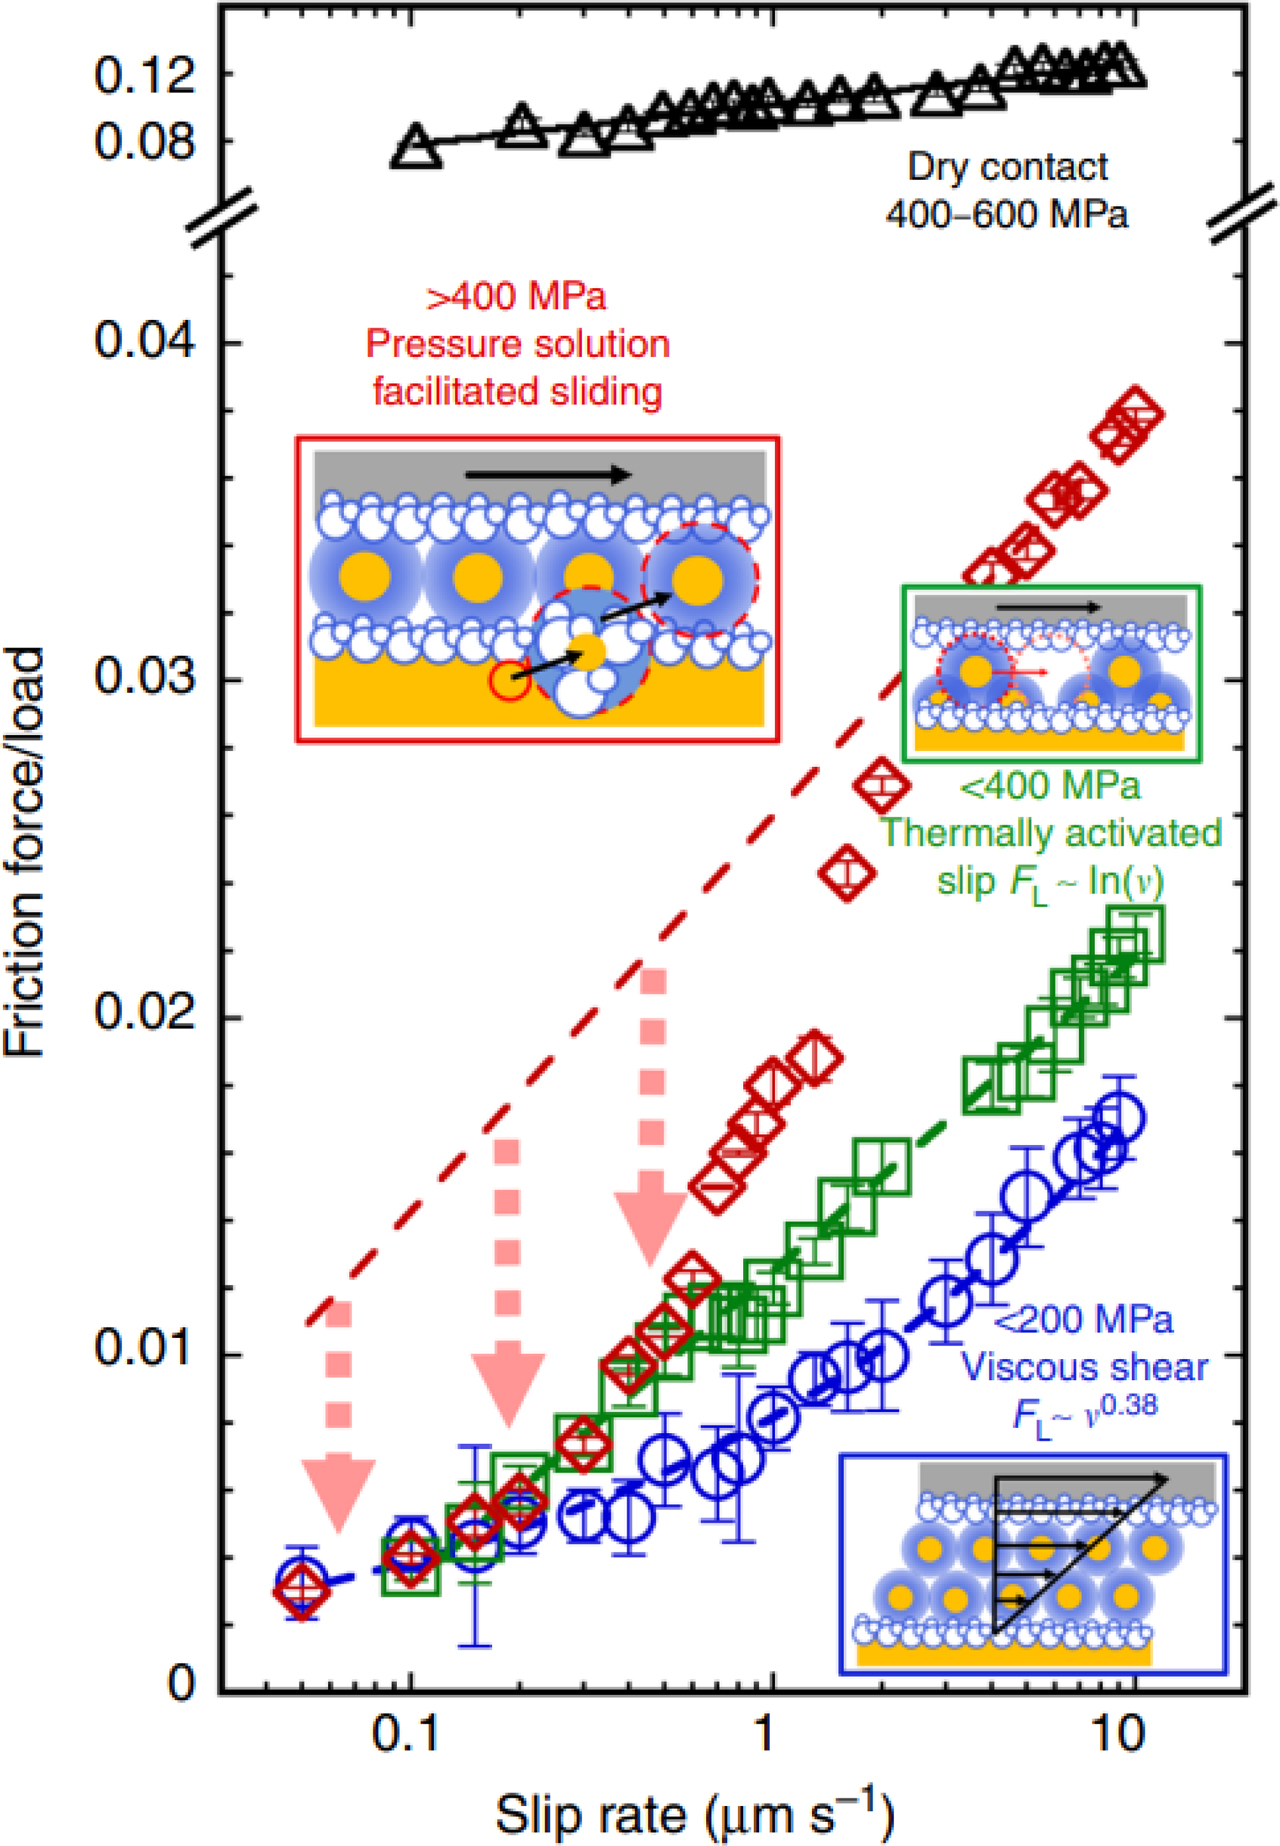
Figure 2
Rate-strengthening frictional strength of a single-asperity contact between calcite and an AFM tip in a 100 mM CaCl2 solution (after Diao and Espinosa-Marzal 2018). AFM: atomic force microscopy.
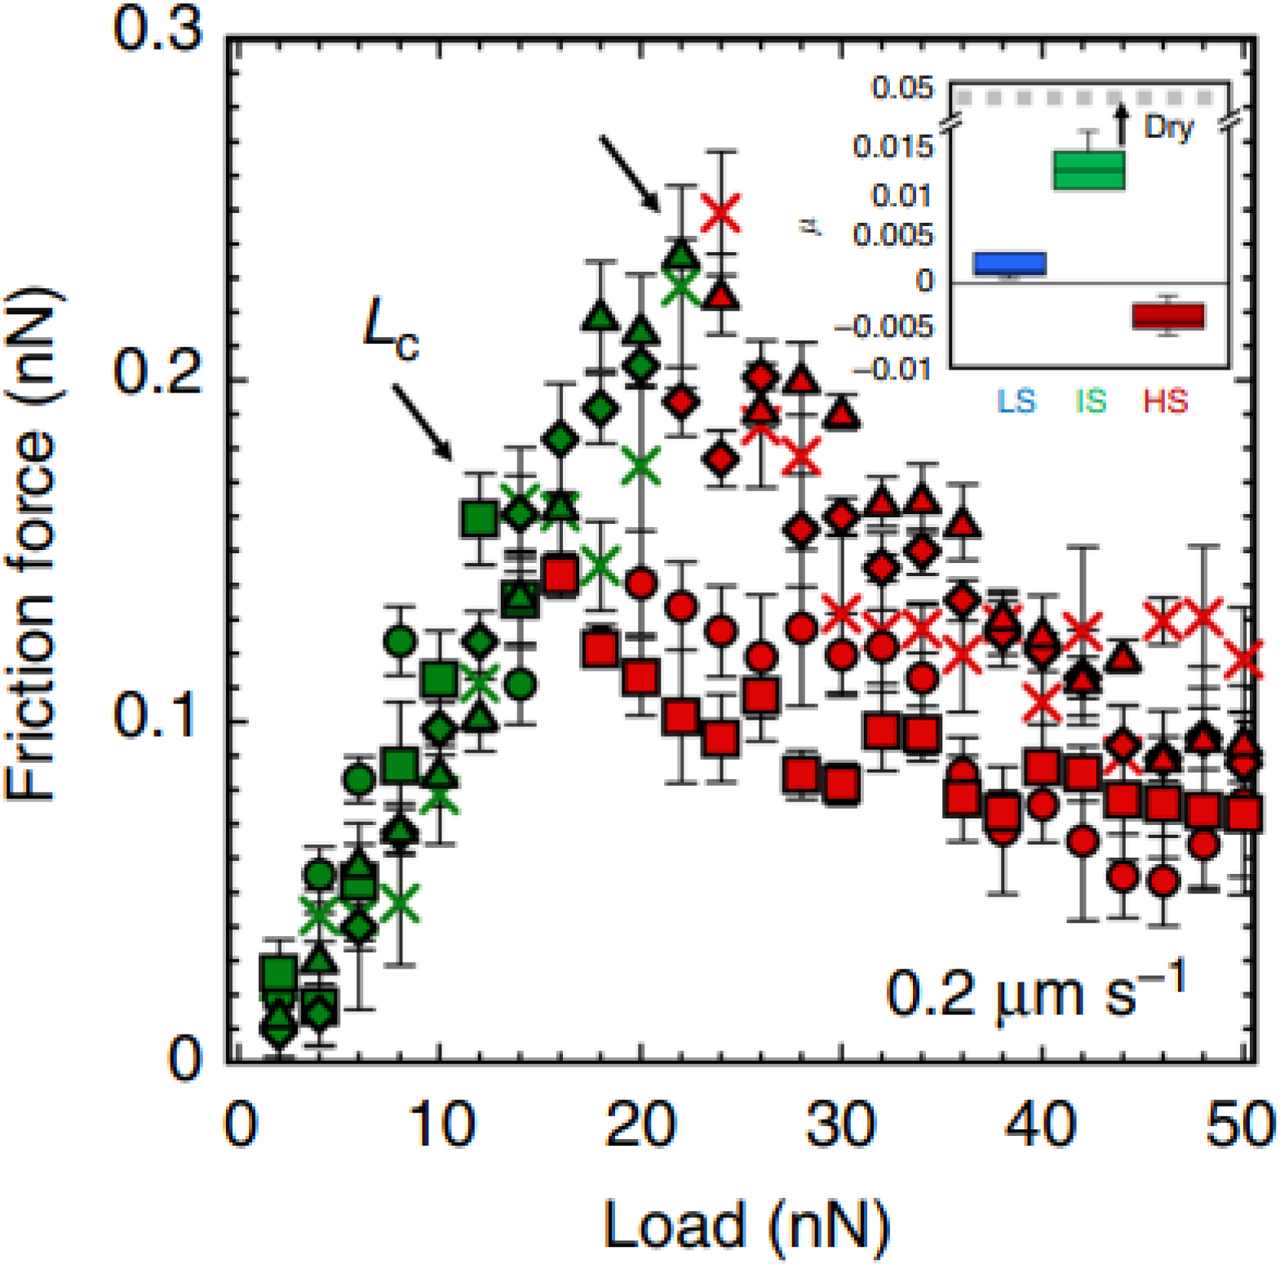
Figure 3
Friction between calcite and an AFM tip as a function of load in CaCl2 solutions at sliding speed of 0.2 μm/s (after Diao and Espinosa-Marzal 2018).
Table 1
Static friction coefficient of minerals under different humidity conditions (data from Horn and Deere 1962).
| Mineral | Oven dried | Saturated |
|---|---|---|
| Rose quartz | 0.13 | 0.45 |
| Microcline feldspar | 0.12 | 0.77 |
| Calcite | 0.14 | 0.68 |
| Muscovite | 0.43 | 0.23 |
| Chlorite | 0.53 | 0.22 |
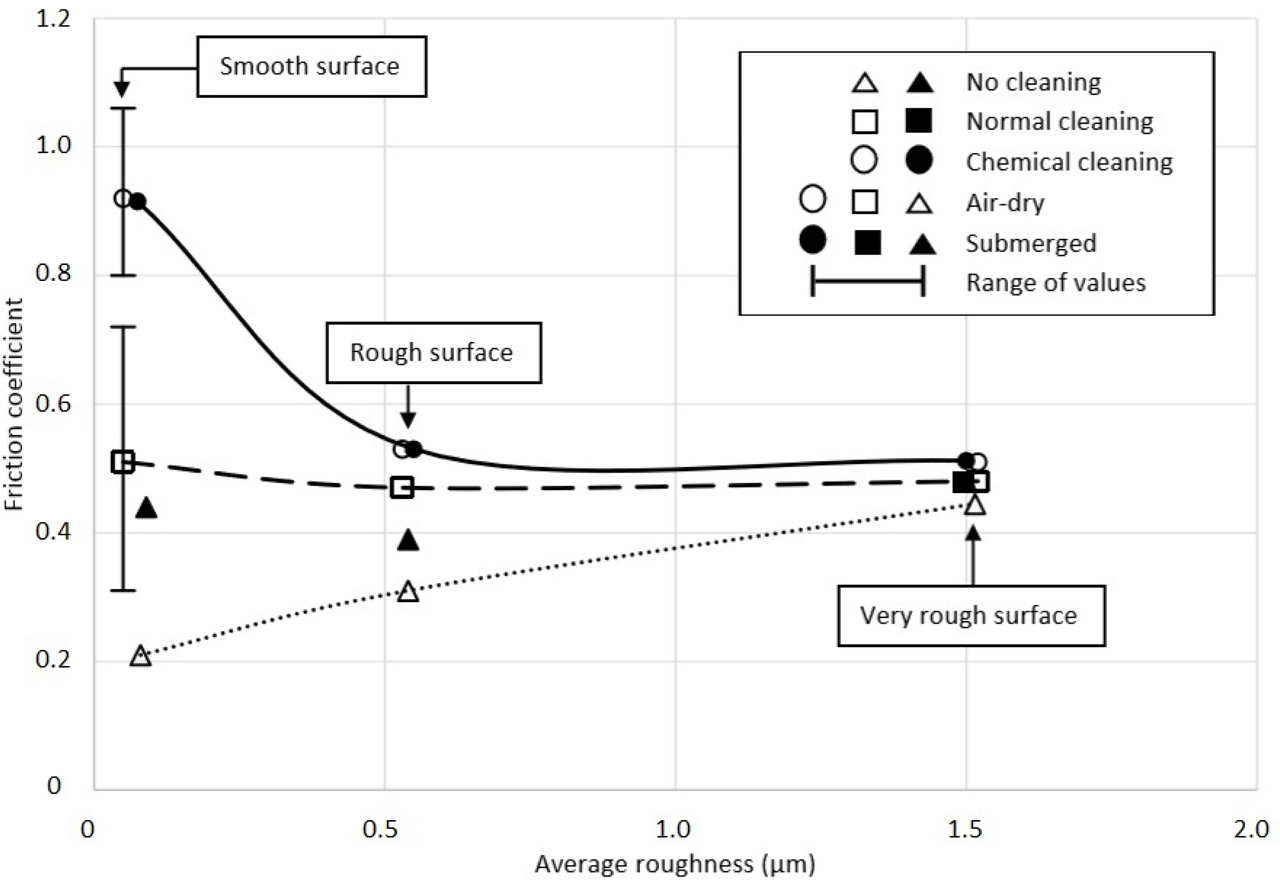
Figure 4
Friction coefficient of quartz (after Lambe and Whitman 1969, data from Bromwell 1966 and Dickey 1966; replotted).
Table 2
Morphological and friction parameters for two granular soils (DNA-1A and OS) with different roughness, under both dry and wet conditions; the interparticle friction angle is assessed based only on tests carried out at 1 N normal contact force (data from Marzulli et al. 2021).
| Material | Particle size (for microtest), mm | Hardness, GPa | Roundness | Roughness, nm | φ′bulk low stresses range (°) | φ′bulk medium–higher stresses range (°) | φ′μ (°) |
|---|---|---|---|---|---|---|---|
| DNA-1A dry | 1.0–1.8 | 0.3 | 0.6 | 1476 | 47.9 | 40.8 | 21 |
| DNA-1A wet | 45.9 | 30 | |||||
| OS dry | 0.5–0.8 | 5.8 | 0.8 | 204 | 45.0 | 36.5 | 7.6 |
| OS wet | 40.8 | - |
[i] DNA-1A: lunar regolith simulant; OS: Ottawa sand
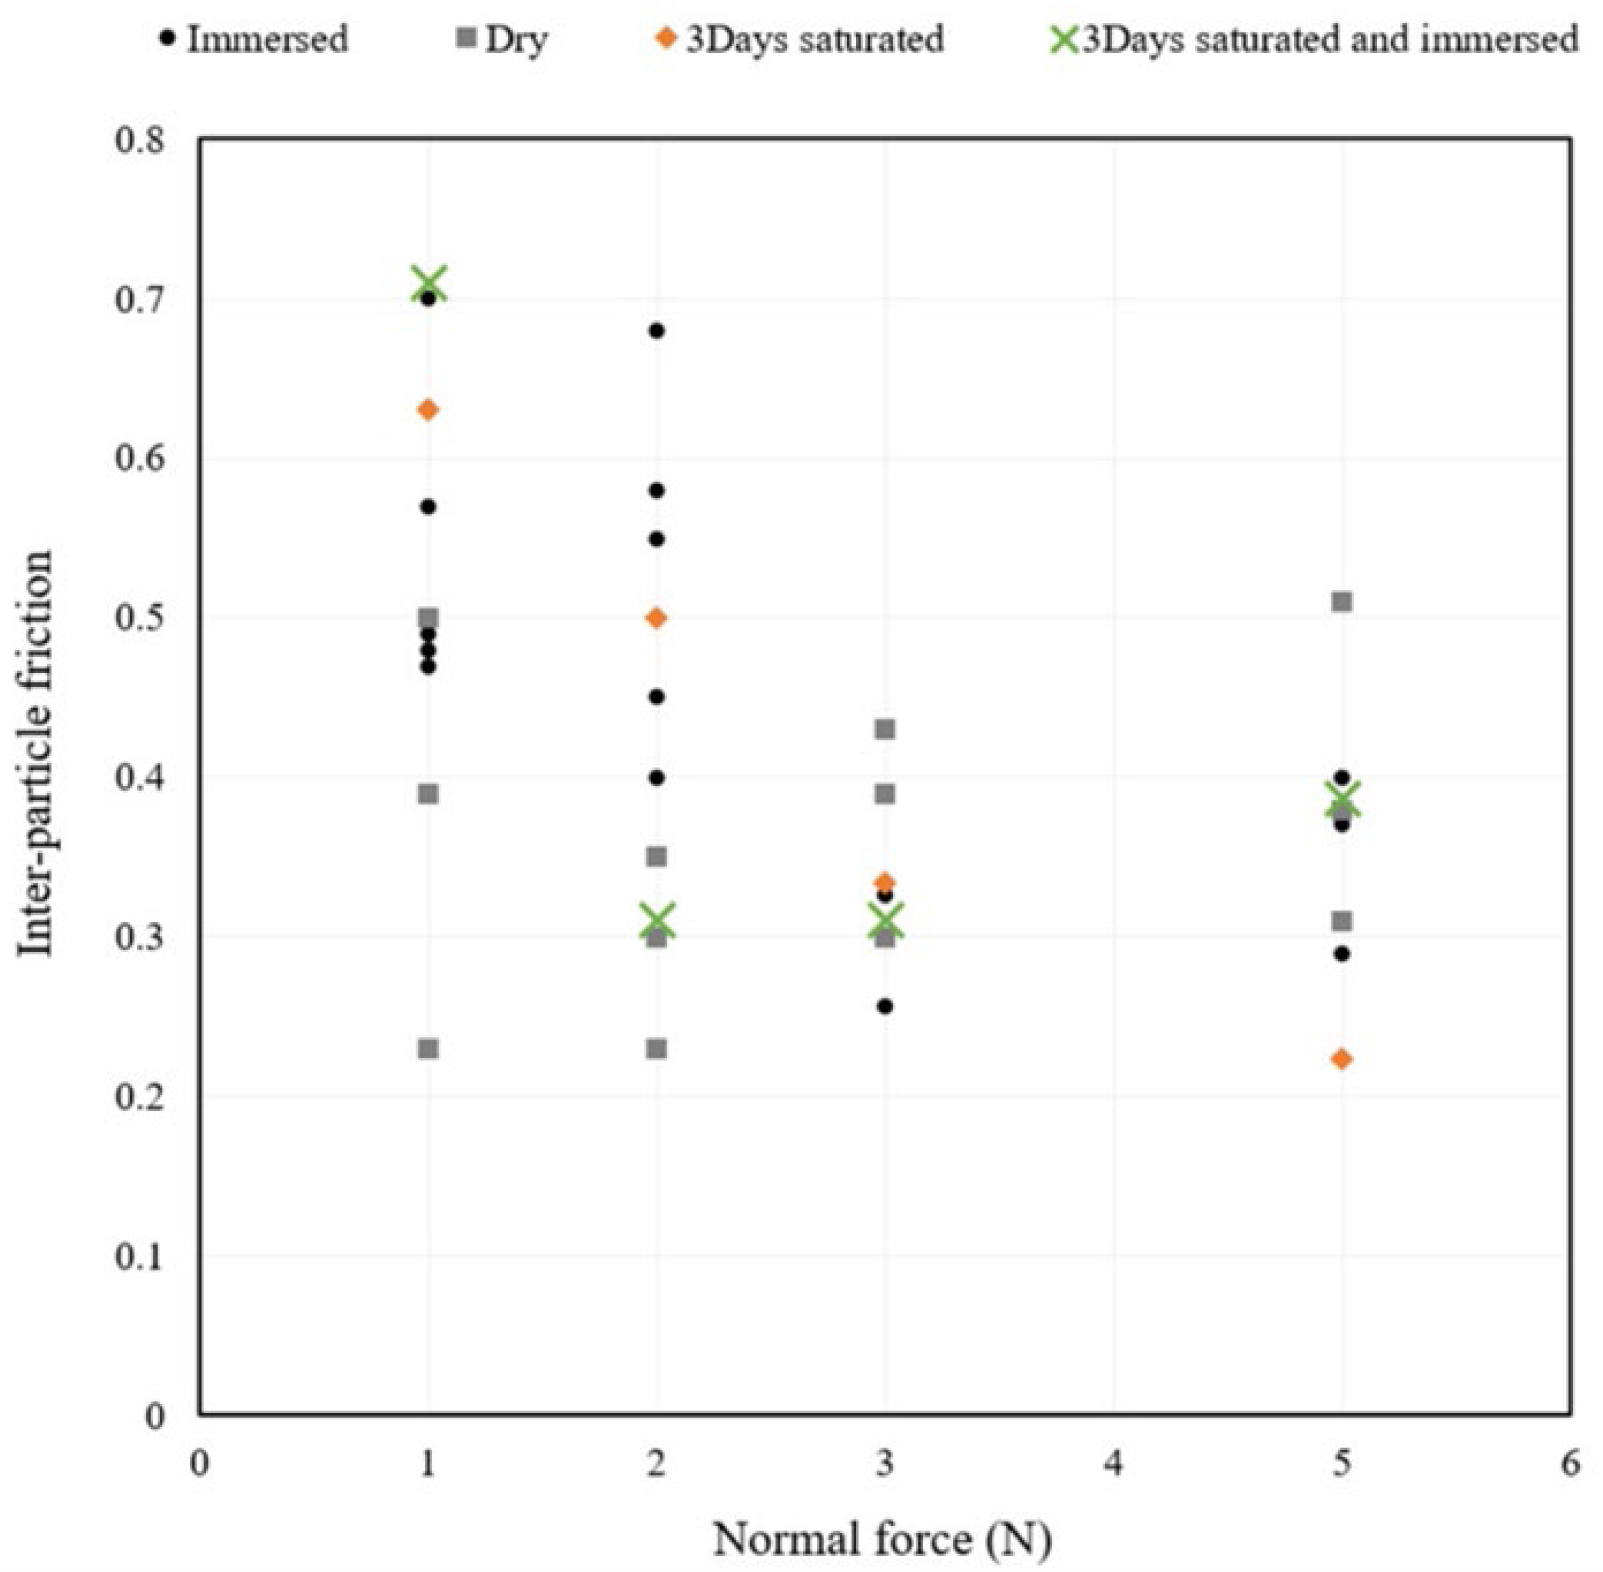
Figure 5
Interparticle friction versus normal force for DNA-1A lunar regolith simulant at different humidity conditions (after Marzulli et al. 2021).
Table 3
Shear strength of rock fractures under dry and wet conditions (data from Barton 1973; Alejano et al. 2012).
| Rock type | φb (°) | |
|---|---|---|
| Dry | Wet | |
| Mudstone | 32 | 29 |
| Siltstone | 32 | 30 |
| Limestone | 34 | 31 |
| Sandstone | 31 | 29 |
| Marble | 49 | 42 |
| Shale | 29 | 21 |
| Granite | 33 | 31 |
Table 4
Measured values of φb under different moisture conditions for granite and sandstone (data from Li et al. 2020).
| Rock type | Moisture condition | φb (°) |
|---|---|---|
| Granite | Dry | 33.46 |
| Wet surface | 30.59 | |
| Saturated | 30.38 | |
| Sandstone | Dry | 35.30 |
| Wet surface | 32.92 | |
| Saturated | 32.62 |
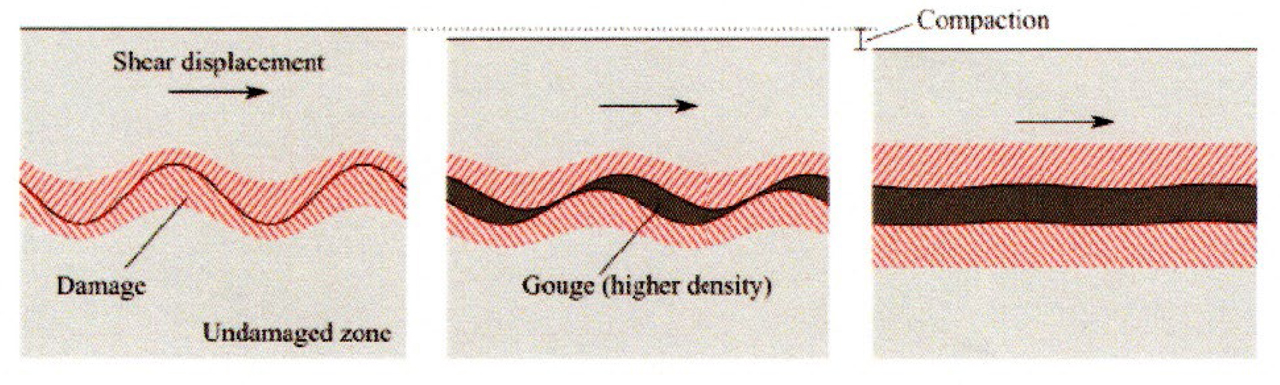
Figure 6
Schematic representation of gradual wear of asperities. Abraded grains form a gouge layer between the interfaces (after Braun et al. 2021).
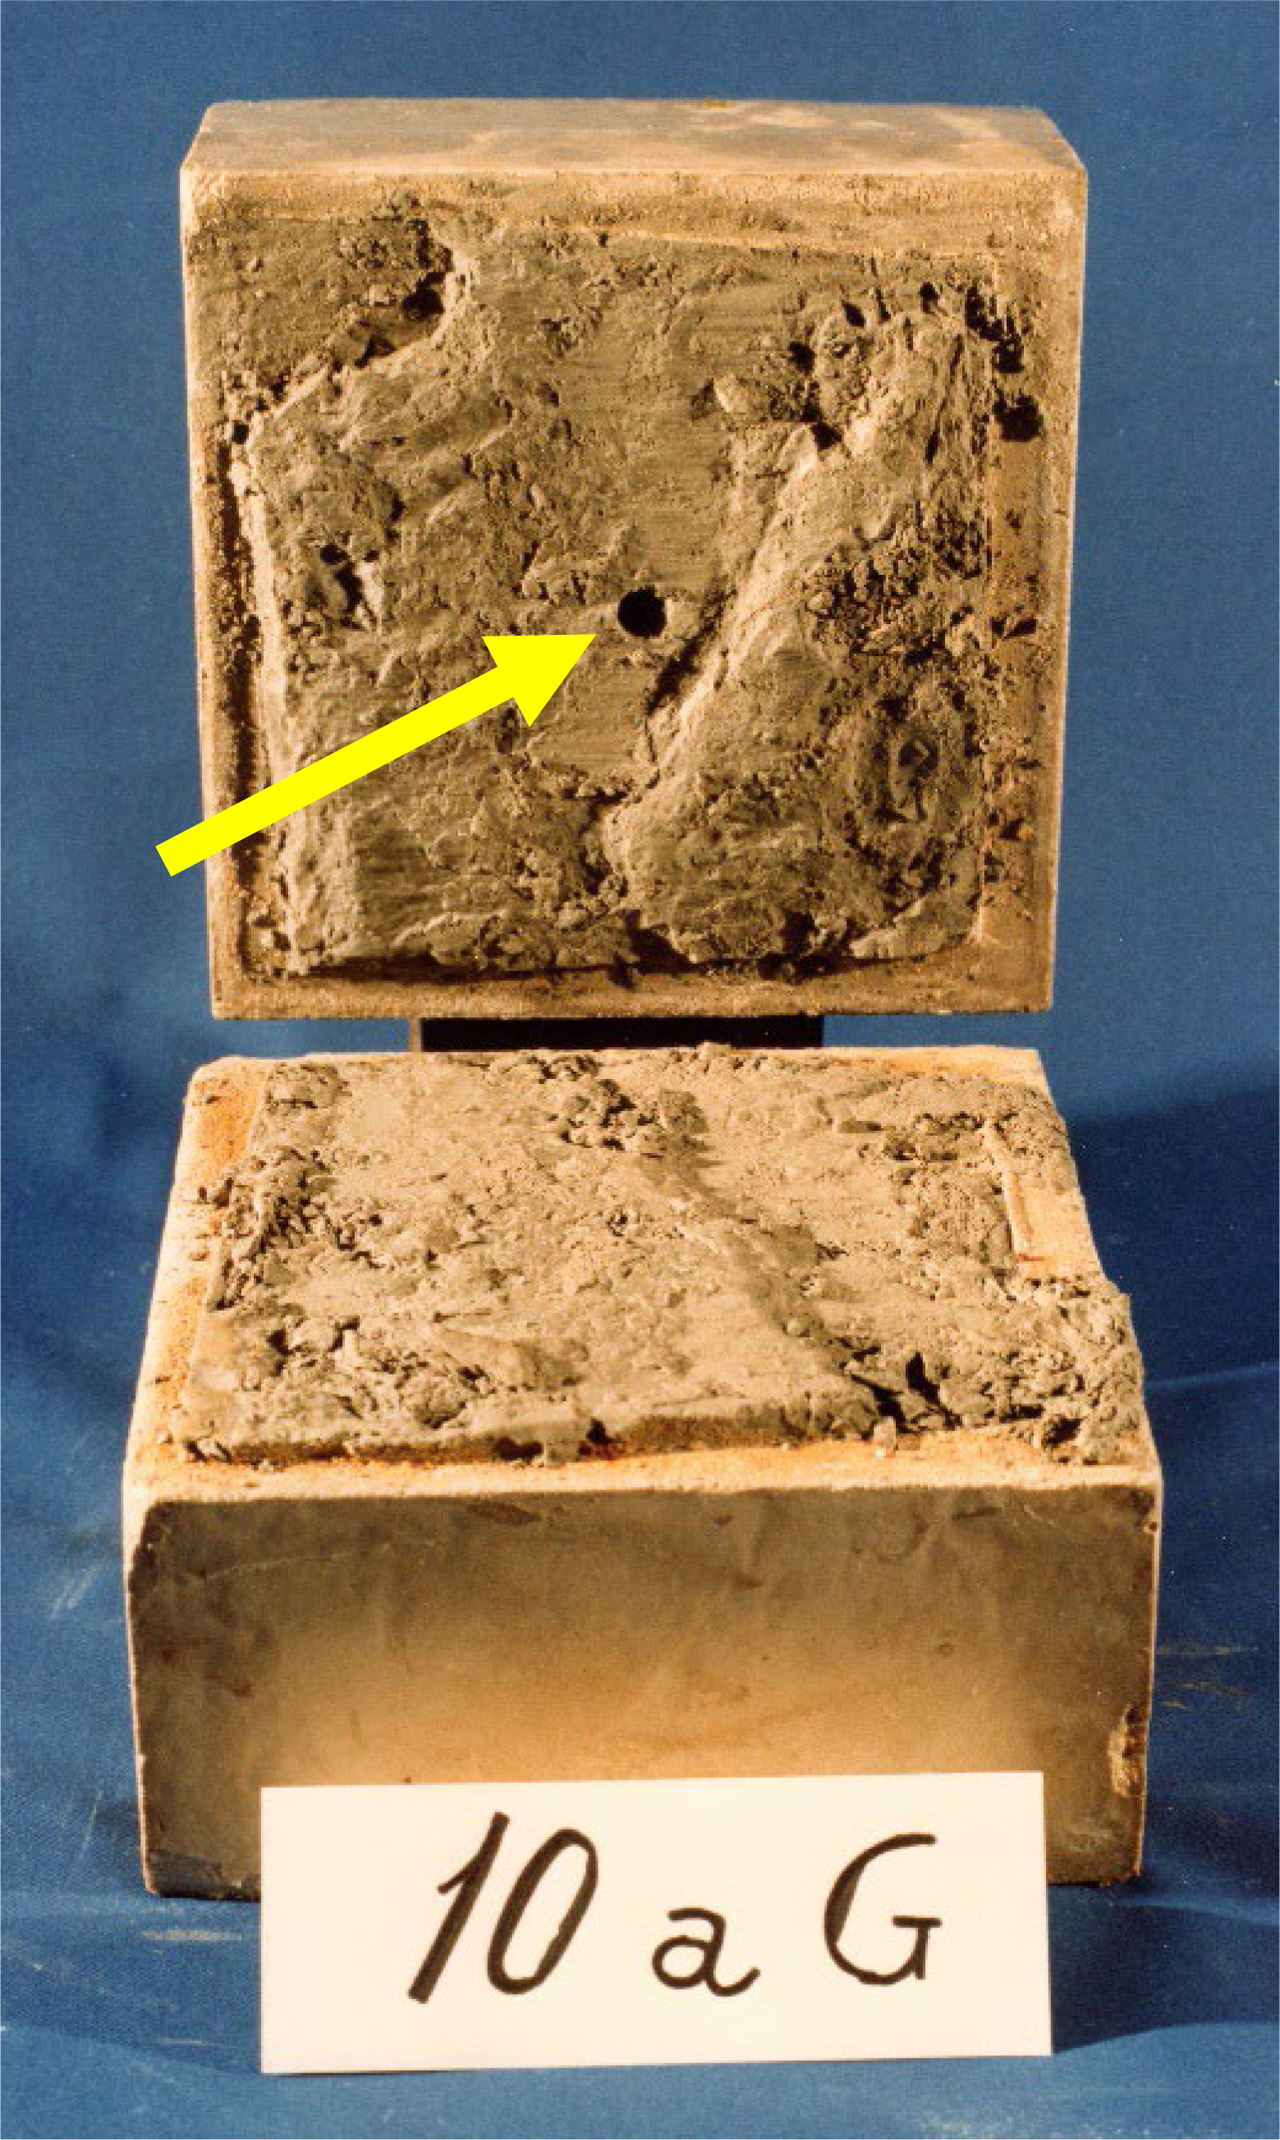
Figure 7
Campolattaro marl specimen subjected to direct shear test (the arrow indicates the hole in the middle for the rock joint saturation) (after ISMES 1982)
Table 5
Values of residual friction angle of Campolattaro marls for different conditions of humidity and shearing direction (data from ISMES 1982).
| Sample joint | Shearing direction | Number of data | Friction angle by linear regression (°) | Average friction angle (°) |
|---|---|---|---|---|
| Saturated | Parallel to joint | 8 | 17.7 | 16.3 |
| Dry | Parallel to joint | 9 | 38.0 | 37.8 |
| Dry | Perpendicular to joint | 8 | 44.4 | 44.5 |
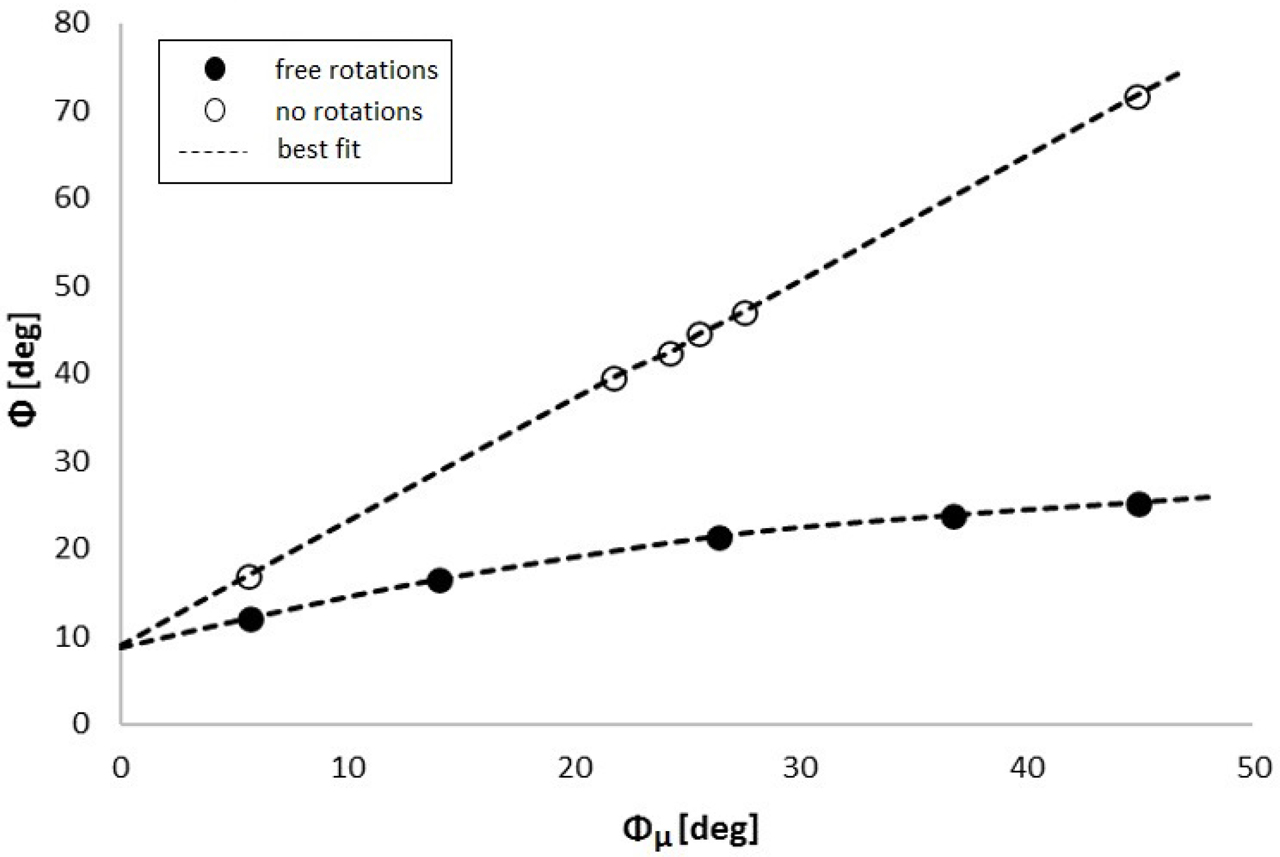
Figure 8
Bulk friction as a function of interparticle friction: 2D DEM results (after Calvetti and Nova 2004; replotted)