
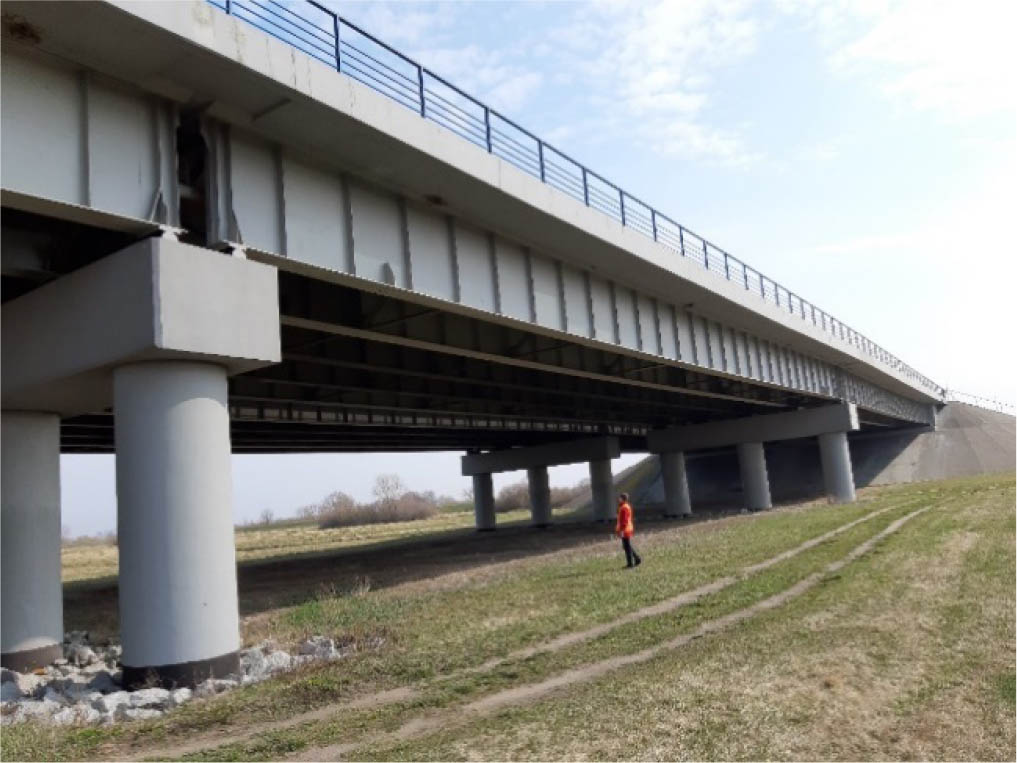
Figure 1
View of selected spans of the bridge structure.
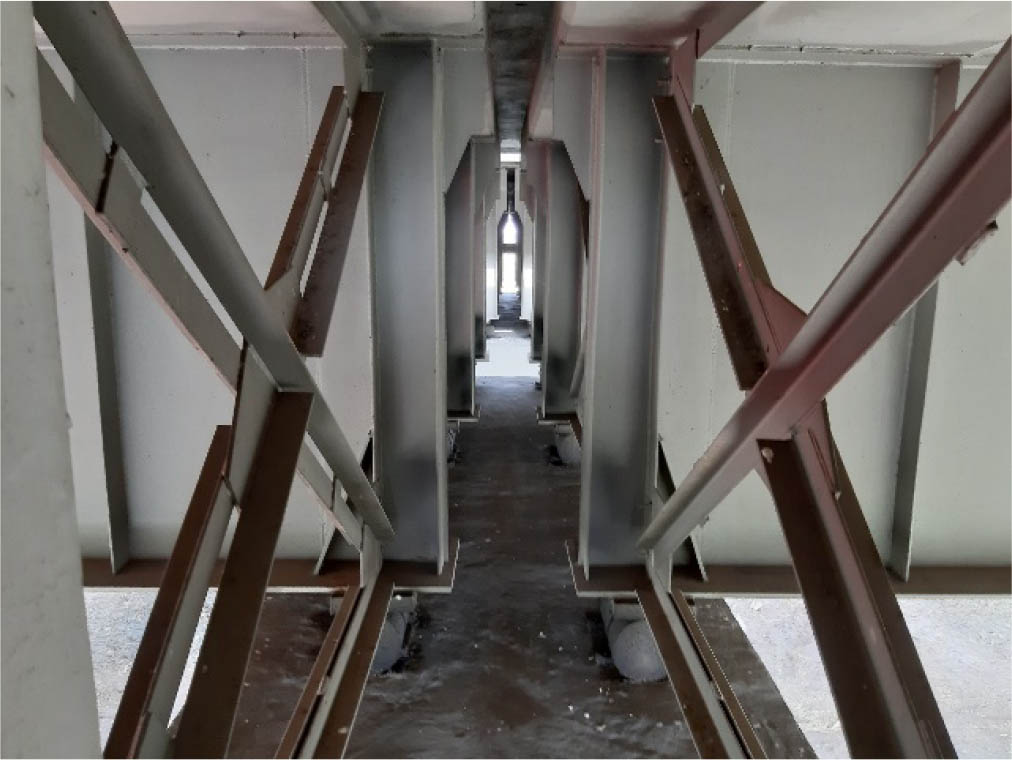
Figure 2
View of the support zone of the span structure.
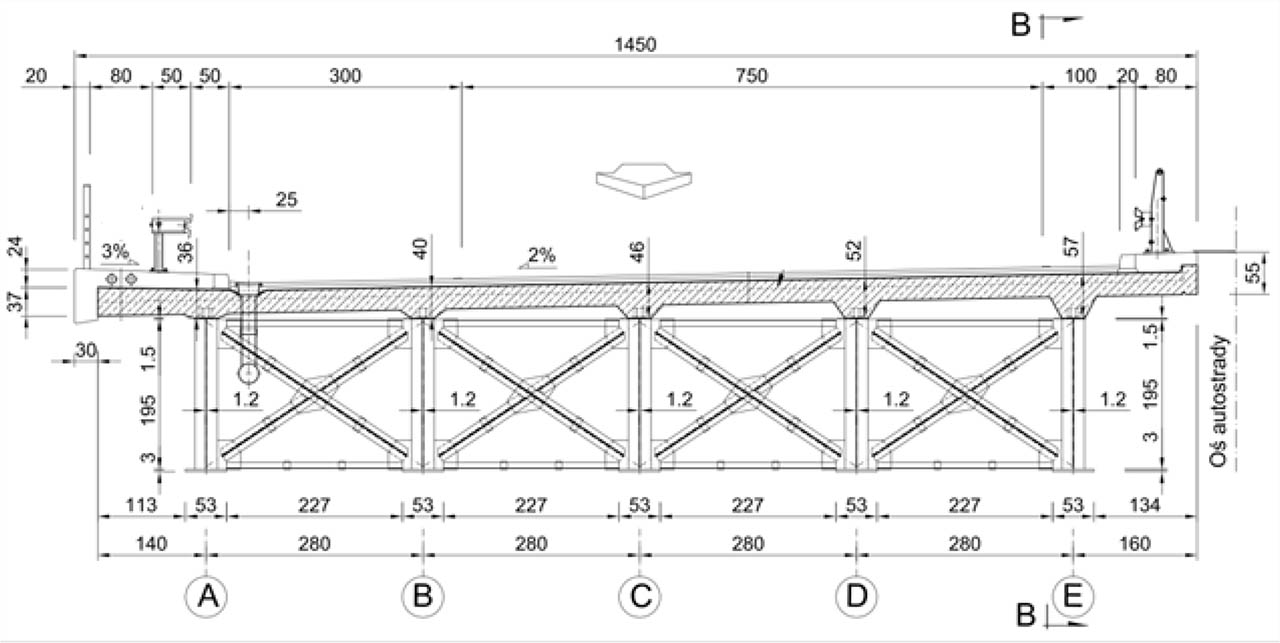
Figure 3
Basic dimensions of a single structure of a bridge span – cross section.
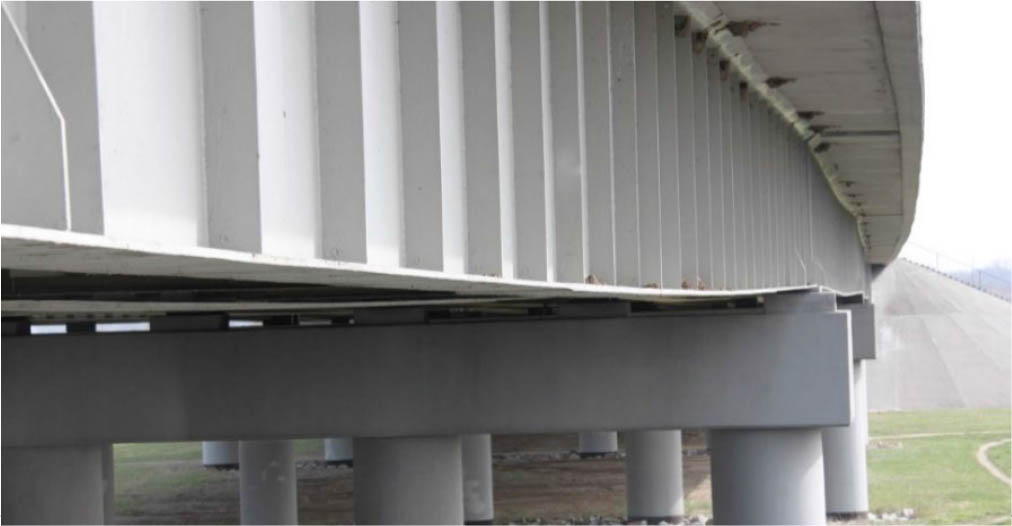
Figure 4
Permanent deflections of the girders of the main spans.

Figure 5
Scheme of the spans’ geometry model – the three-span system was analysed; for the purpose of analyses, the spans were marked as 1, 2 and 3

Figure 6
Numerical model of the structure developed in the SOFiSTiK program – side view with spans marked
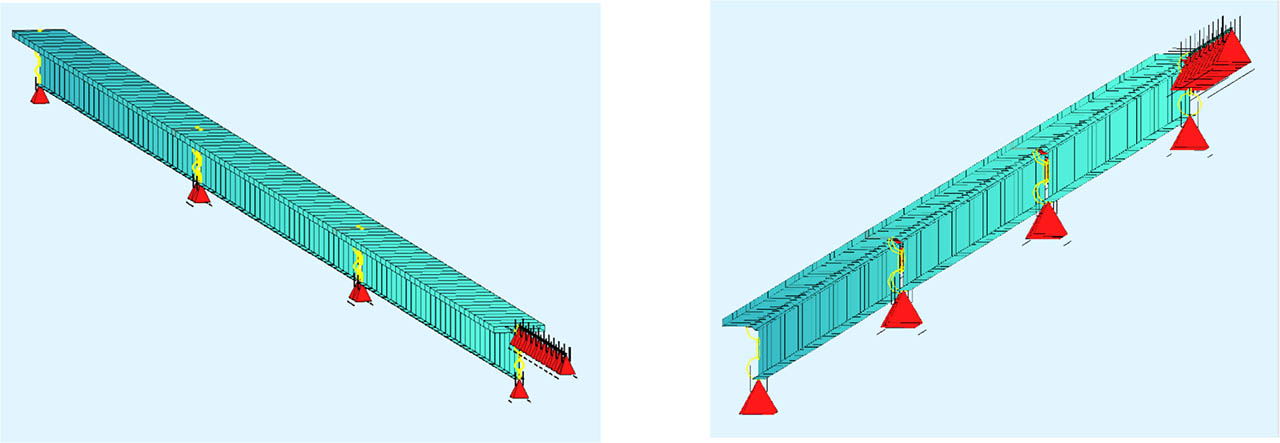
Figure 7
Axonometric views of the numerical model of the structure developed in the SOFiSTiK program.
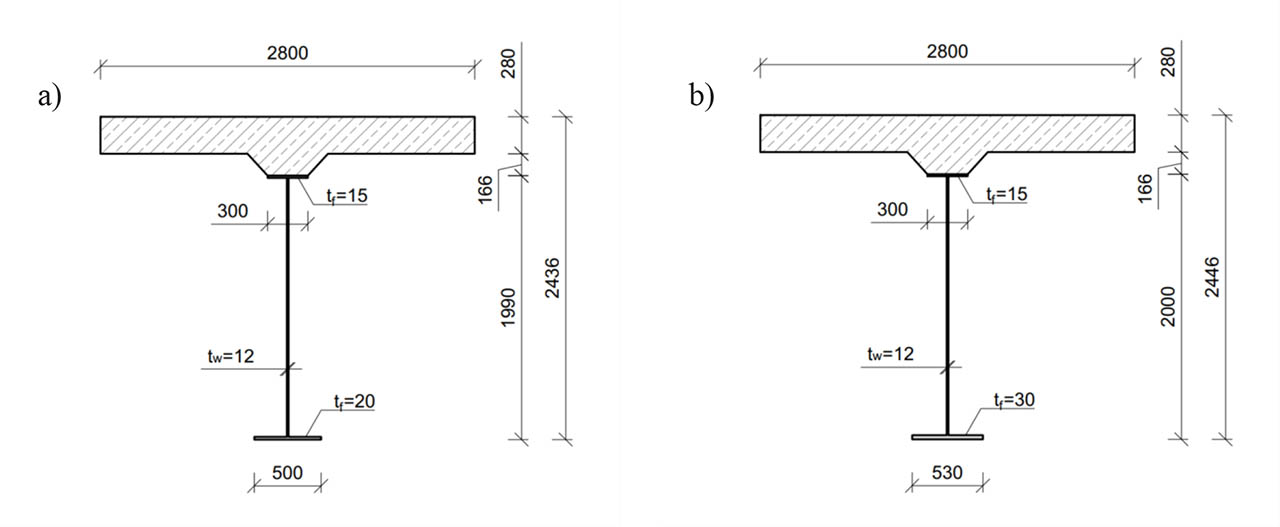
Figure 8
Cross sections of the bar elements of the model of the superstructure: (a) cross section – type 1 (near the support), (b) cross section – type 2 (in the middle of the span)
Table 1
Summary of material parameters of the steel and reinforced concrete parts of the bar elements of the FEM model.
| Material characteristics | Steel girder | Reinforced concrete slab | |||
|---|---|---|---|---|---|
| Self-weight (volumetric weights additionally take into account the weight of the span's bracings and the spans’ equipment) | γ | 82.6 | 29.6 | ||
| Young's modulus | E | 210,000.0 | 36000.0 | ||
| Shear modulus | G | 80,769.0 | 15000.0 | ||
| Poisson ratio | μ | 0.3 | ( - ) | 0.2 | ( - ) |
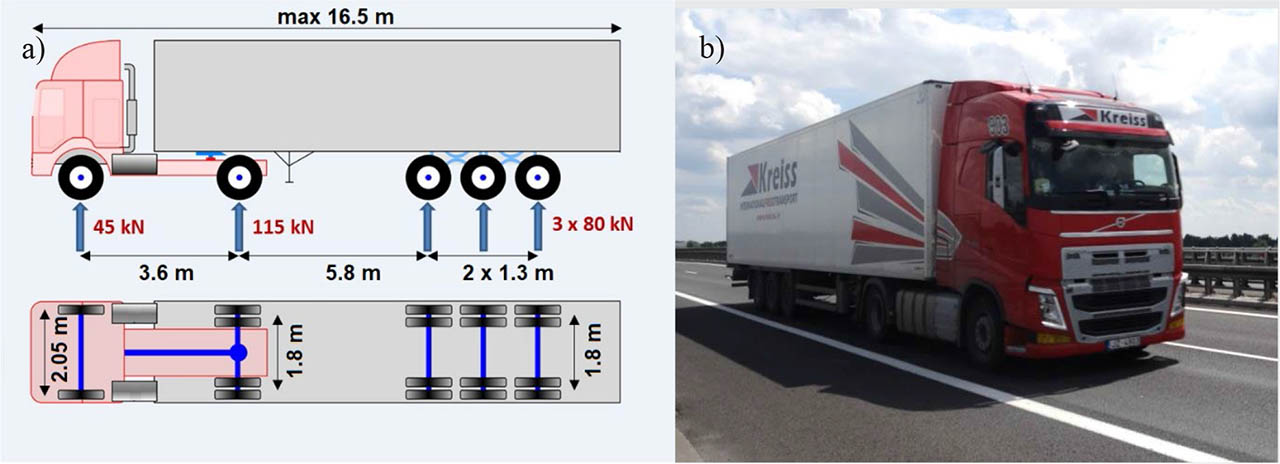
Figure 9
Typical five-axle vehicle weighing 40 t: (a) wheelbase and loads of the vehicle’s axle, (b) general view of the vehicle passing through the considered facility
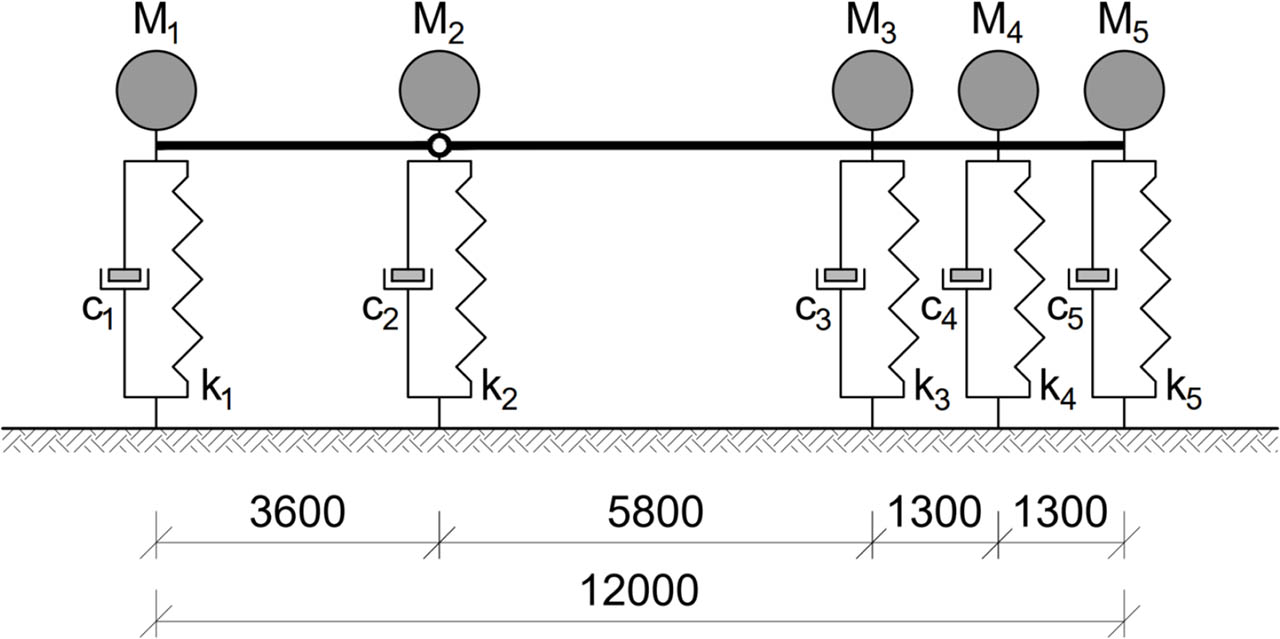
Figure 10
The scheme of the suspension modelled as viscoelastic oscillators connected by a bar of considerable stiffness – modelling structure of vehicle.
Table 2
Parameters of the numerical models of the considered vehicles.
| Vehicle model | Model A | Model B |
|---|---|---|
| Basic natural frequencies | 2.3 Hz | 7.5 Hz |
| Number of generalised nodal displacements | 5 | 5 |
| Concentrated masses in the place of the axles | M1=1.265 t | M1=1.265 t |
| M2=2.415 t | M2=2.415 t | |
| M3–5=1.840 t | M3–5=1.840 t | |
| Suspension rigidity | k1=263.9 kN/m | k1=2806.0 kN/m |
| k2=503.8 kN/m | k2=5357.0 kN/m | |
| k3–5=383.9 kN/m | k3–5==4082.0 kN/m | |
| Suspension damping | c1=3.654 kN/(m·s) | c1==11.920 kN/(m·s) |
| c2=6.976 kN/(m·s) | c2=22.750 kN/(m·s) | |
| c3–5=5.315 kN/(m·s) | c3–5=17.330 kN/(m·s) |
Table 3
Selected results of linear modal analysis using FEM.
| The first group of natural forms of vibrations | ||

|

|

|
| The second group of natural forms of vibrations | ||

|

|

|
| The third group of natural forms of vibrations | ||

|

|

|
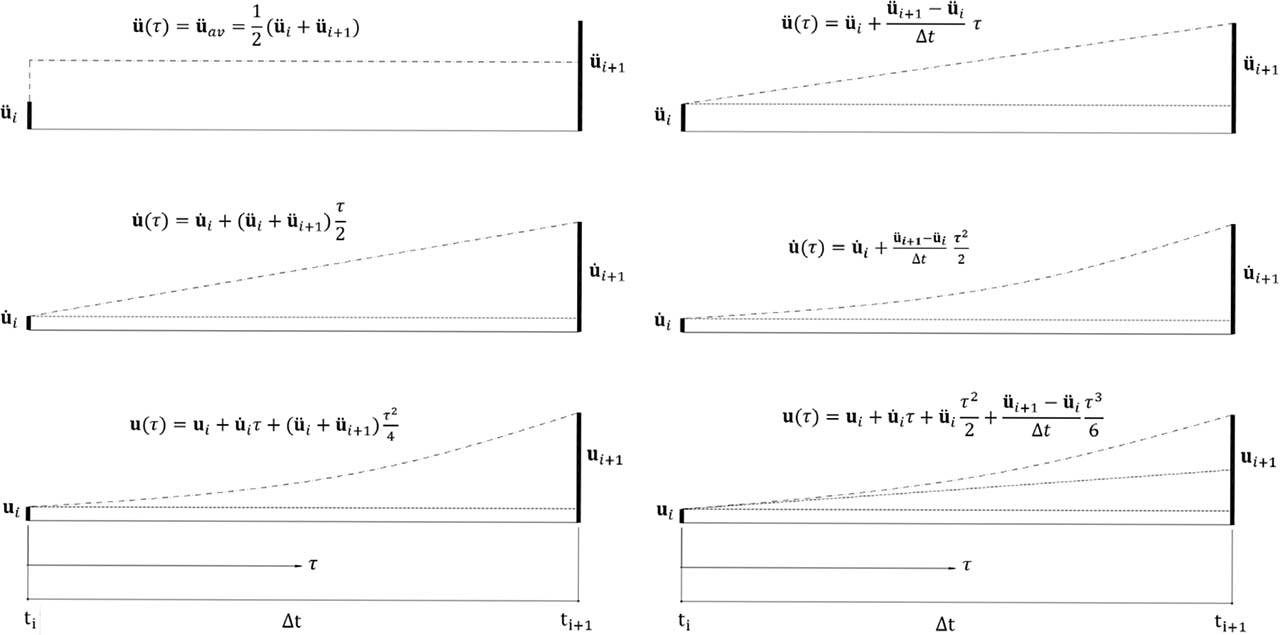
Figure 11
The average acceleration value method (left); the linear acceleration change method (right).
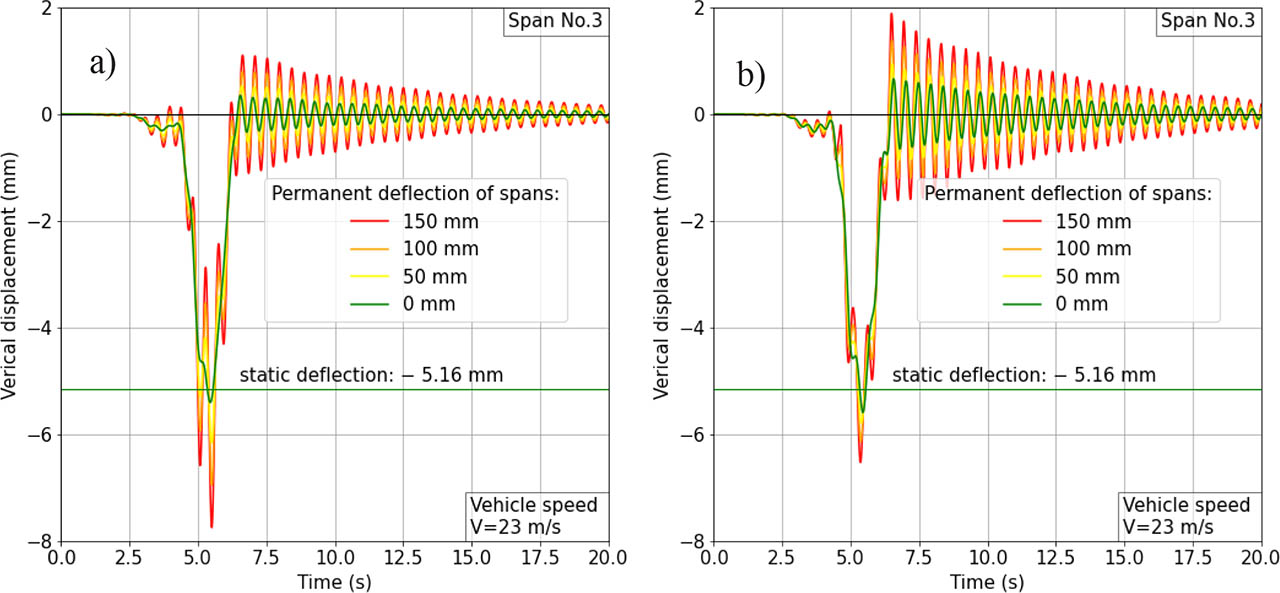
Figure 12
Changes in the displacements of the cross section located in the middle of span 3, which were caused by the passage of a vehicle (vehicle speed 23 m/s = 82.8 km/h; permanent deflections: 0–150 mm): (a) Model A (elastic suspension), (b) Model B (rigid suspension).
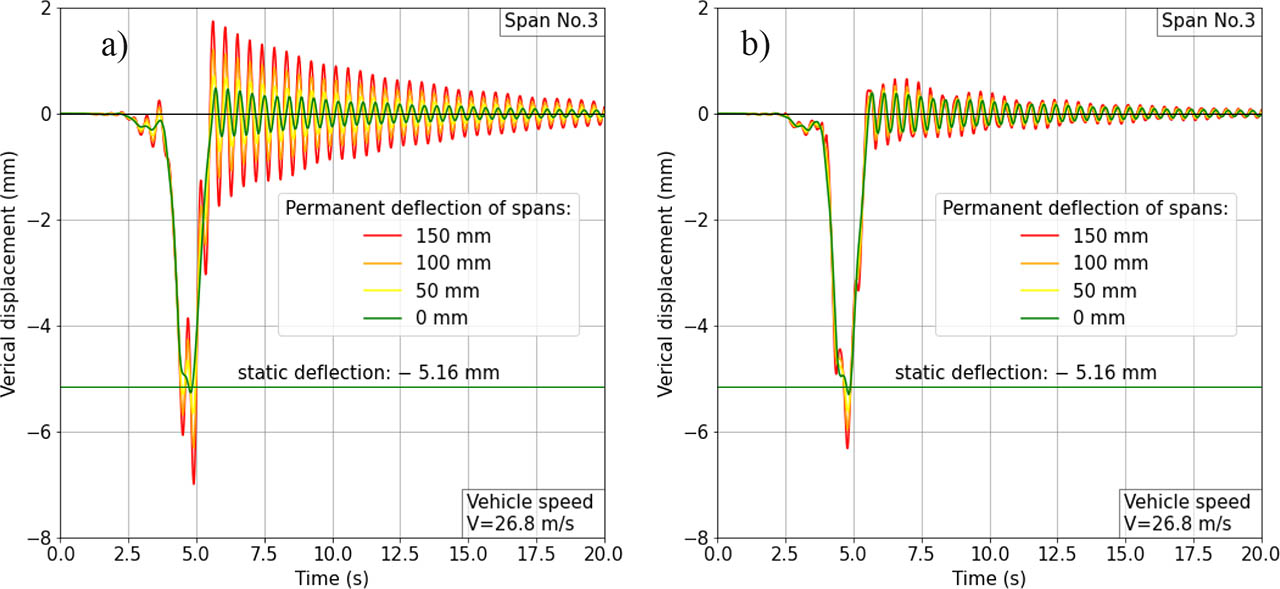
Figure 13
Changes in the displacements of the cross section located in the middle of span 3, which were caused by the passage of a vehicle (vehicle speed 26.8 m/s = 96.5 km/h; permanent deflections: 0–150 mm): (a) Model A (elastic suspension), (b) Model B (rigid suspension).
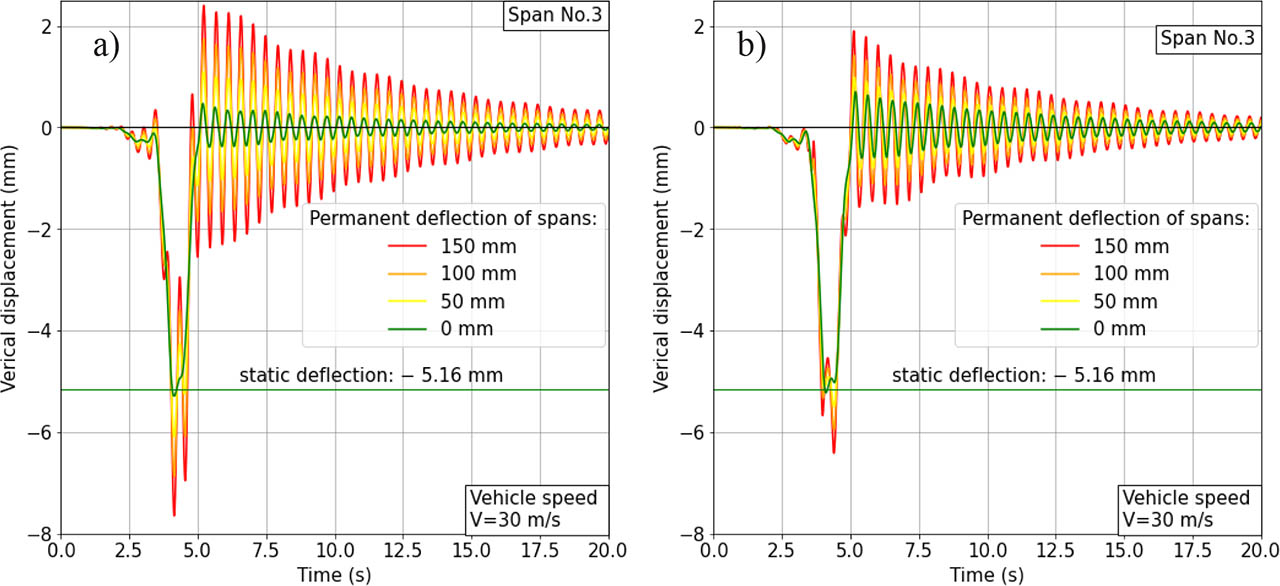
Figure 14
Changes in the displacements of the cross section located in the middle of span 3, which were caused by the passage of a vehicle (vehicle speed 30 m/s = 108 km/h; permanent deflections: 0–150 mm): (a) Model A (elastic suspension), (b) Model B (rigid suspension).
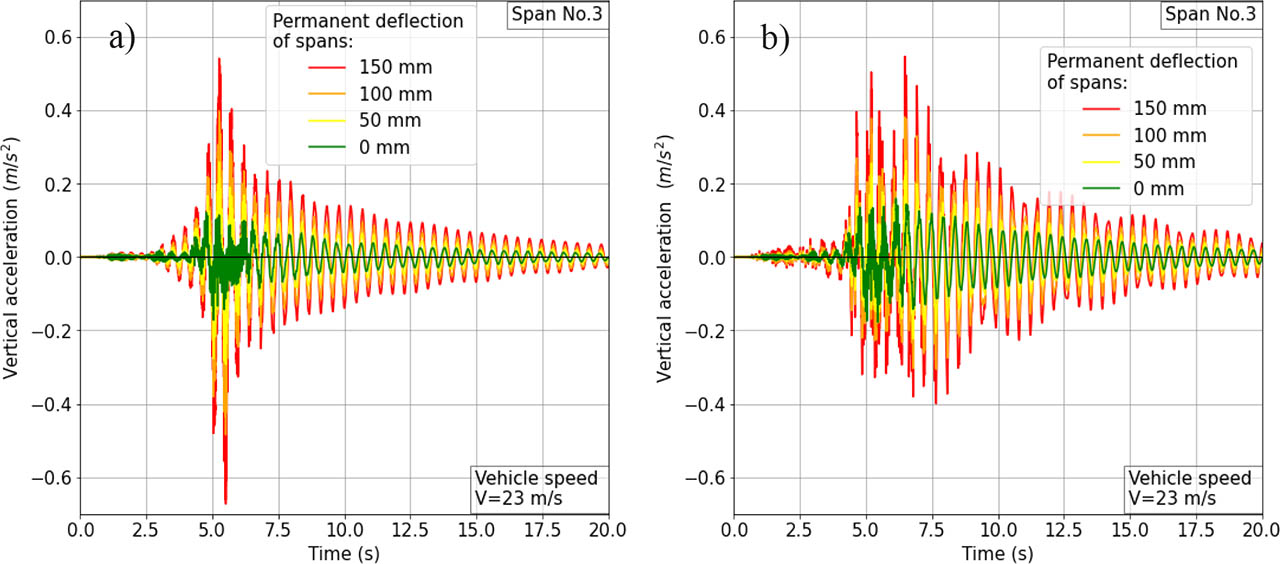
Figure 15
Changes in the vibration accelerations of the cross section located in the middle of span 3, which were caused by the passage of a vehicle (vehicle speed 23 m/s = 82.8 km/h; permanent deflections: 0–150 mm): (a) Model A (elastic suspension), (b) Model B (rigid suspension)
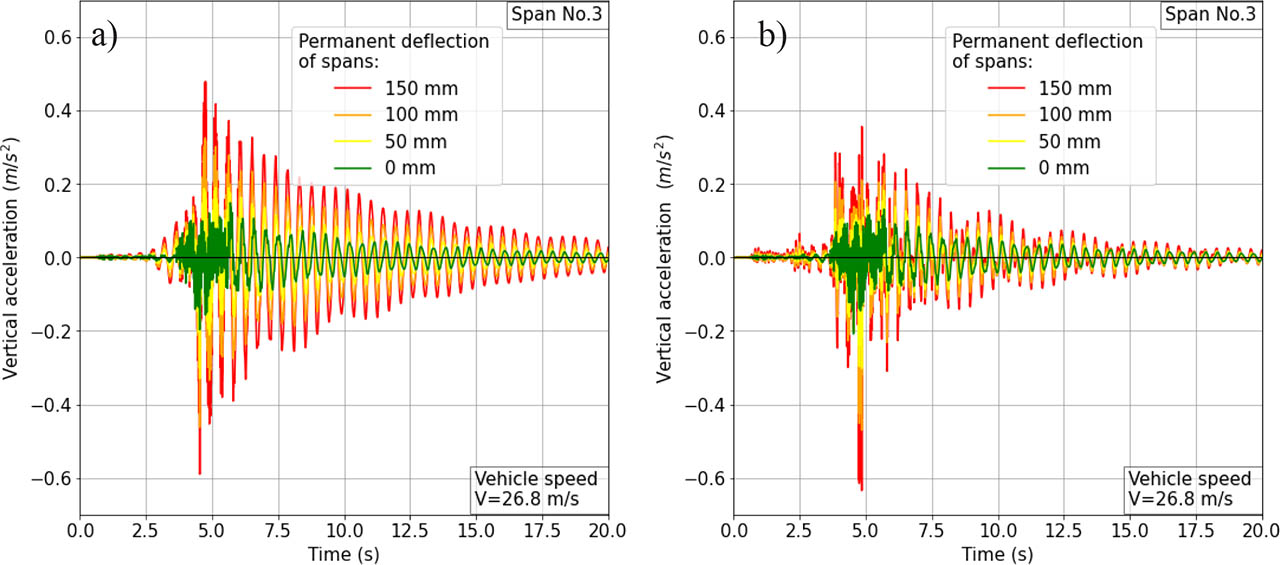
Figure 16
Changes in the vibration accelerations of the cross section located in the middle of span 3, which were caused by the passage of a vehicle (vehicle speed 26.8 m/s = 96.5 km/h; permanent deflections: 0–150 mm): (a) Model A (elastic suspension), (b) Model B (rigid suspension).
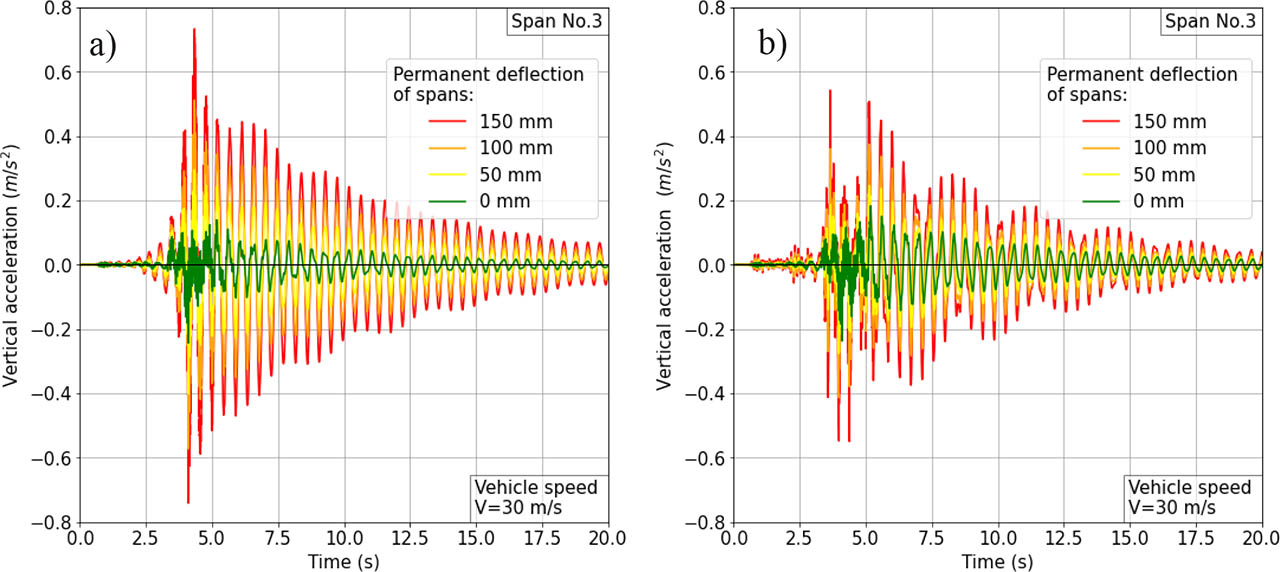
Figure 17
Changes in the vibration accelerations of the cross section located in the middle of span 3, which were caused by the passage of a vehicle (vehicle speed 30 m/s = 108 km/h; permanent deflections: 0–150 mm): (a) Model A (elastic suspension), (b) Model B (rigid suspension).
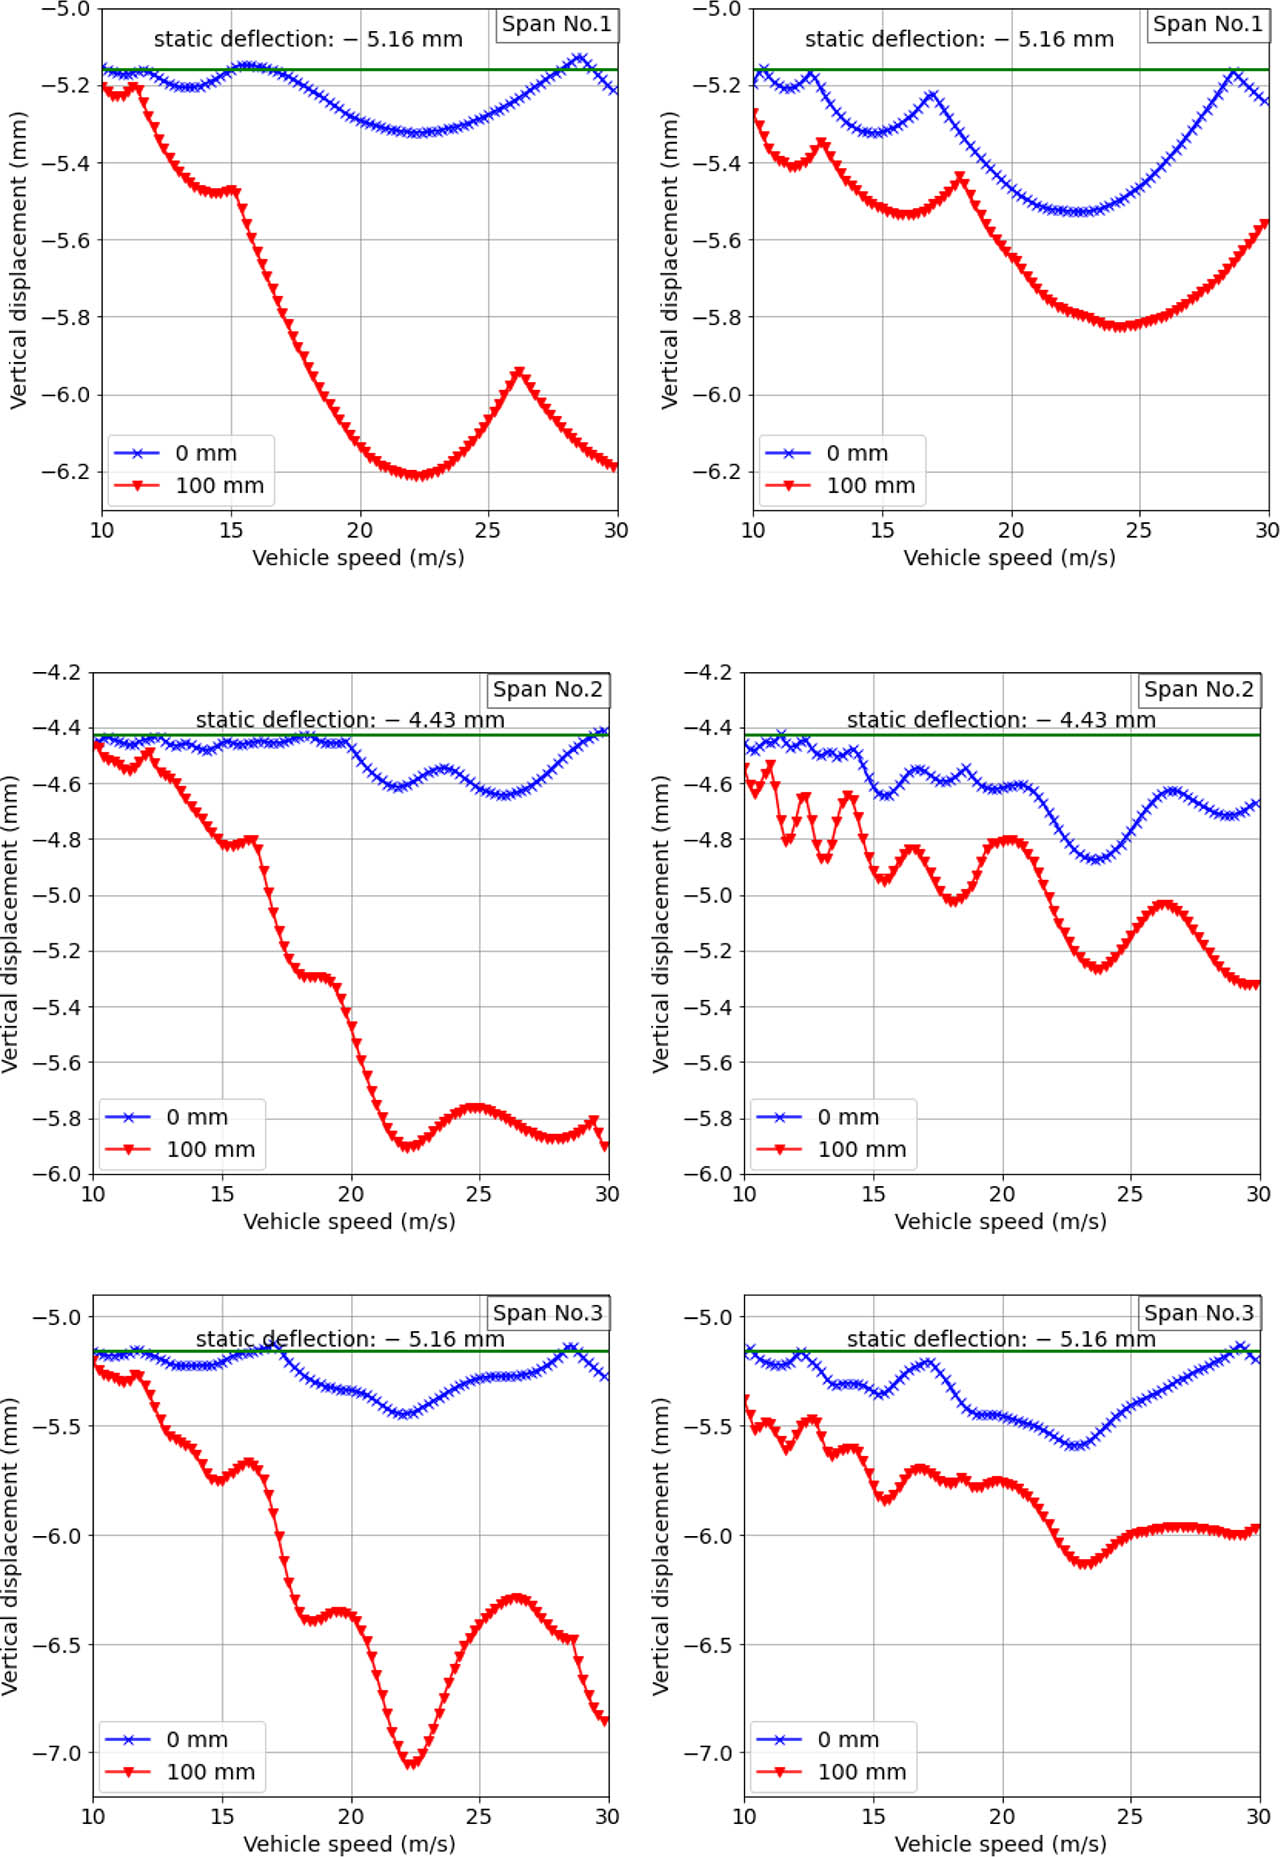
Figure 18
The maximum deflections of the cross section located in the middle of spans 1–3 as a function of the vehicle speed and the value of permanent deflections (0 and 100 mm, respectively): Model A (elastic suspension; left), Model B (rigid suspension; right).
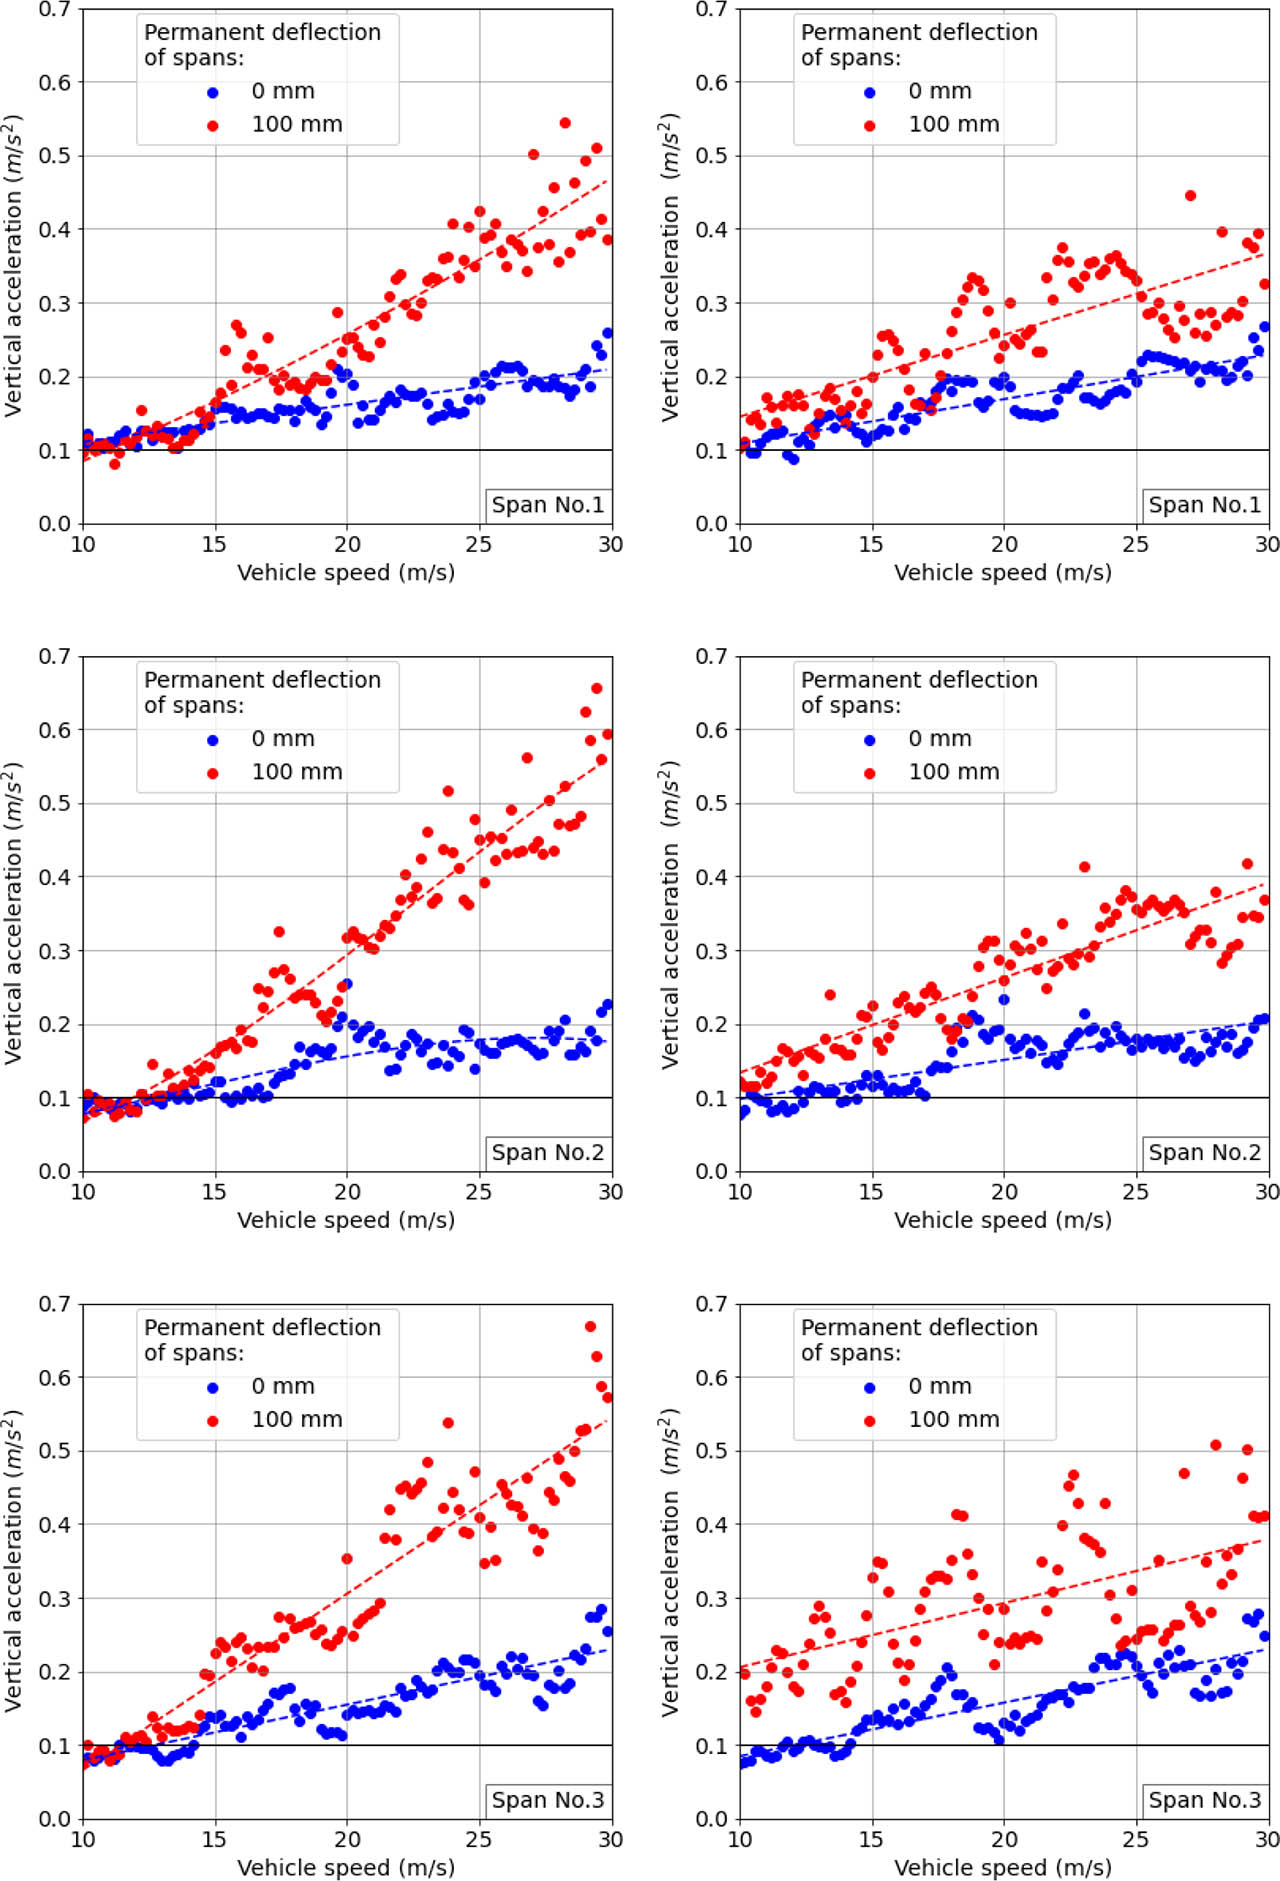
Figure 19
The maximum vibration accelerations of the cross section located in the middle of spans 1–3 as a function of the vehicle speed and the value of permanent deflections (0 and 100 mm, respectively): Model A (elastic suspension; left), Model B (rigid suspension; right).
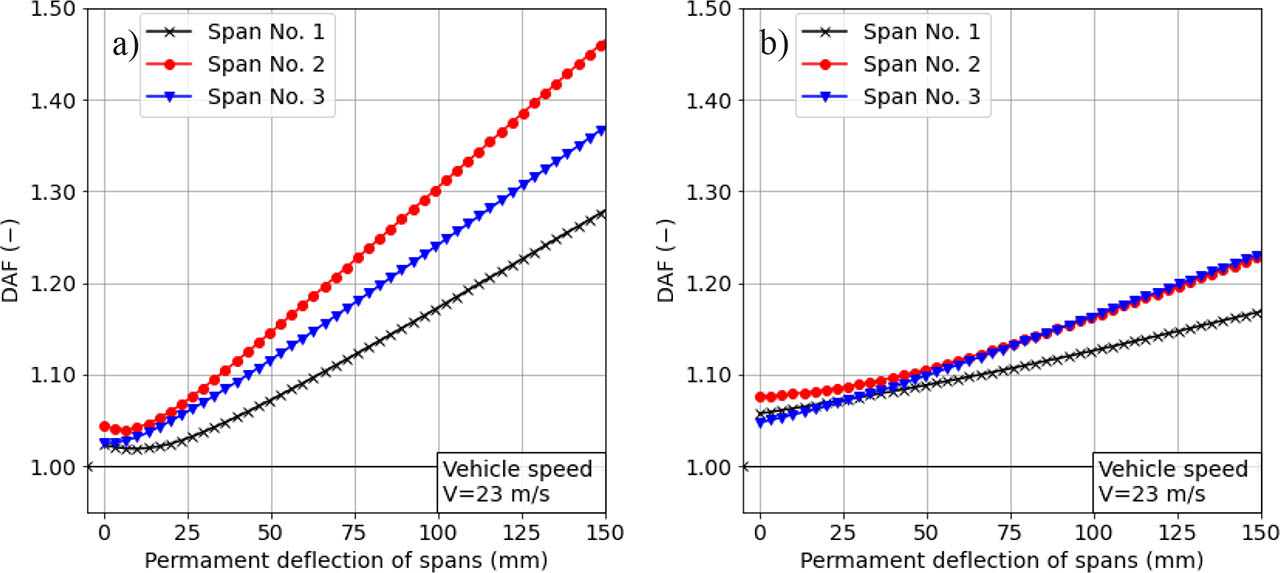
Figure 20
Changes in the DAF imposed by the passage of the vehicle (which were read in the cross sections located in the middle of spans 1–3) as a function of the value of the permanent deflections of the spans and the determined value of the vehicle speed equal to 23 m/s: (a) Model A (elastic suspension), (b) Model B (rigid suspension).