
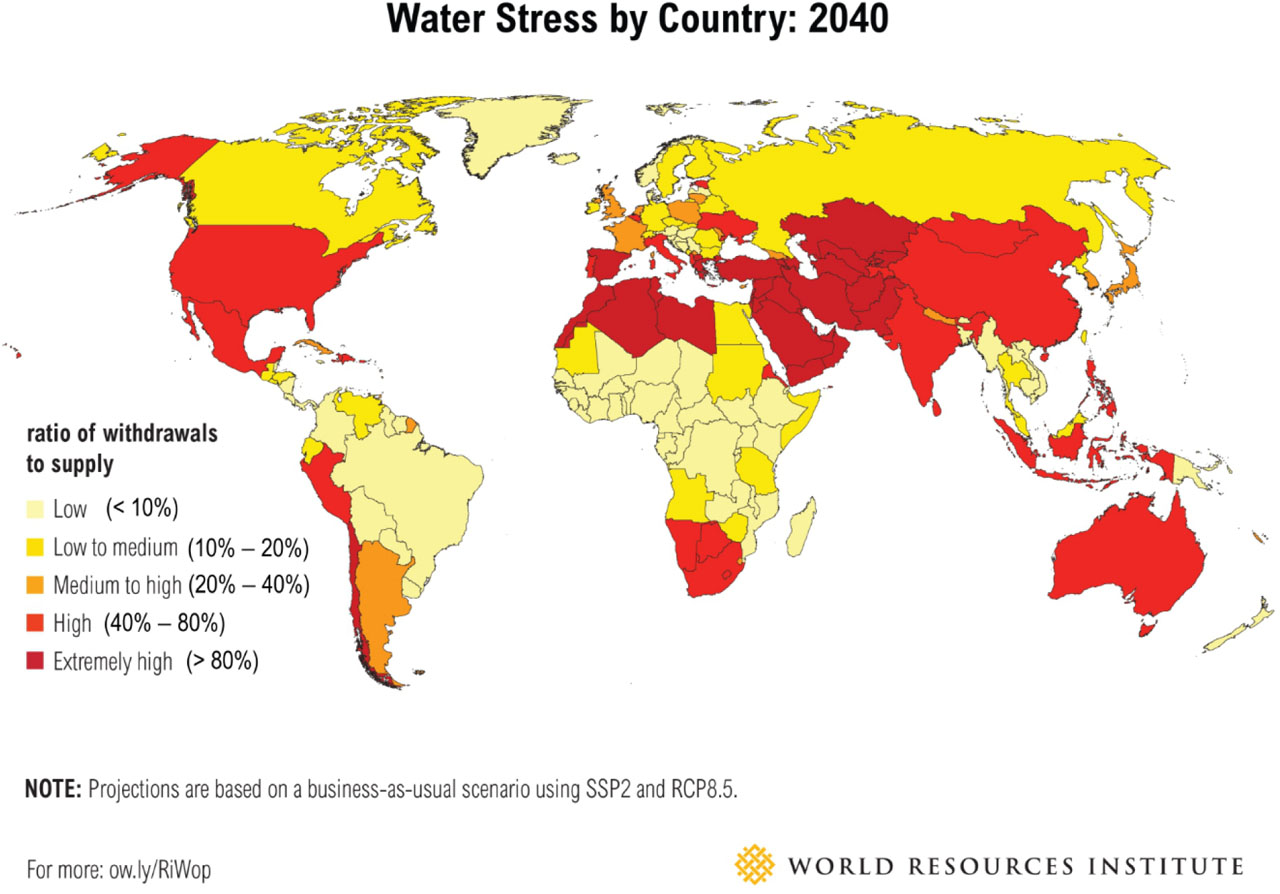
Figure 1
Predicted water stress in the world by 2040 according to WRI.
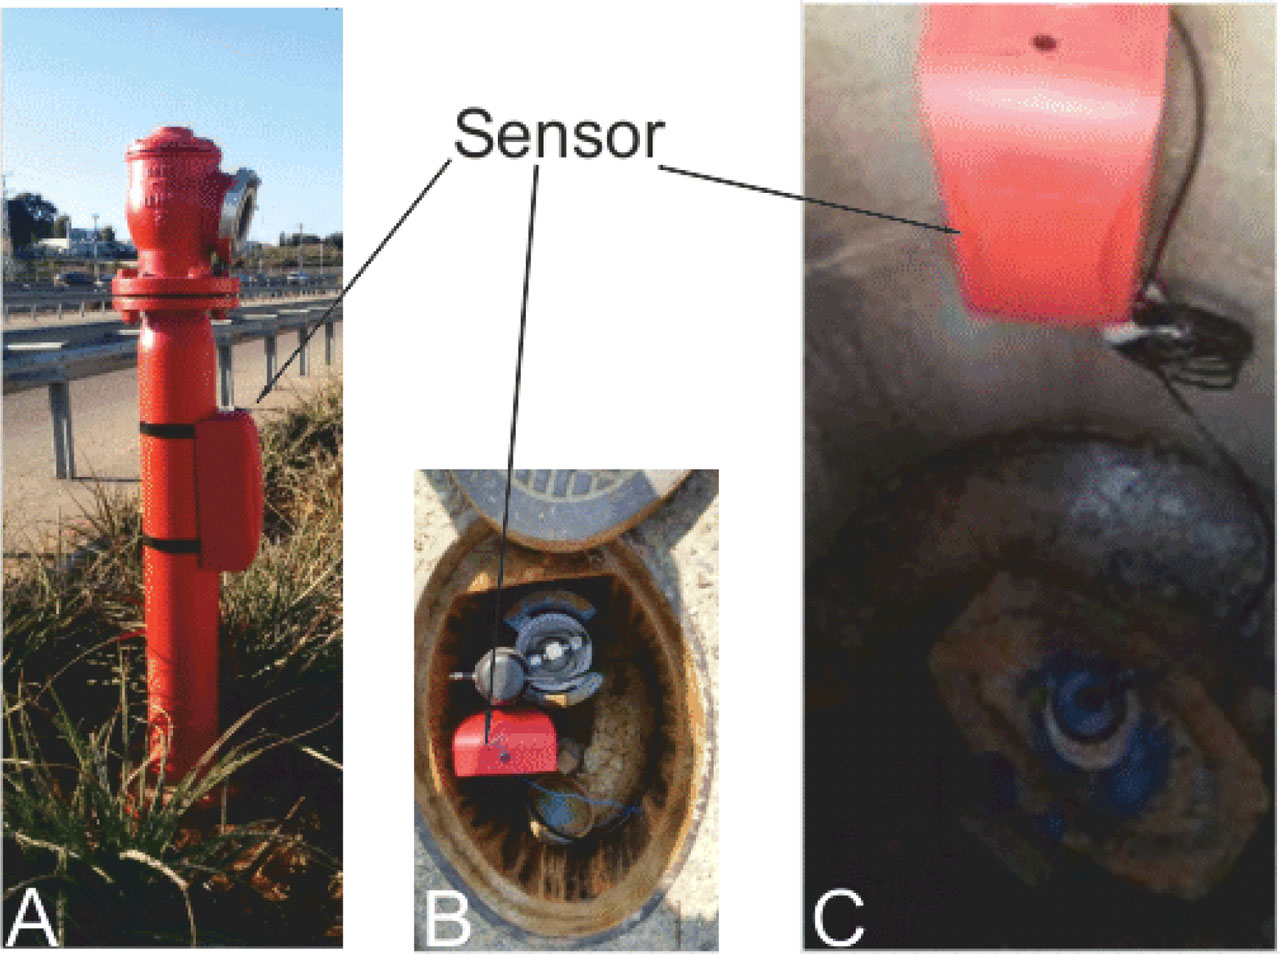
Figure 2
Methods of installing a stationary sensor: (A) on an above-ground hydrant, (B) on an underground hydrant, (C) in the gate valve chamber
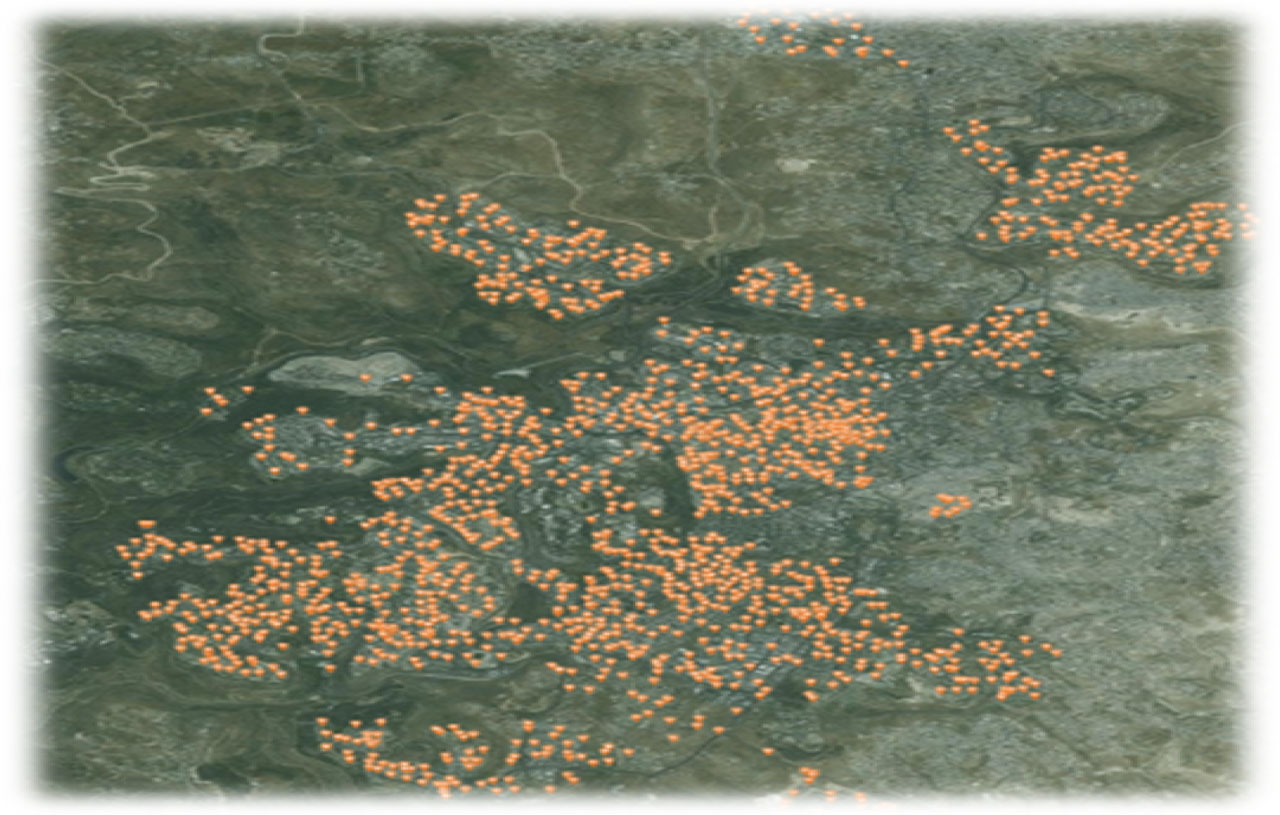
Figure 3
Location of acoustic sensors on the map (water supply network) of Jerusalem (1600 sensors, 750 km of the network).
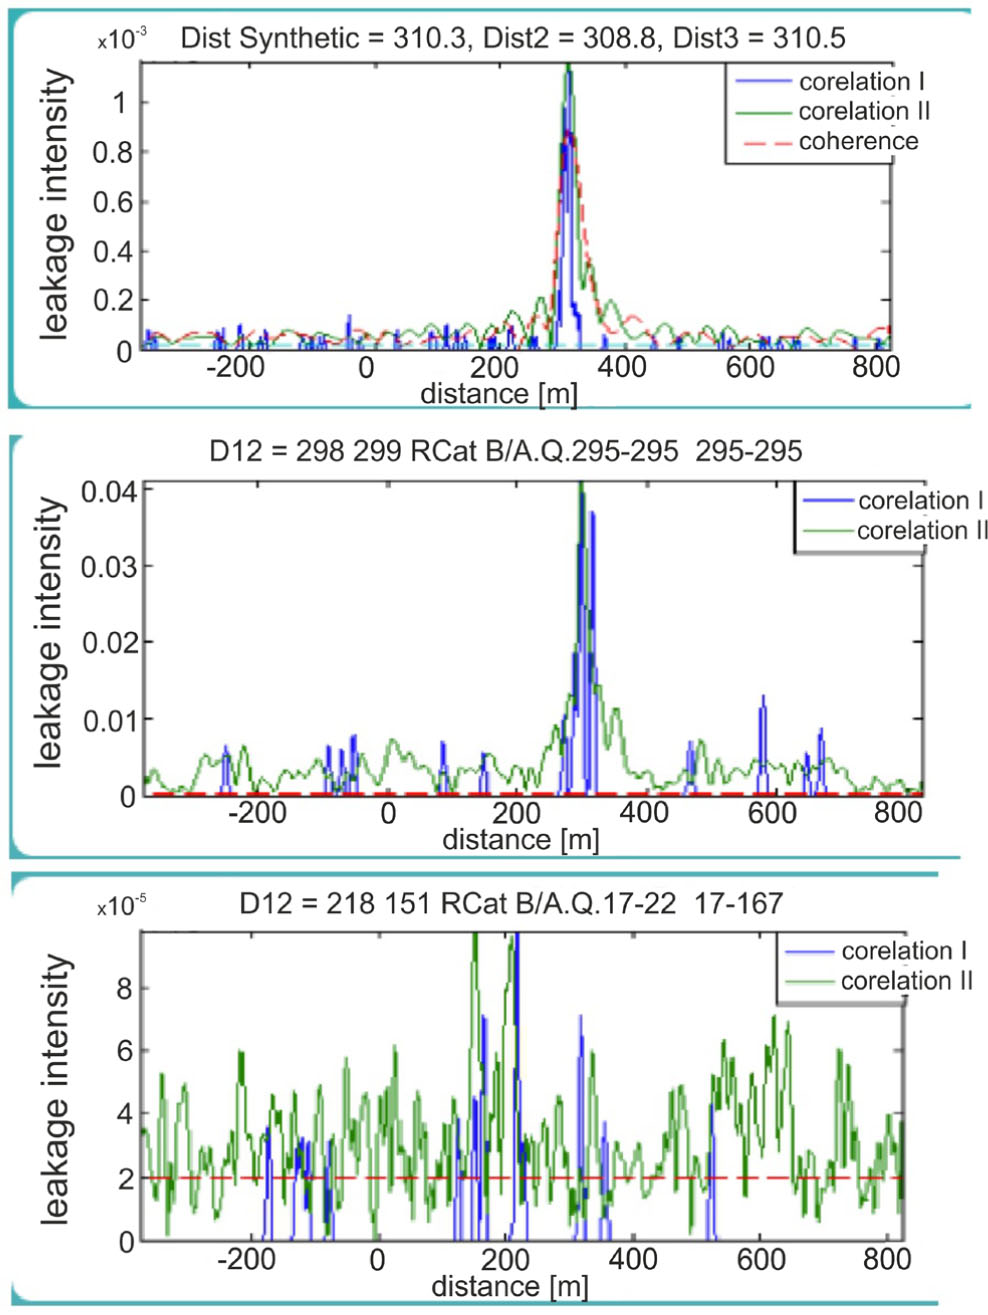
Figure 4
Graphical representation of the correlation of leakages on the tested section of the pipeline in Shamir street.
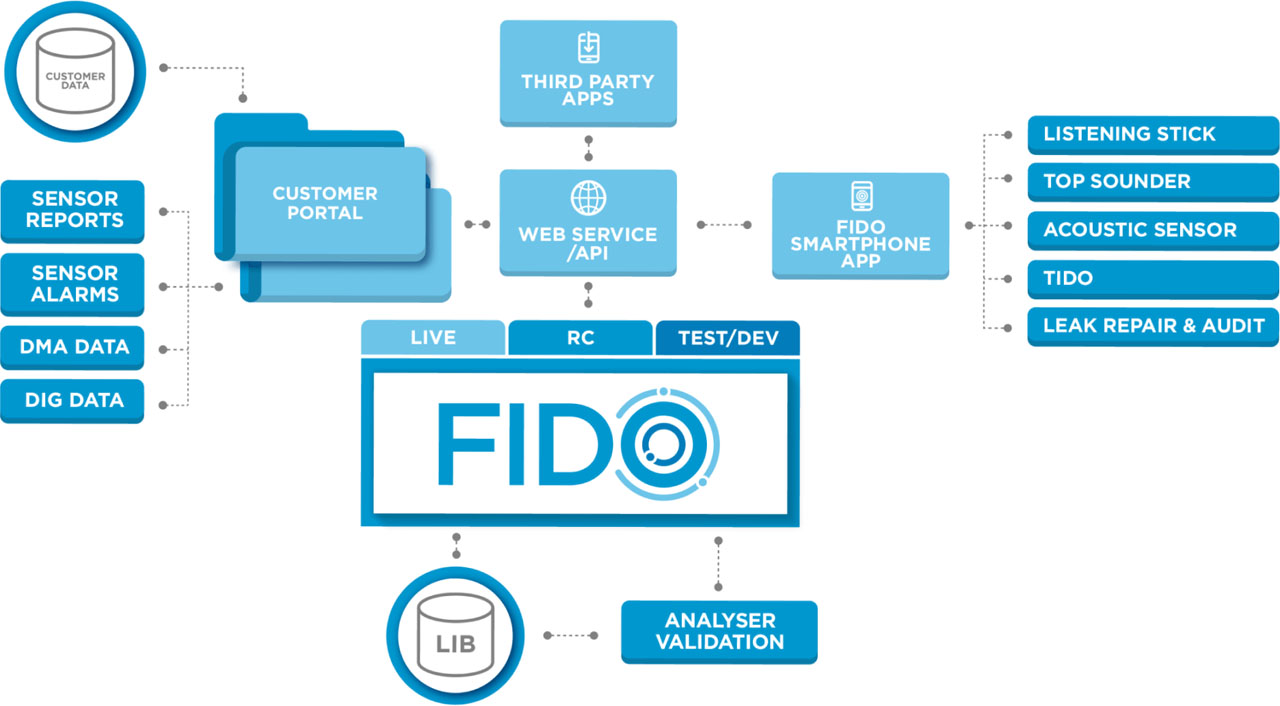
Figure 5
Structure of the FIDO system [Fido-Tech, 2021b].
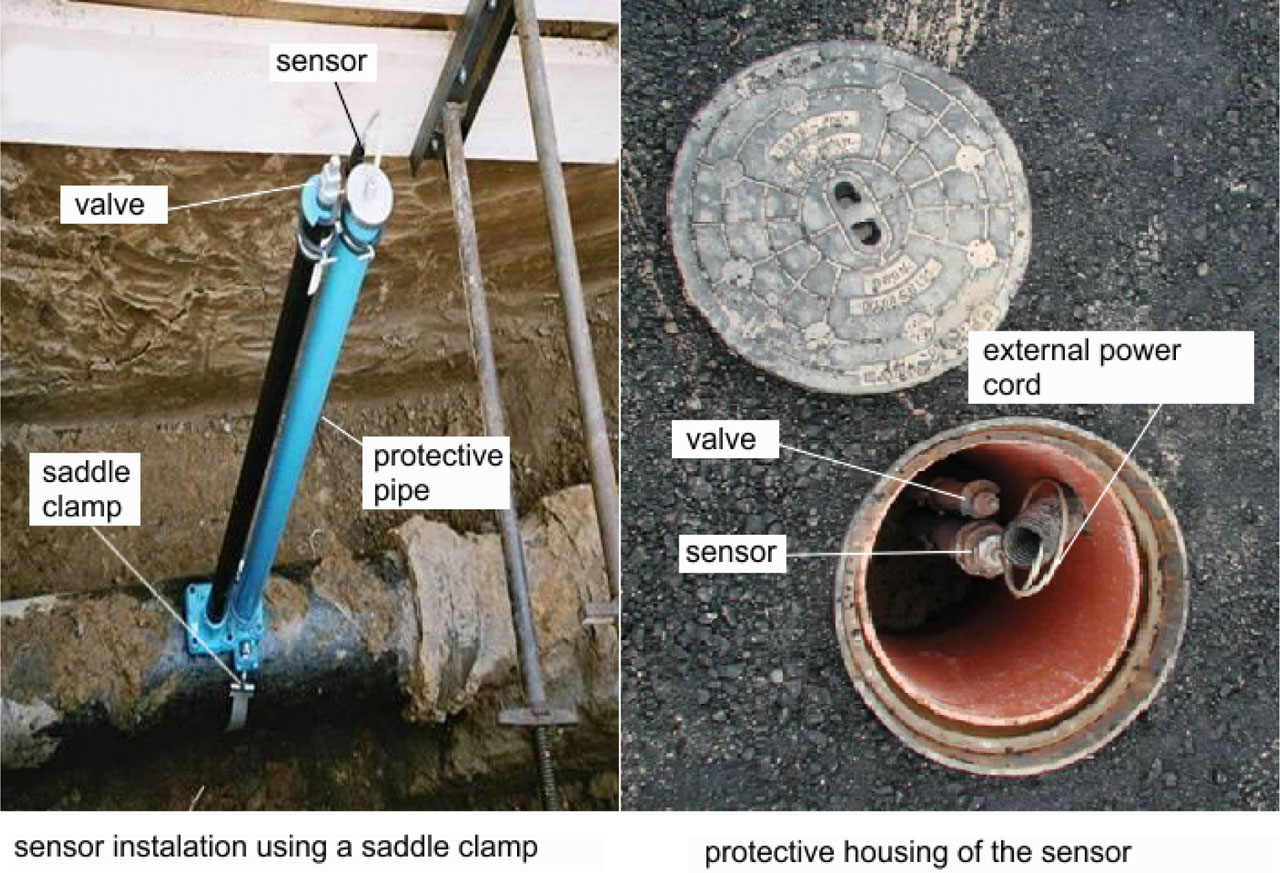
Figure 6
Installation of the WLM sensor.
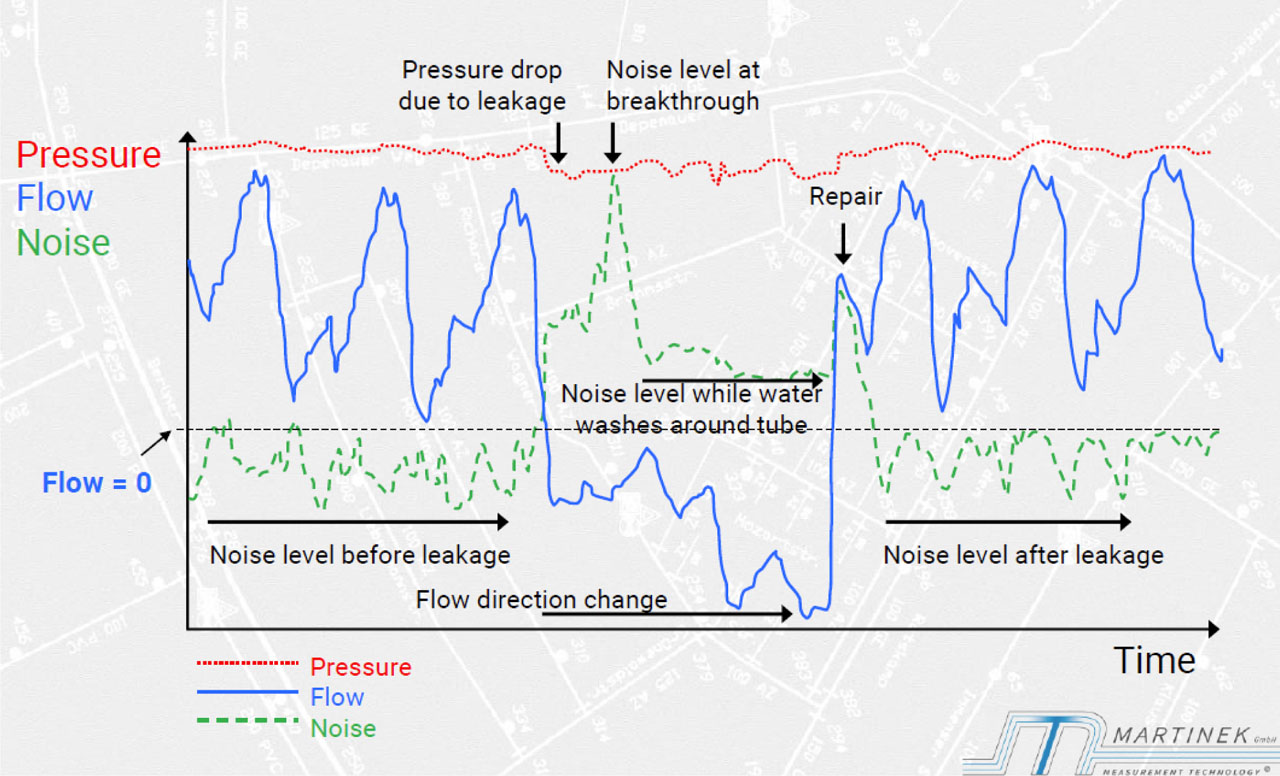
Figure 7
Variability of the tested parameters in the event of a leak – AQUALYS software.
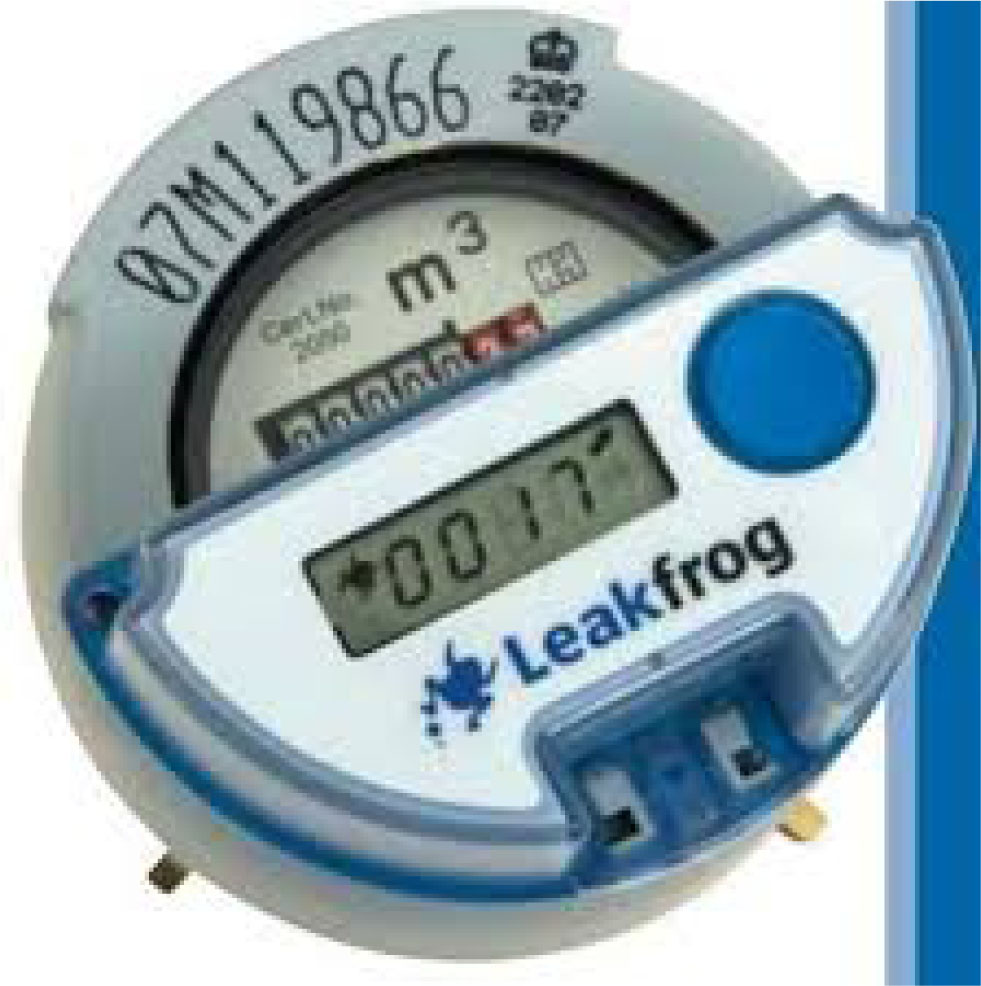
Figure 8
Leakfrog device installed on a water meter.
Table 1
Strengths and weaknesses of the systems.
| Strengths | Weaknesses |
|---|---|
| ASQ-SYS system | |
|
|
| FIDO system | |
|
|
| WLM system | |
|
|
| PermaNET system | |
|
|
| SmartFlow system | |
|
|