
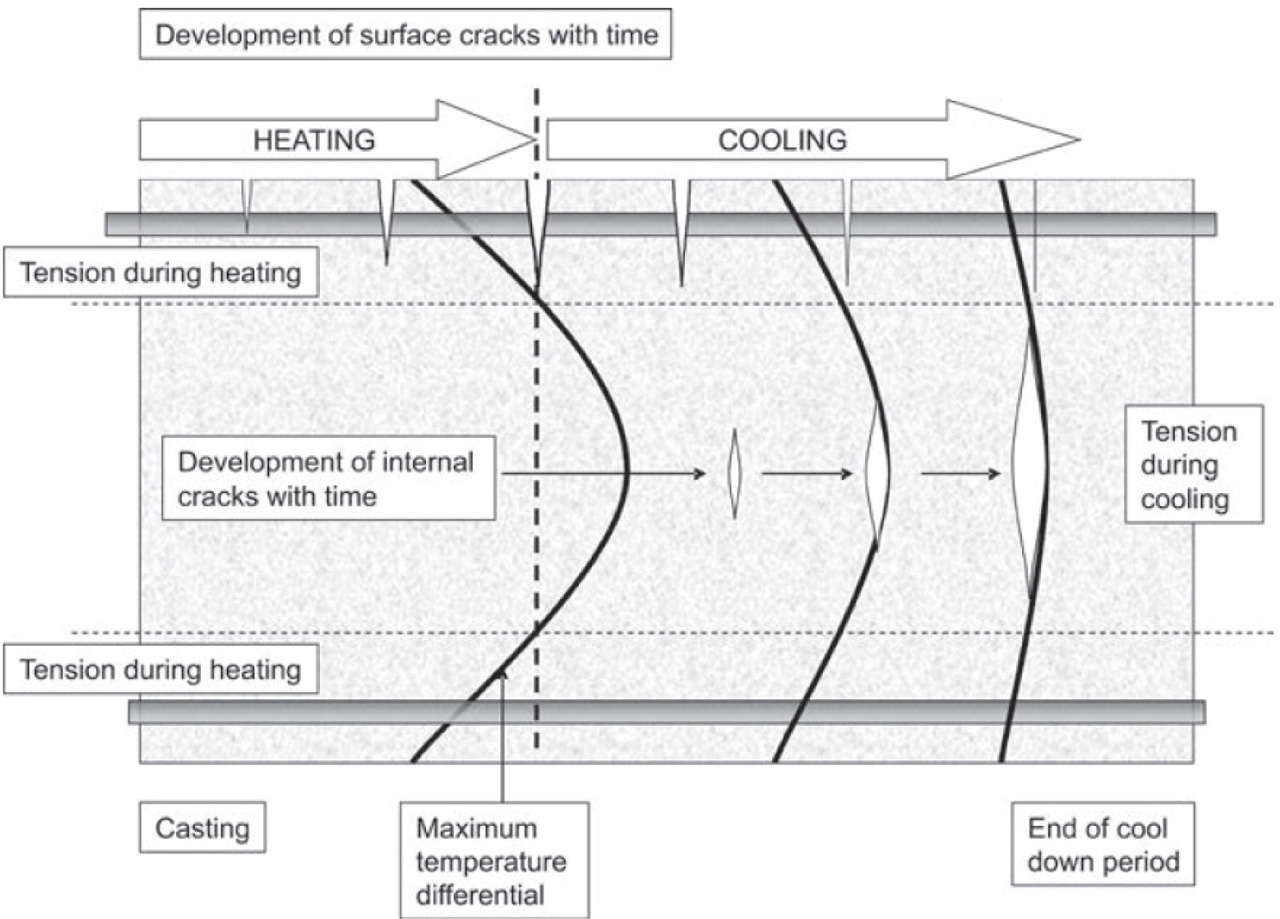
Figure 1
Thermal cracking development in time (Bamforth, 2007, 2018).
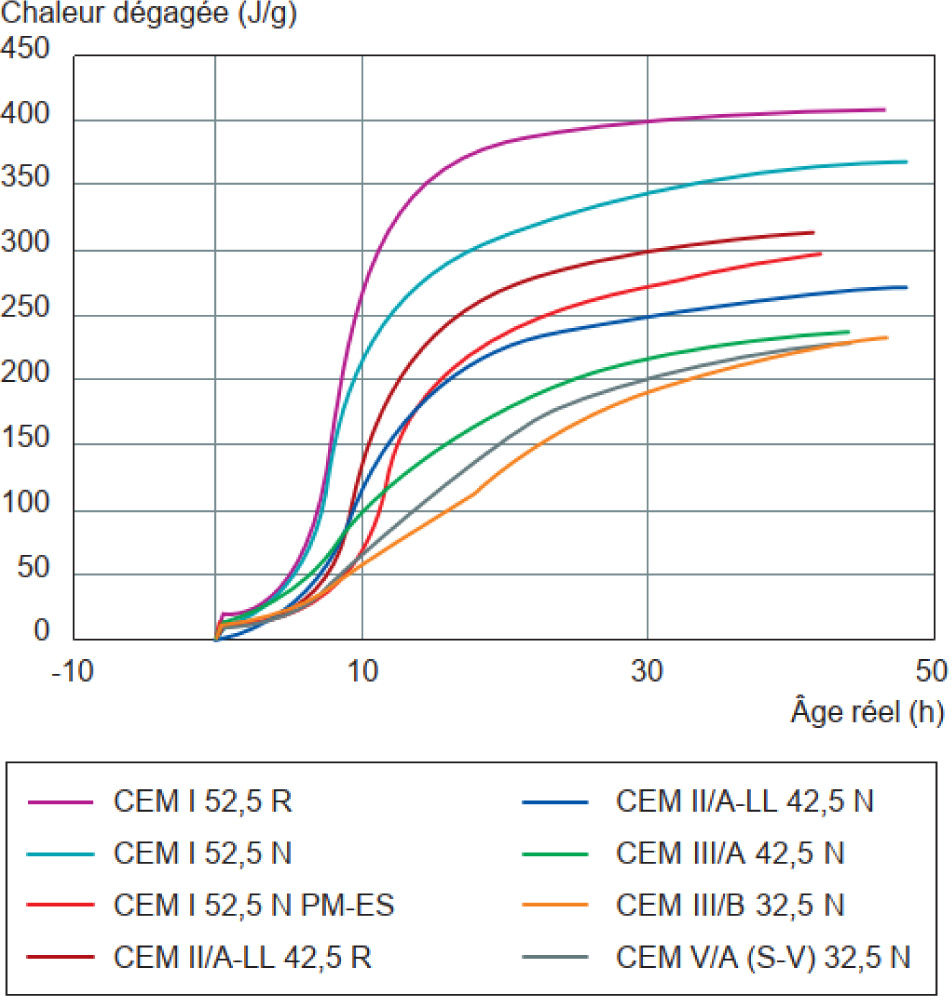
Figure 2
Hydration heat development for selected types of cement (LCPC, 2007).
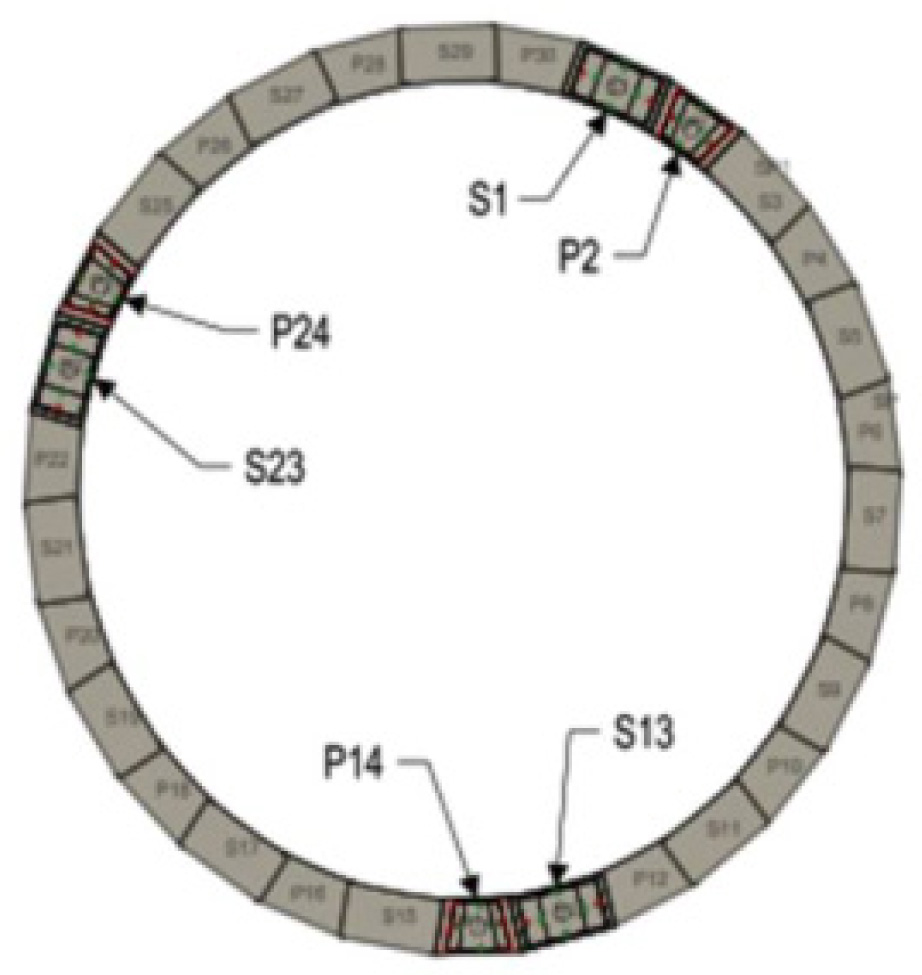
Figure 3
Circular shaft in top view.
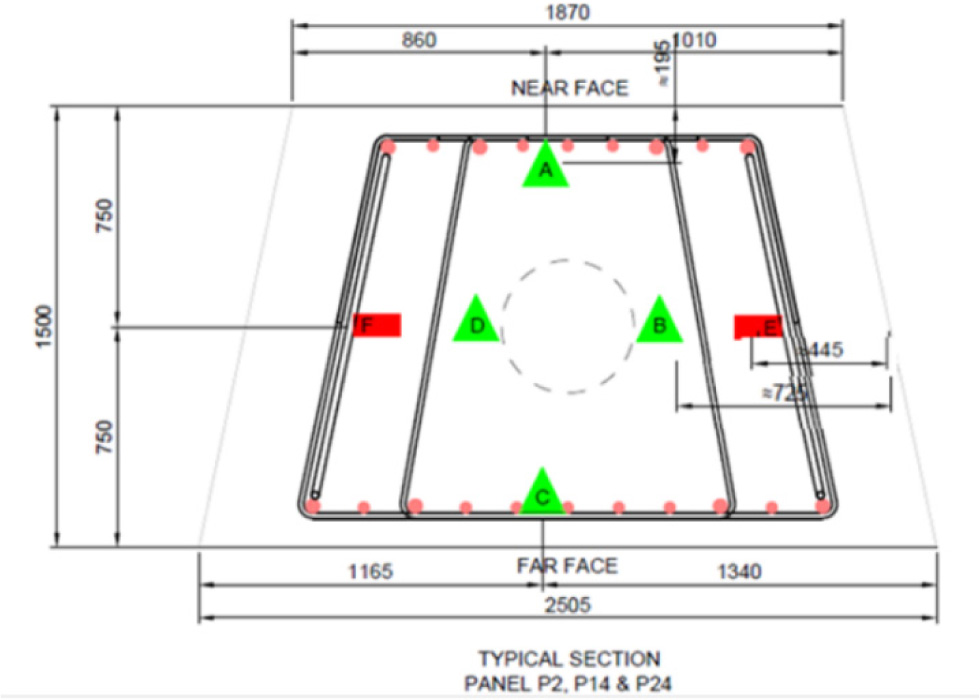
Figure 4
Location of gauges in instrumented panels (Sajadi, 2020).
Table 2
Important timeline events for the instrumented panel P24.
| Panel | Event | Date, time | Time elapsed from the start of concreting (days) |
|---|---|---|---|
| P24 (instrumented) | Excavation start | 23/01/2020, 10:45 | −6 |
| Excavation end | 27/01/2020, 16:45 | −2 | |
| Concreting start | 29/01/2020, 08:22 | 0 | |
| Concreting end | 29/01/2020, 15:45 | 0 | |
| S23 (counter-clockwise side) | Excavation start | 28/02/2020, 08:30 | 30 |
| Excavation end | 04/03/2020, 15:00 | 35 | |
| Concreting start | 06/03/2020, 07:43 | 37 | |
| Concreting end | 06/03/2020, 19:10 | 37 |
Table 3
Concrete properties.
| Parameter | Value | Unit |
|---|---|---|
| Cement content (CEM type I, ASTM compliant) | 150 | kg/m3 |
| Supplementary cementitious material content (GGBS) | 310 | kg/m3 |
| Superplasticisers and retarders | 4.9–5.3 | l/m3 |
| Density, ρ | 2400 | kg/m3 |
| Specific heat, cp | 895 | J/(kg·K) |
[i] GGBS, ground granulated blast furnace slag
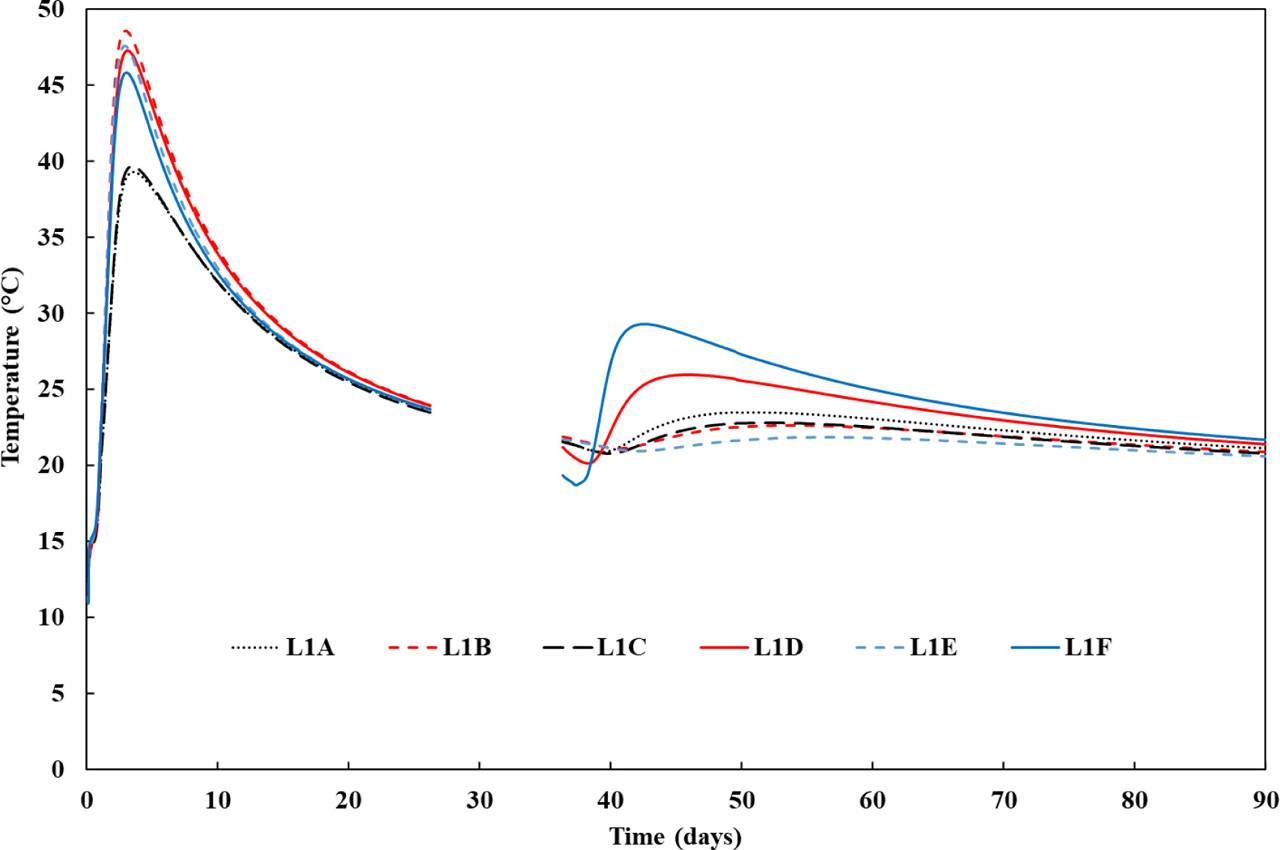
Figure 5
Temperature development in time for L1.
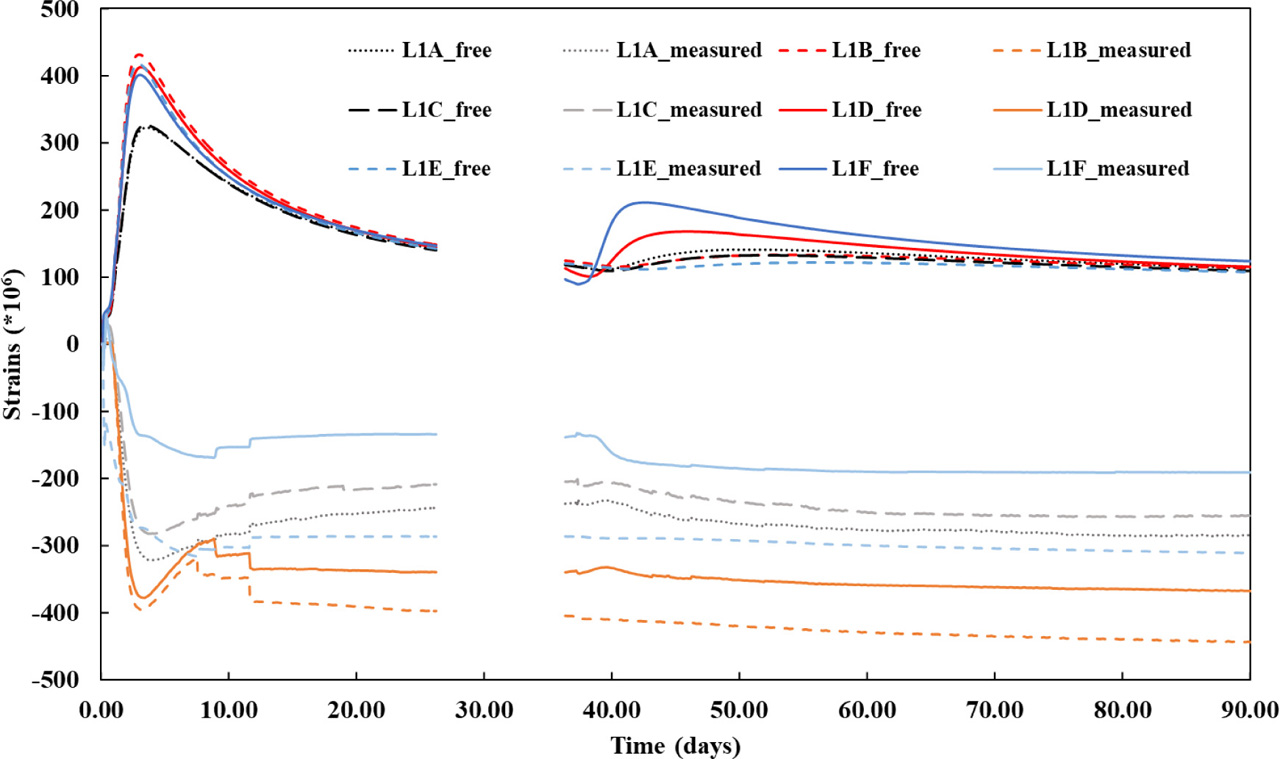
Figure 6
Free thermal strains and measured strains in time for L1.
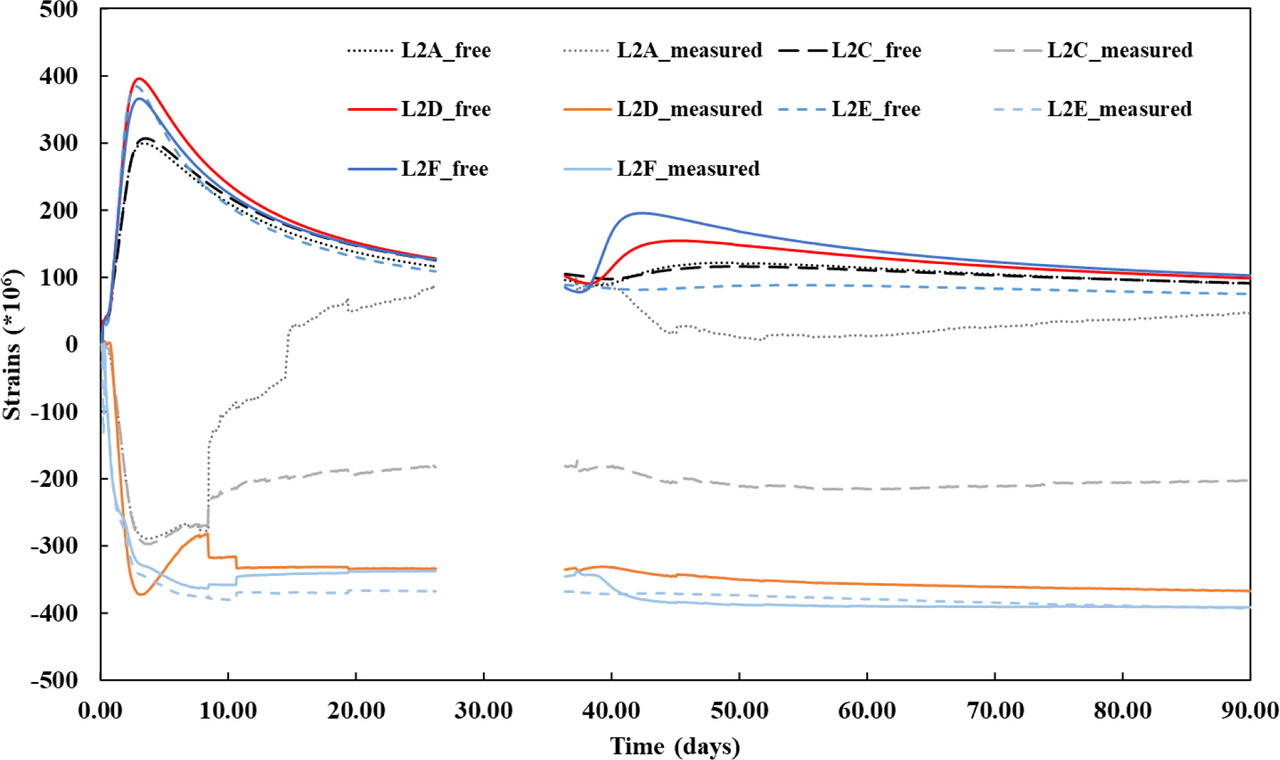
Figure 7
Free thermal strains and measured strains in time for L2.
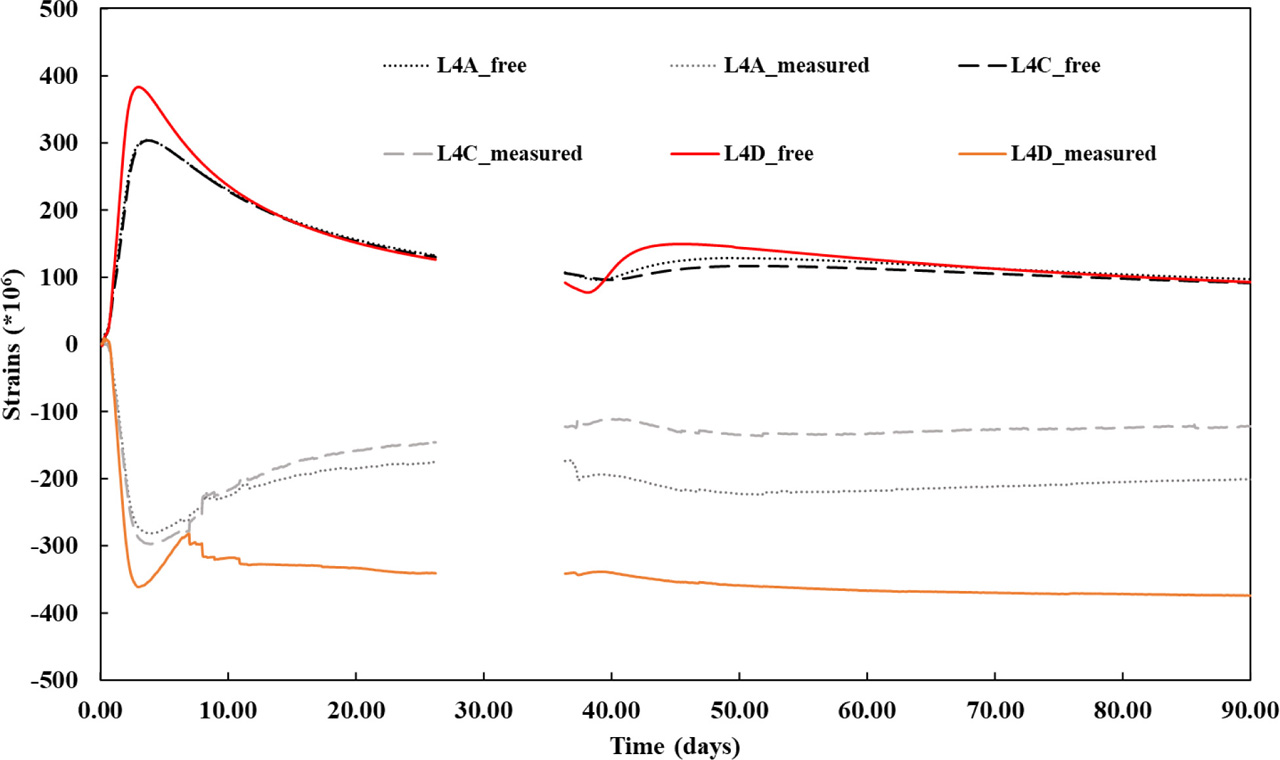
Figure 8
Free thermal strains and measured strains in time for L4.
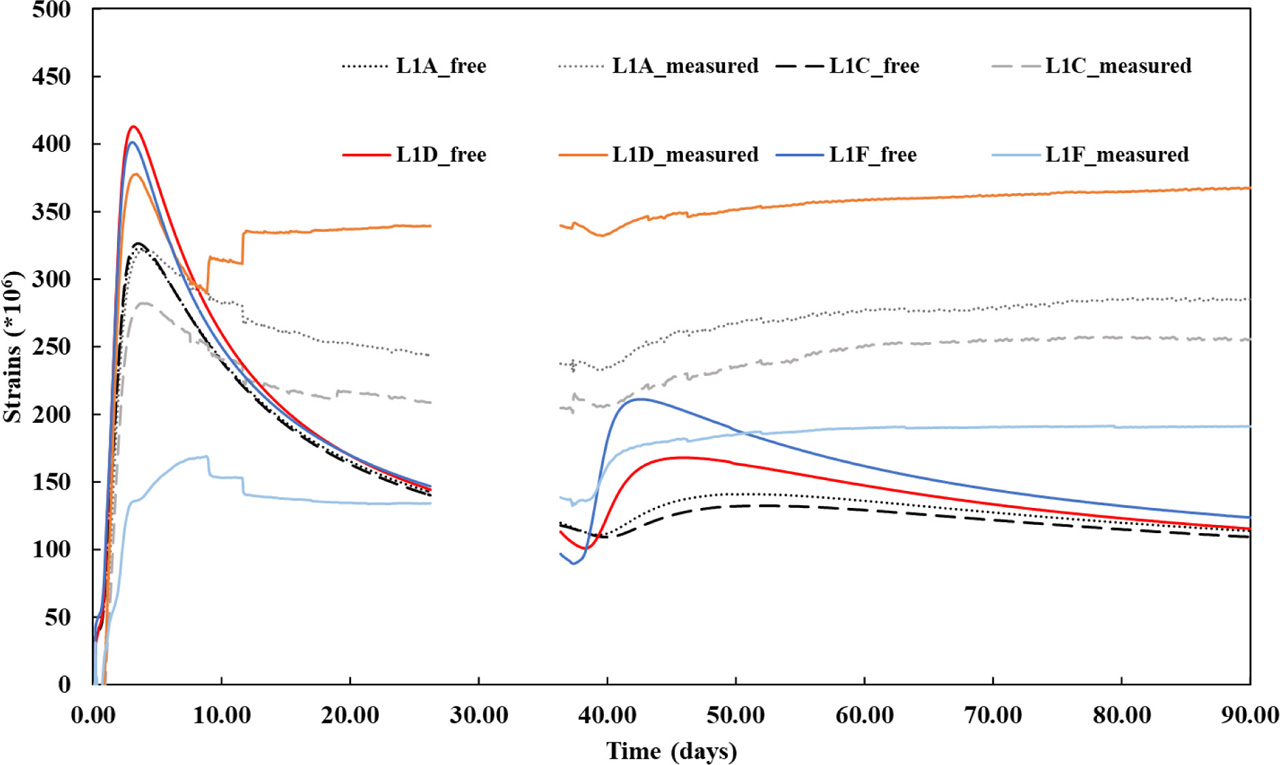
Figure 9
Absolute values of recorded strains and free thermal strains in time for L1.