
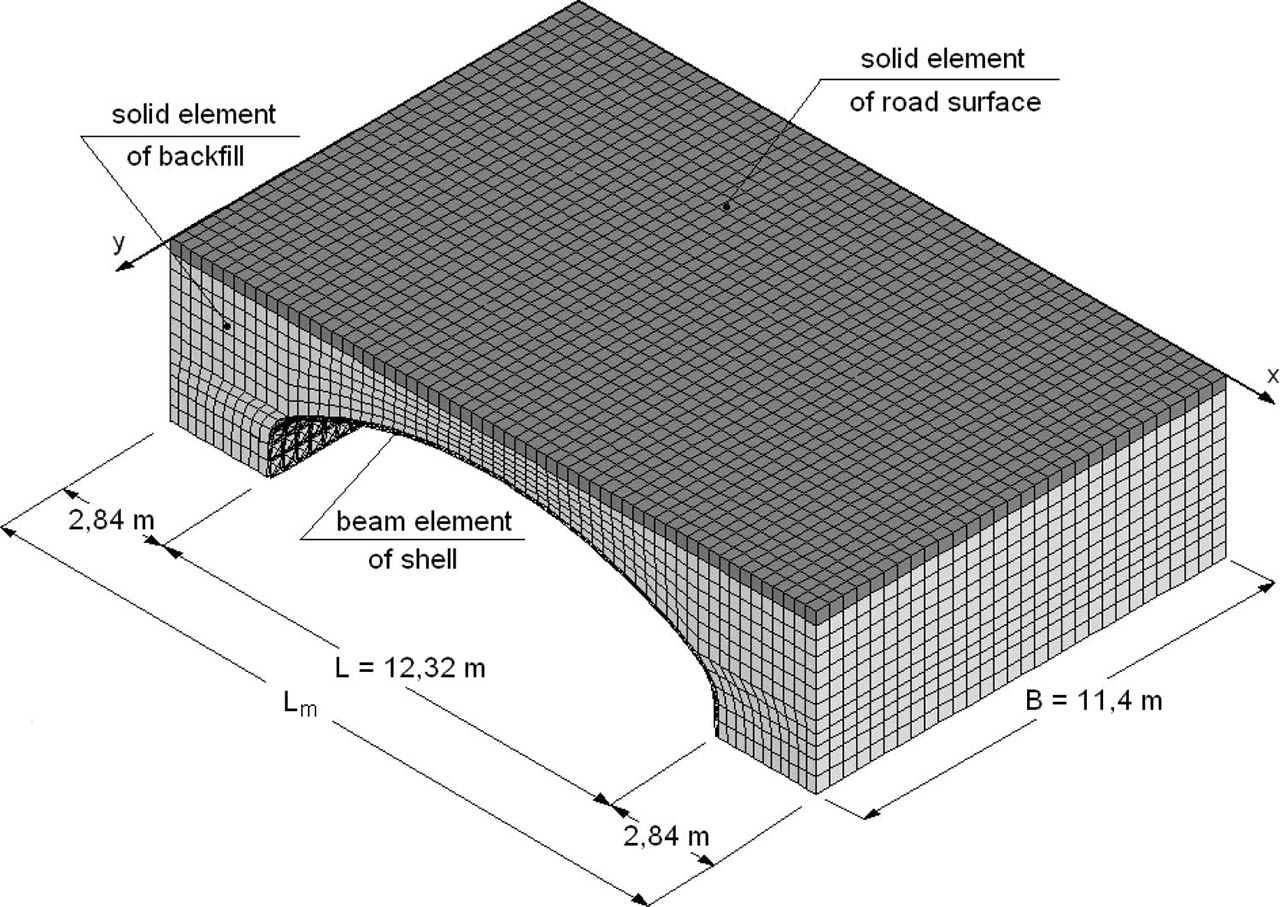
Figure 1
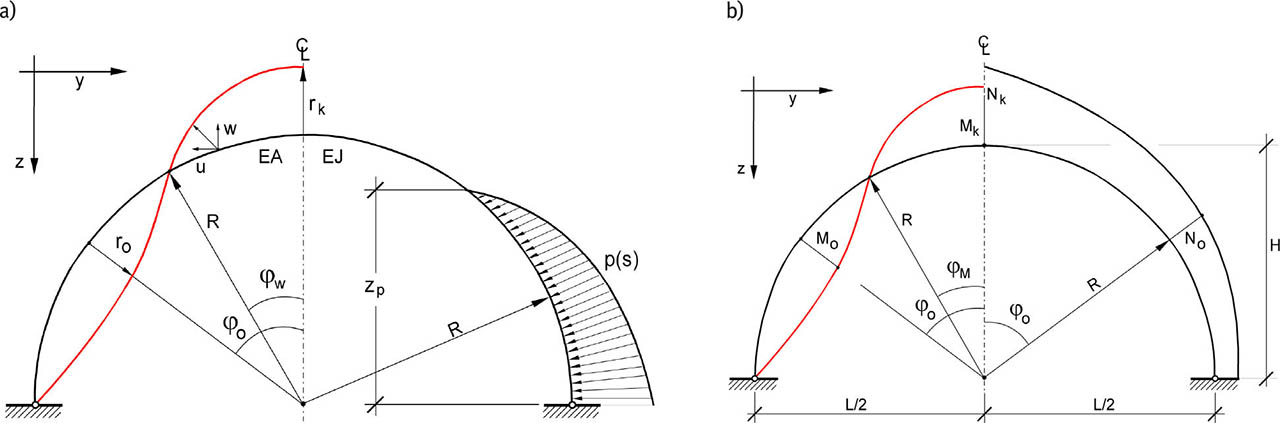
Figure 2
Scheme of the soil interaction with internal forces due to the deformation of the circumferential band of the shell.
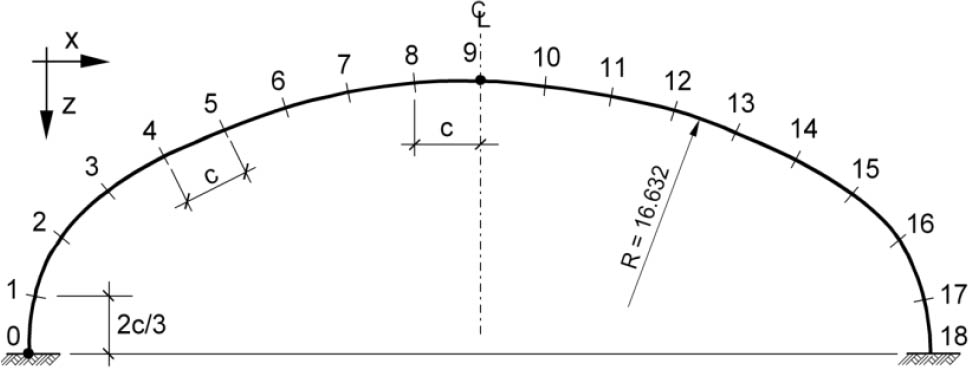
Figure 3
Division into elements in the circumferential band.
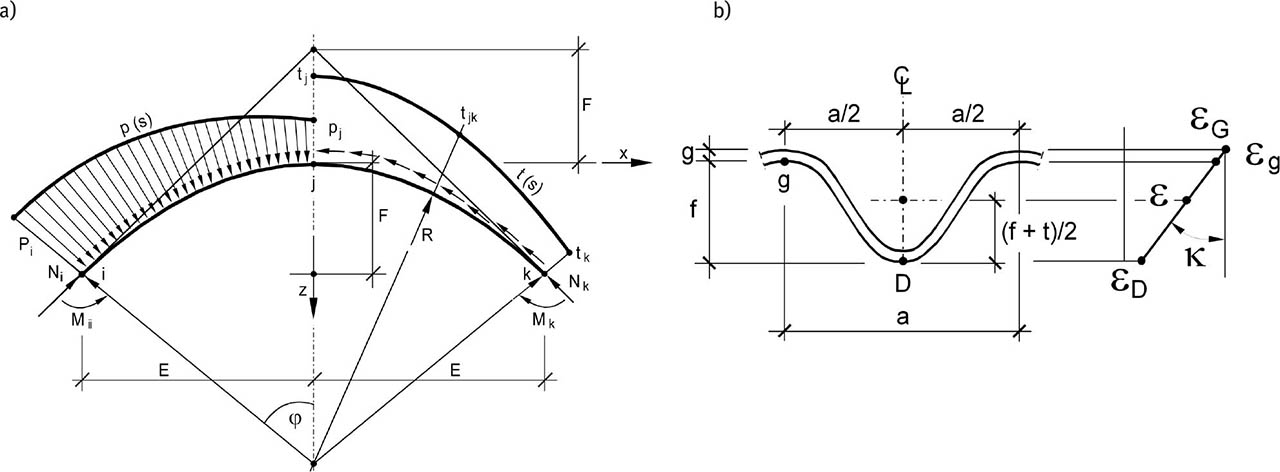
Figure 4
Distribution of contact forces between the subsystems and also the R3 measuring base of the shell.
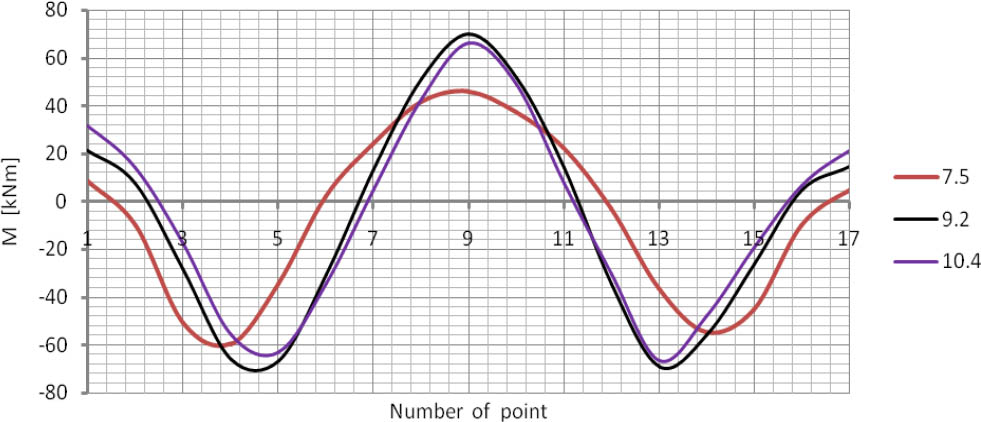
Figure 5
Diagrams of bending moments with regards to the backfill thickness zg.
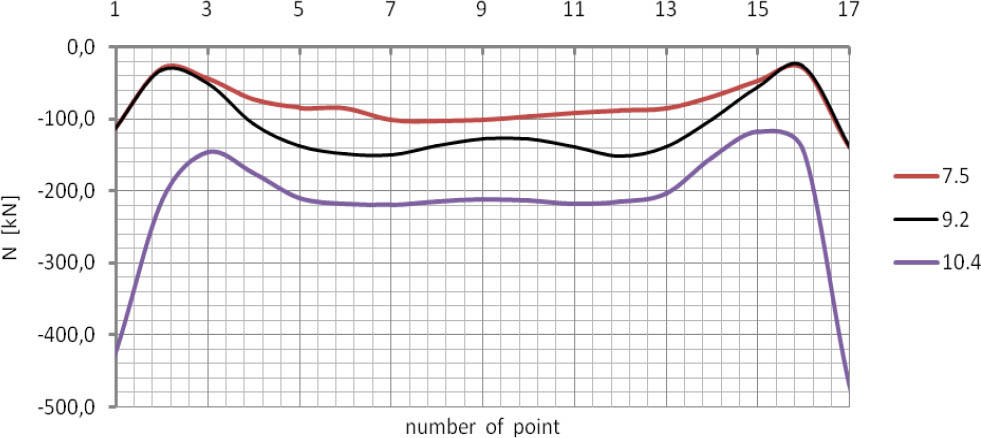
Figure 6
Diagrams of axial forces with regards to the backfill thickness zg.
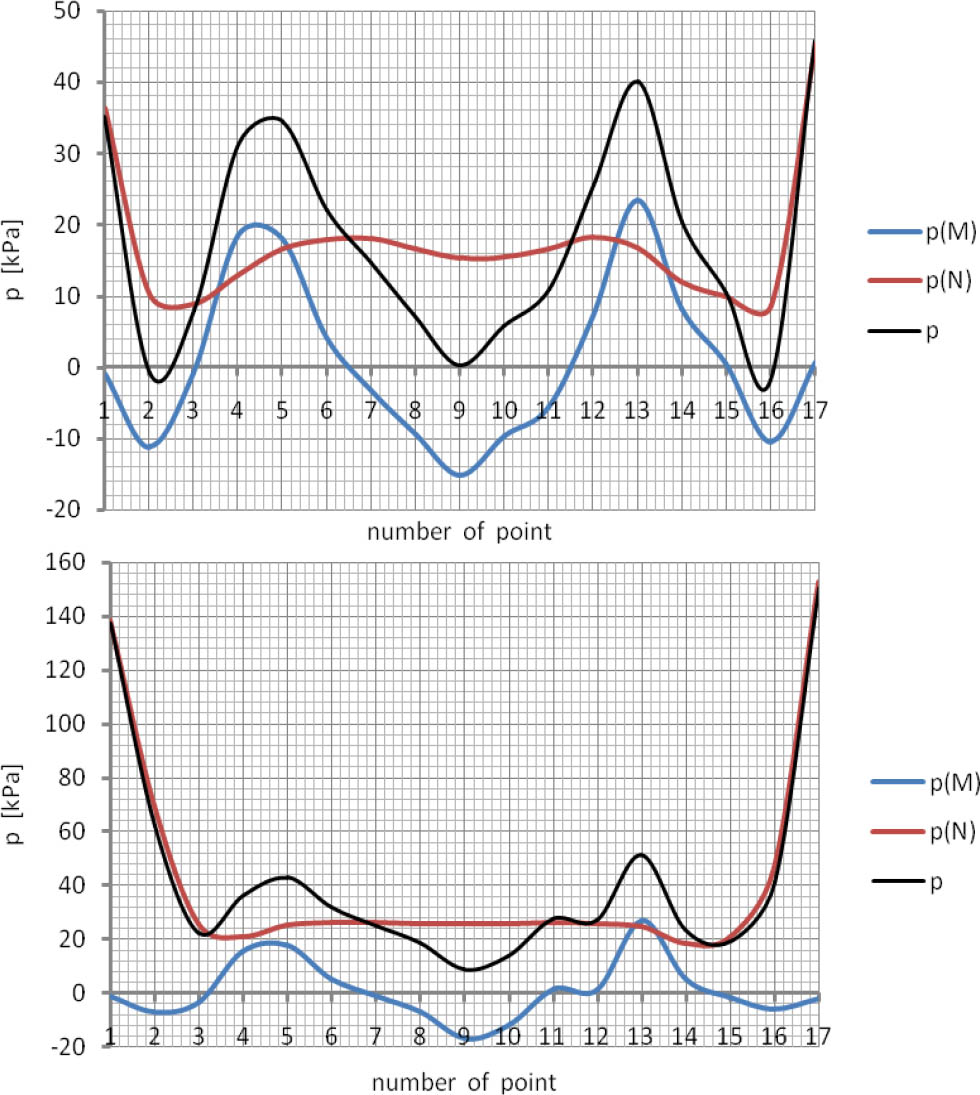
Figure 7
Comparison of the impact of bending and axial forces on soil pressure.
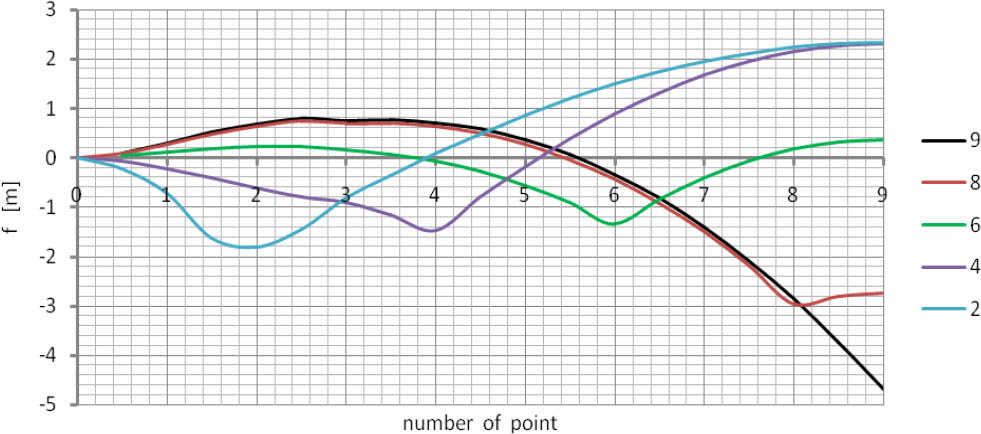
Figure 8
Functions of the influence of bending moments for the analysed shell’s points.
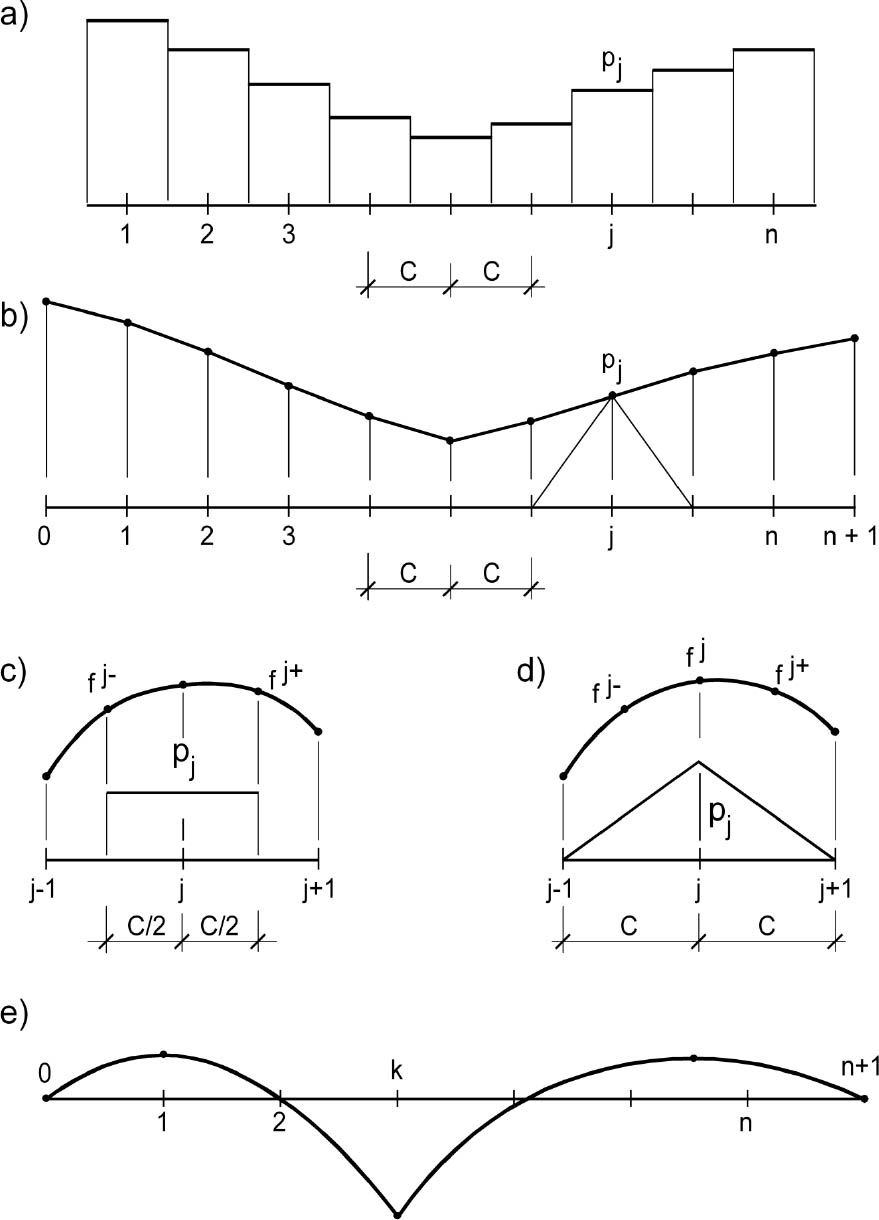
Figure 9
Calculation diagrams of the normal interaction function.
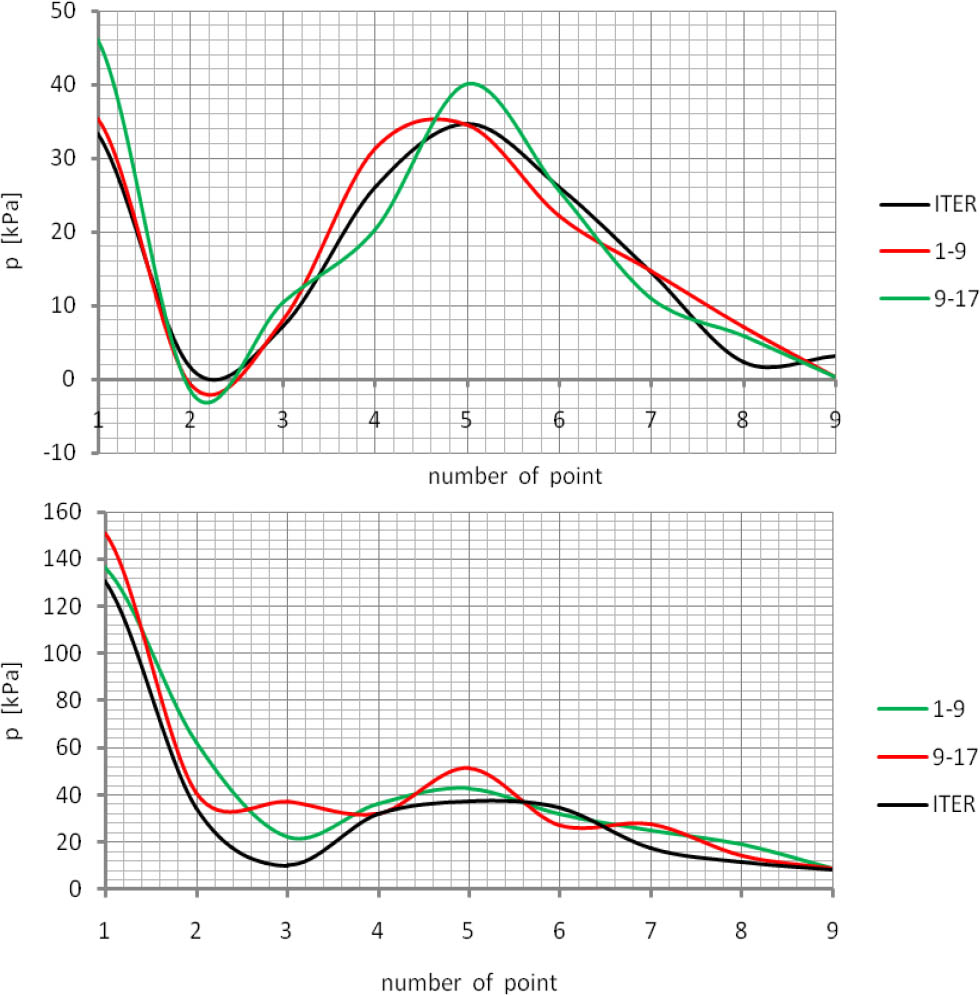
Figure 10
Intensity of normal interaction in the contact layer.
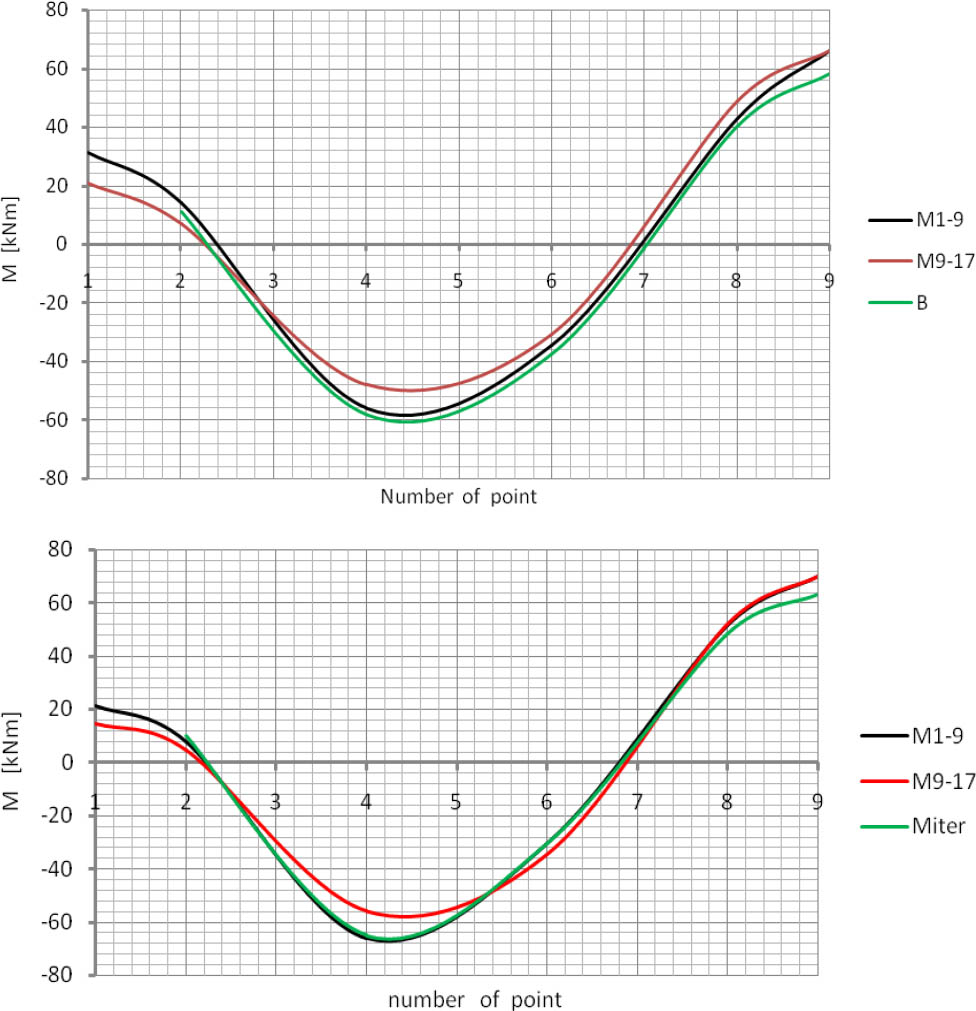
Figure 11
Comparison of bending moments for the purpose of evaluating effectiveness of the algorithm.
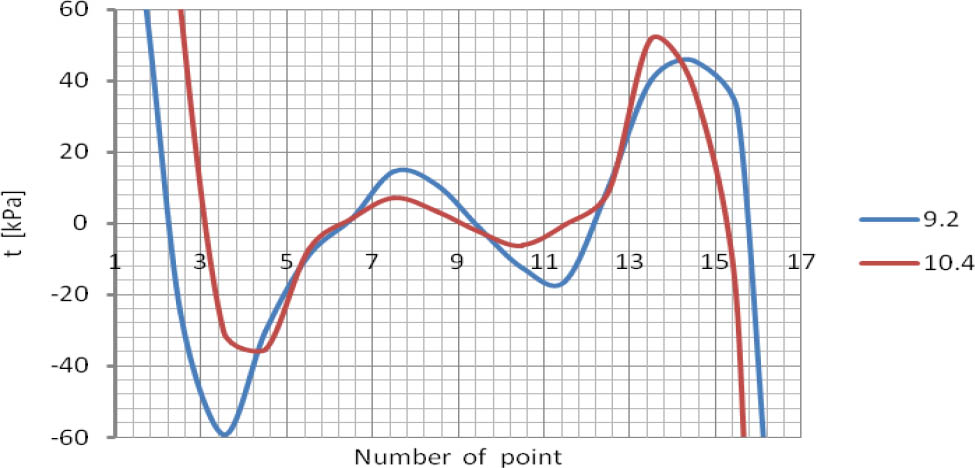
Figure 12
Intensity of the tangential interaction in the contact layer.
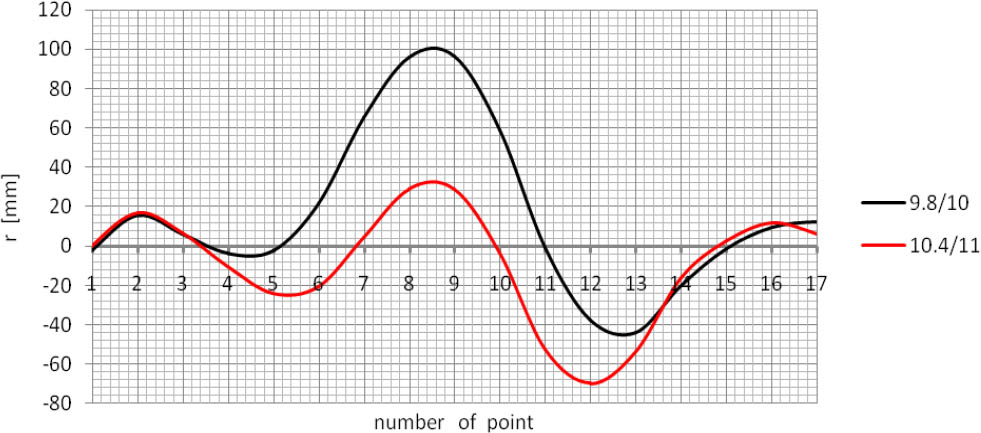
Figure 13
Radial displacements of the shell.
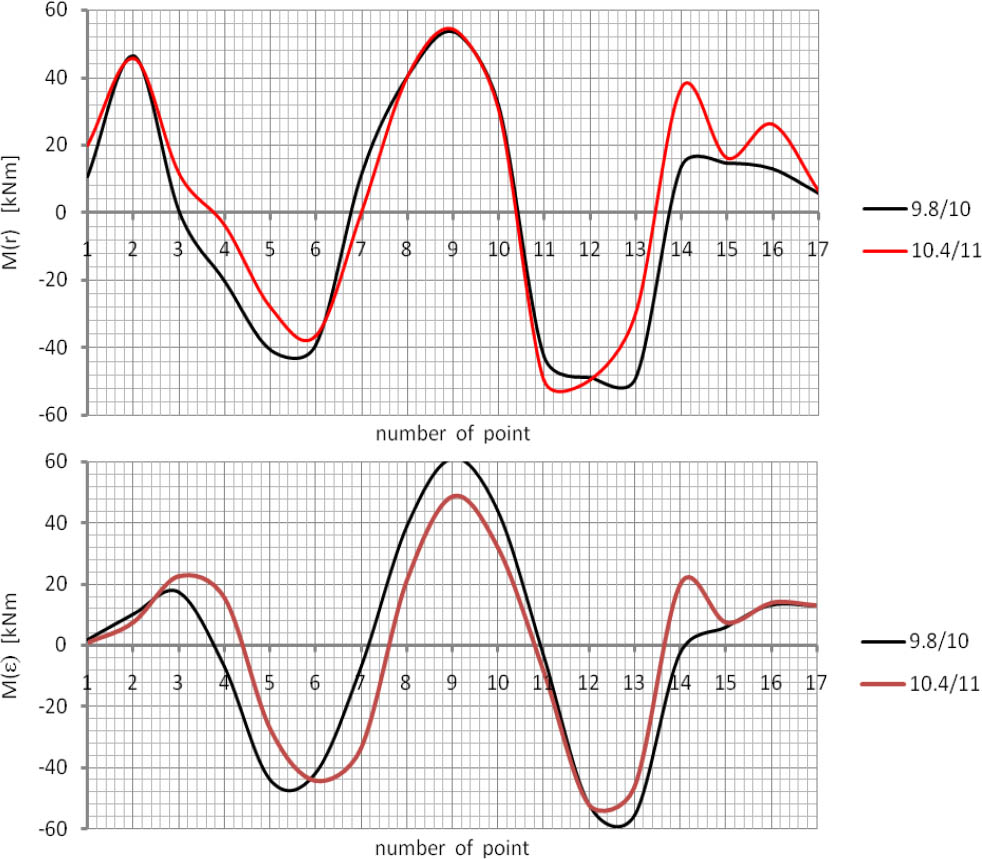
Figure 14
Comparison of the bending moment diagrams.
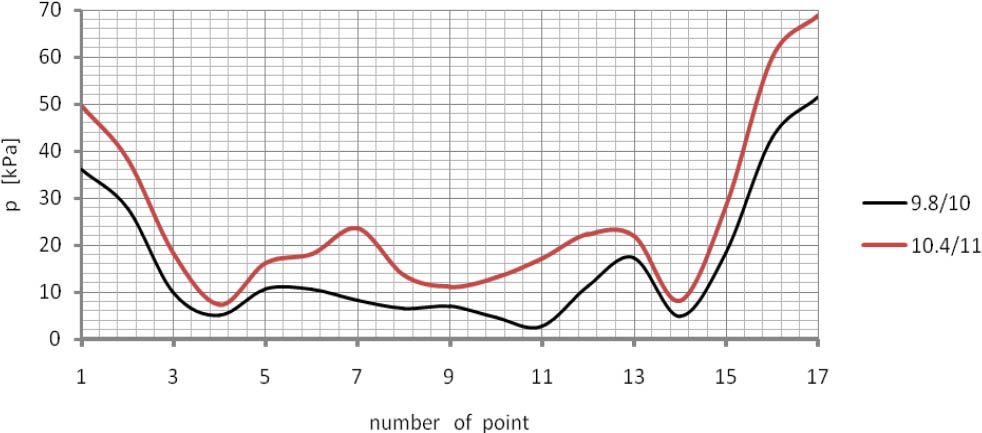
Figure 15
Diagrams of the pressures acting on the shell in the initial phase of construction of the overburden layer.