
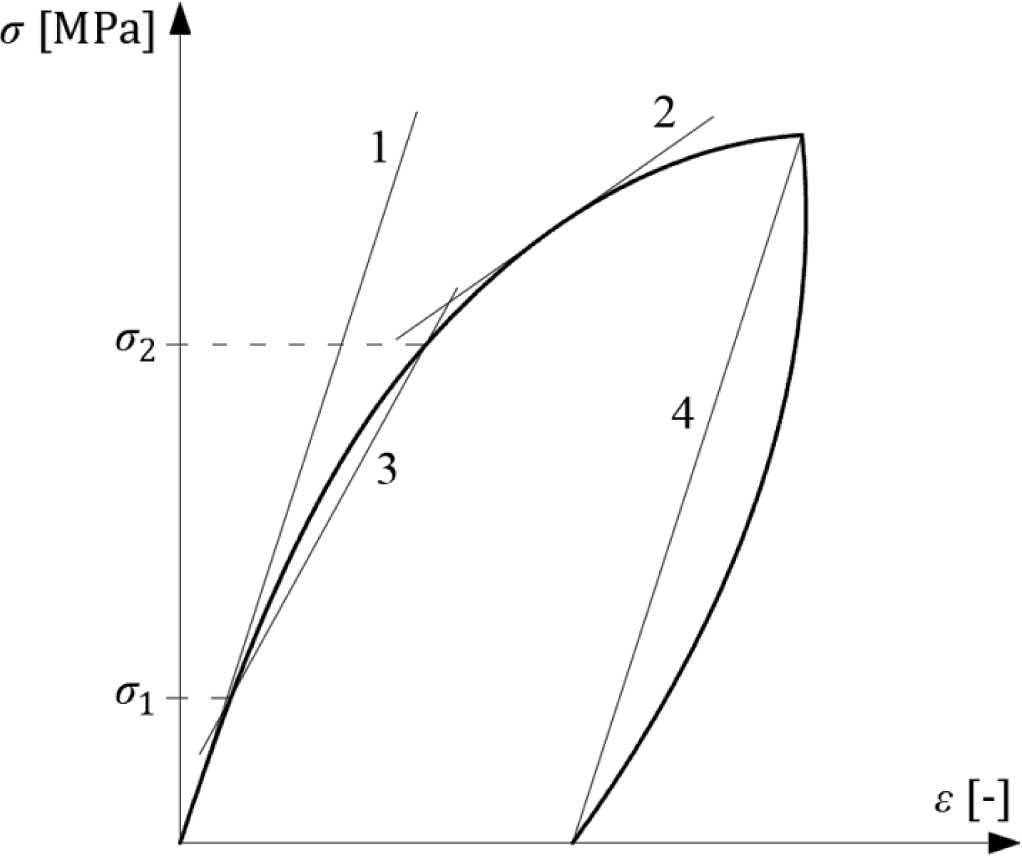
Figure 1
Graphical interpretation of Young's moduli of concrete.
Table 1
Design of concrete mix used to make tested cylindrical specimens.
| No. | Constituent | Mass |
|---|---|---|
| [kg/m3] | ||
| 1 | Cement CEM I 42.5R | 365.0 |
| 2 | Aggregate 2–8 mm | 650.0 |
| 3 | Aggregate 8–16 mm | 560.0 |
| 4 | Sand 0–2 mm | 650.0 |
| 5 | Water | 175.0 |
| 6 | Superplasticizer (1.2% of cement mass) | 4.5 |
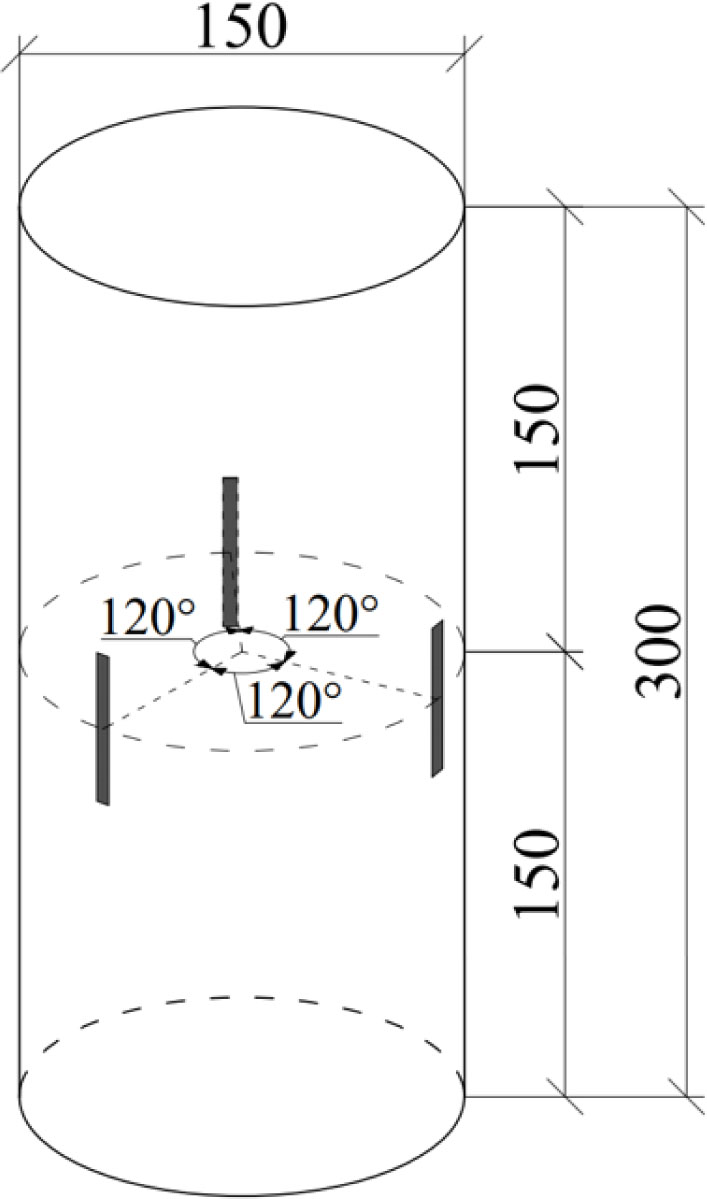
Figure 2
Shape of tested specimens and arrangement of electrical resistance strain gauges.
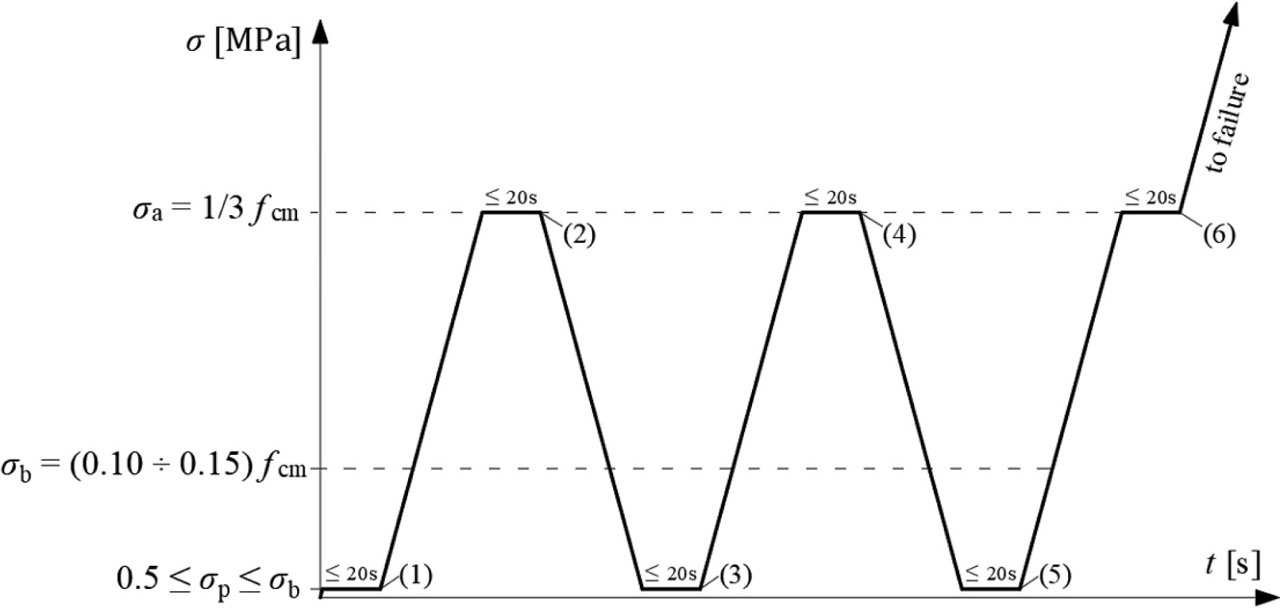
Figure 3
Investigation of stabilized secant elasticity modulus EC,SEC,S of concrete according to method I.
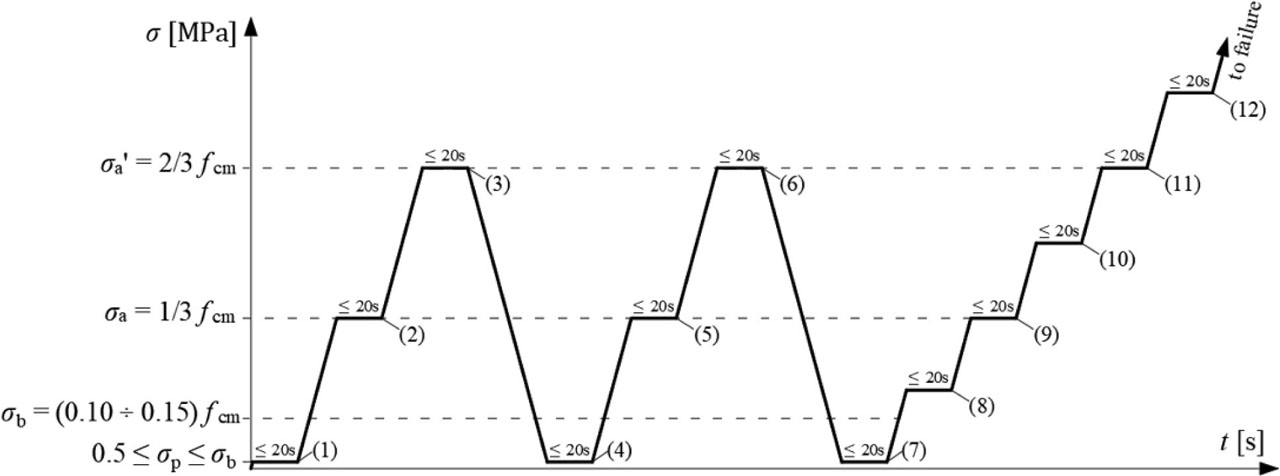
Figure 4
Investigation of stabilized elasticity modulus EC,S of concrete according to method II.
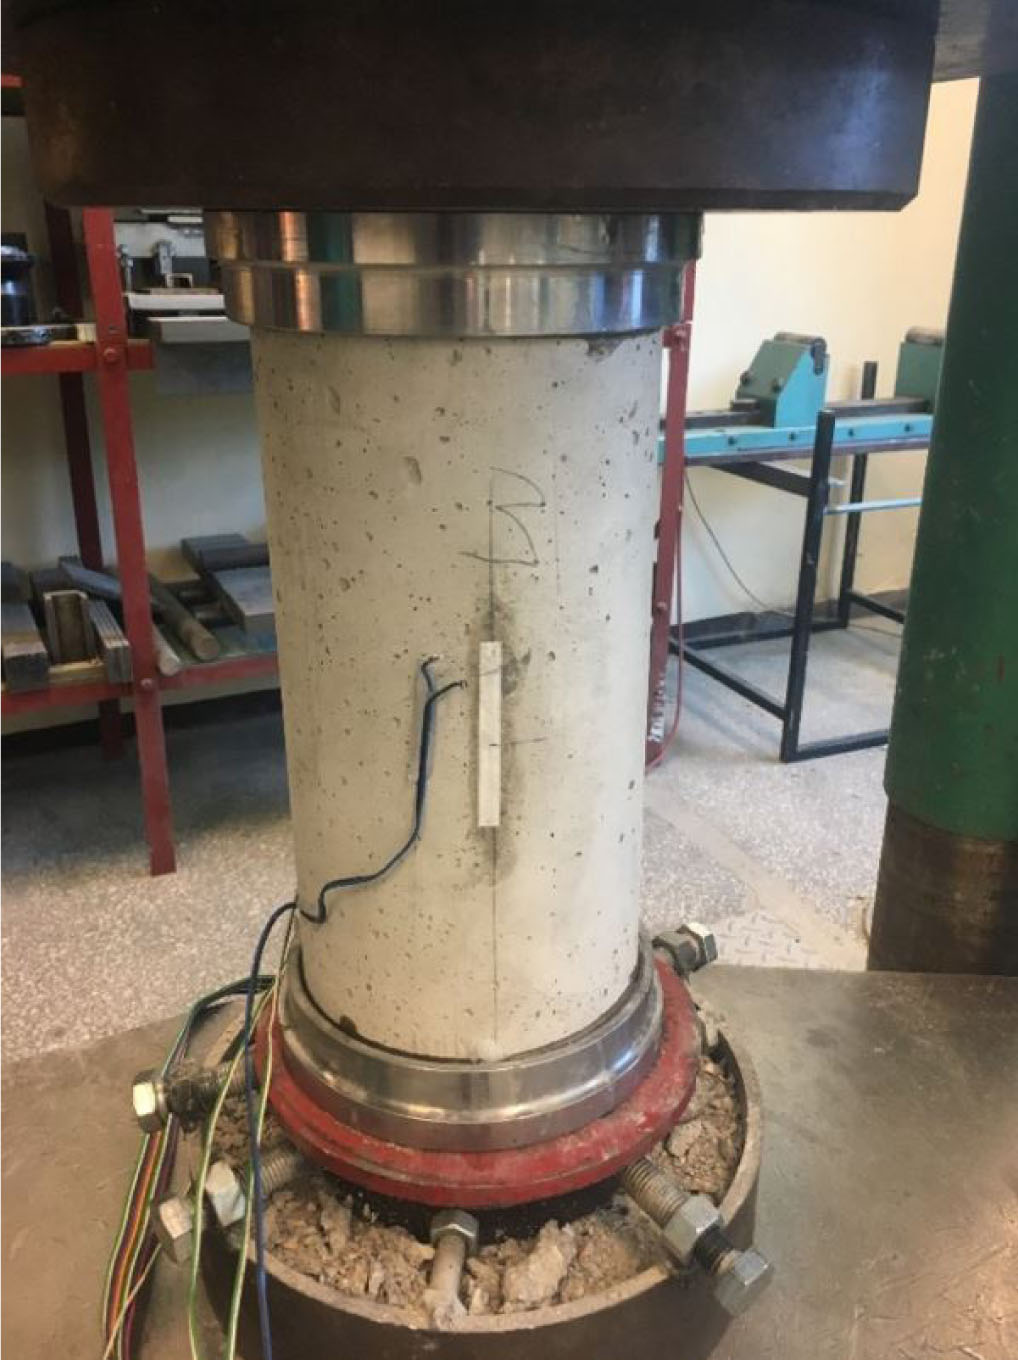
Figure 5
Concrete specimen placed in strength-testing machine.
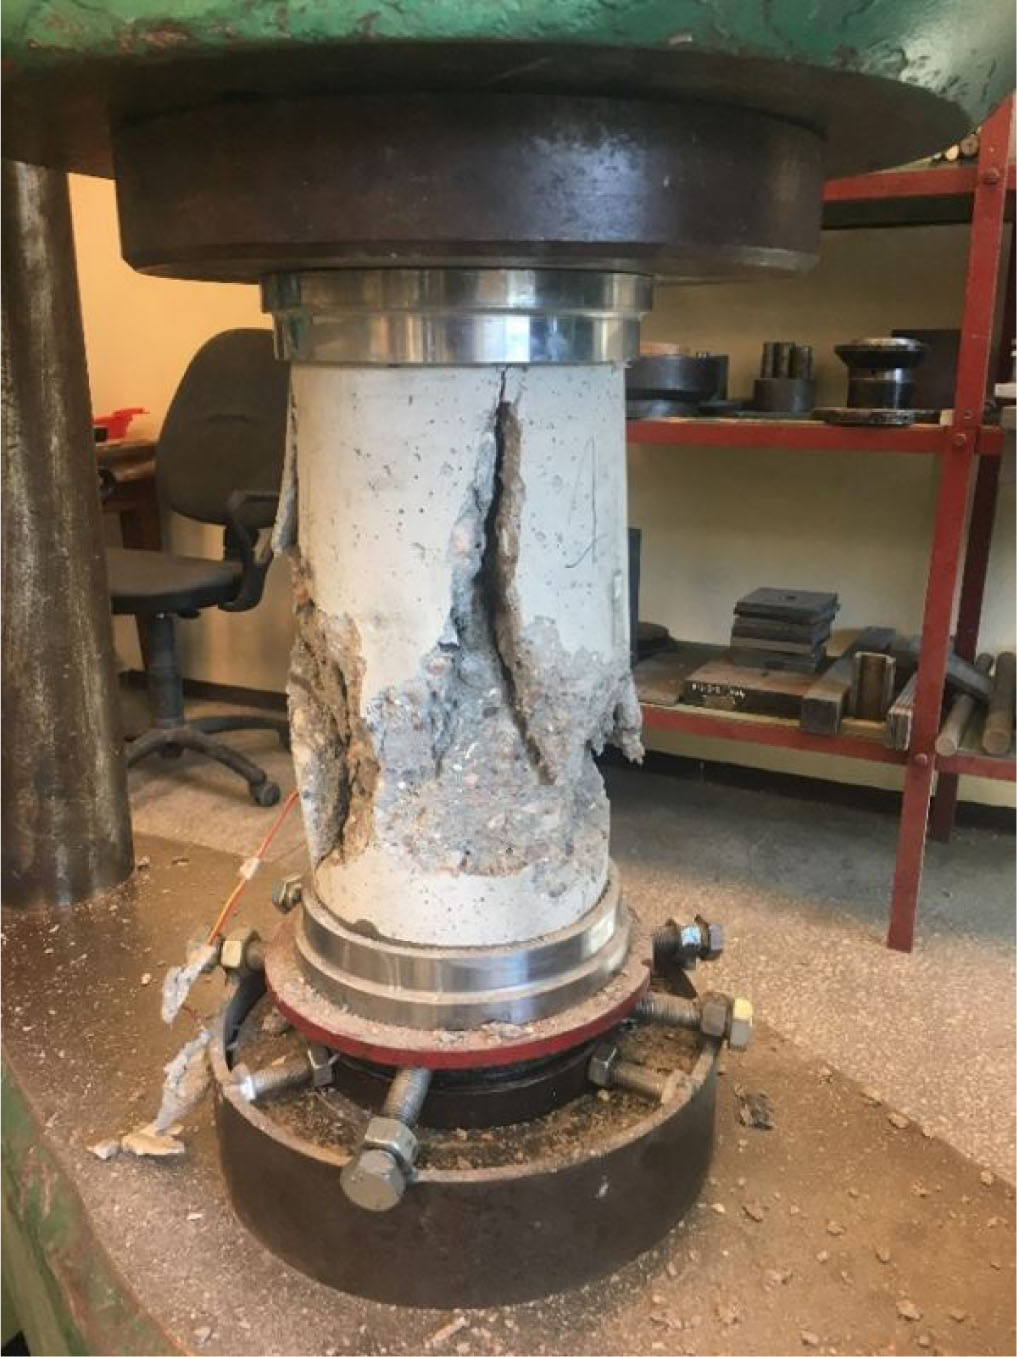
Figure 6
Failed concrete specimen.
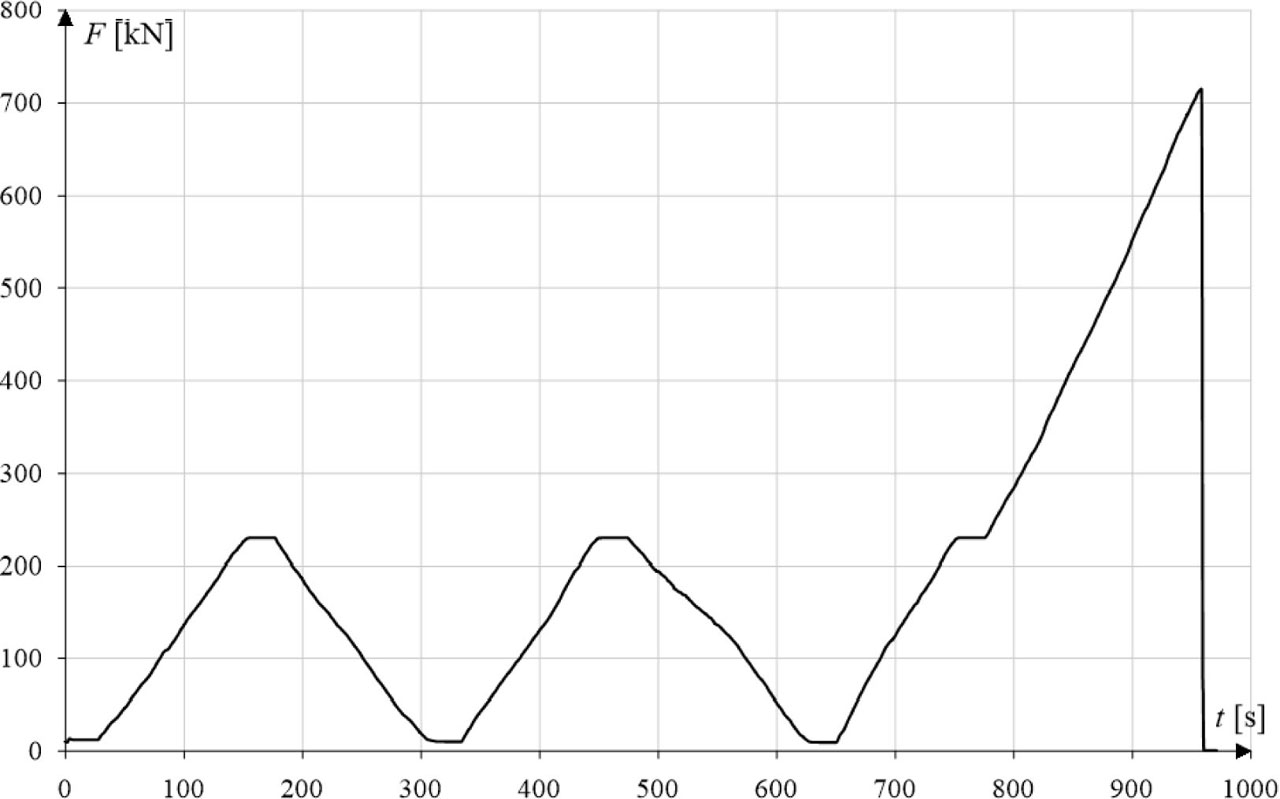
Figure 7
Diagram of specimen loading according to method I.
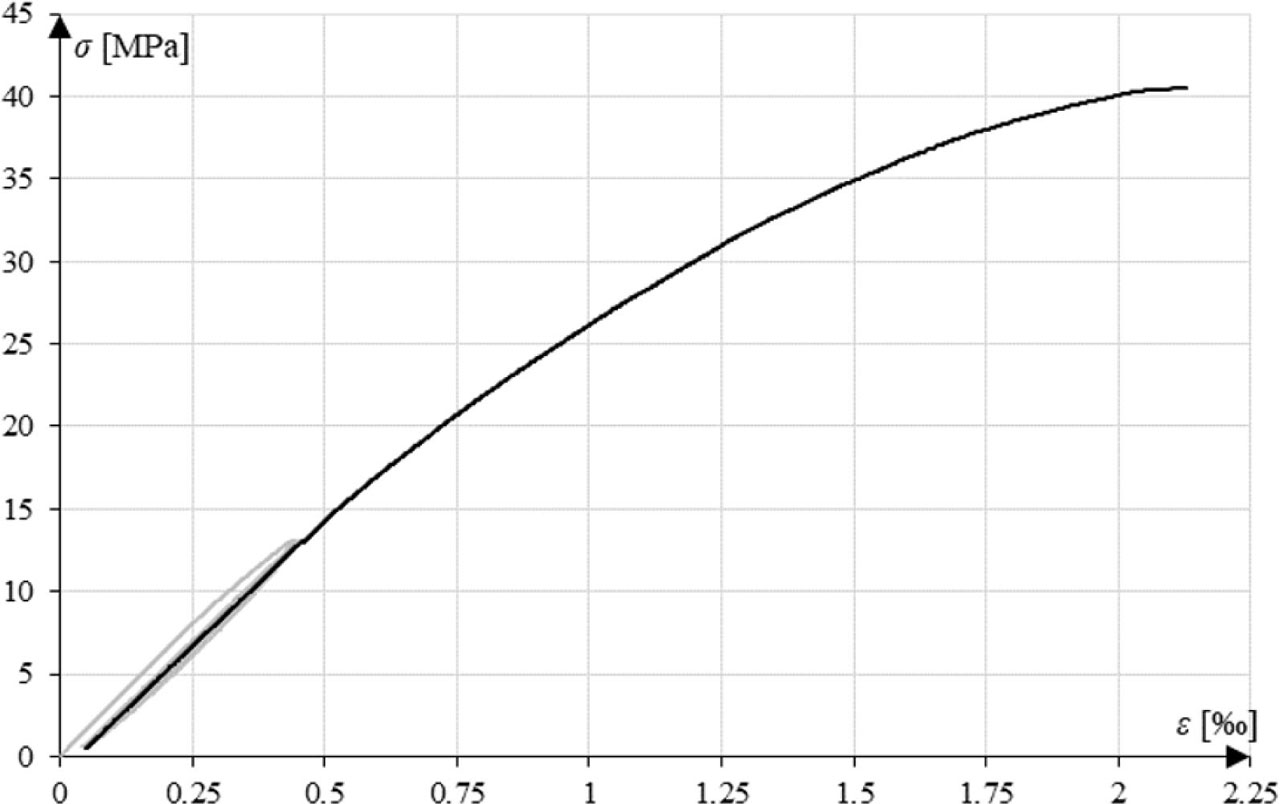
Figure 8
Stress–strain diagram for specimen tested according to method I.
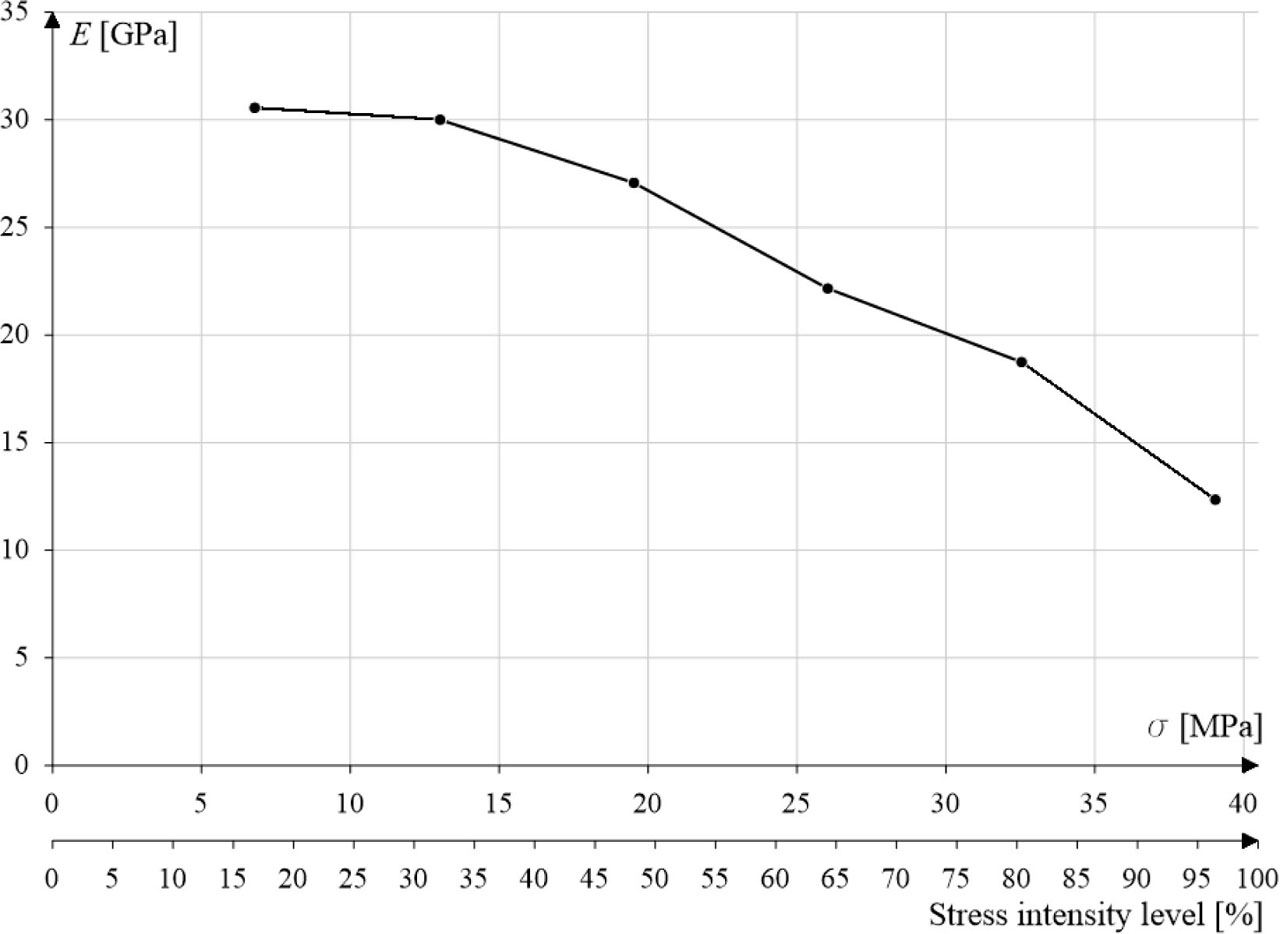
Figure 9
Young's modulus E versus compressive stress σ and stress intensity level in concrete (method I).
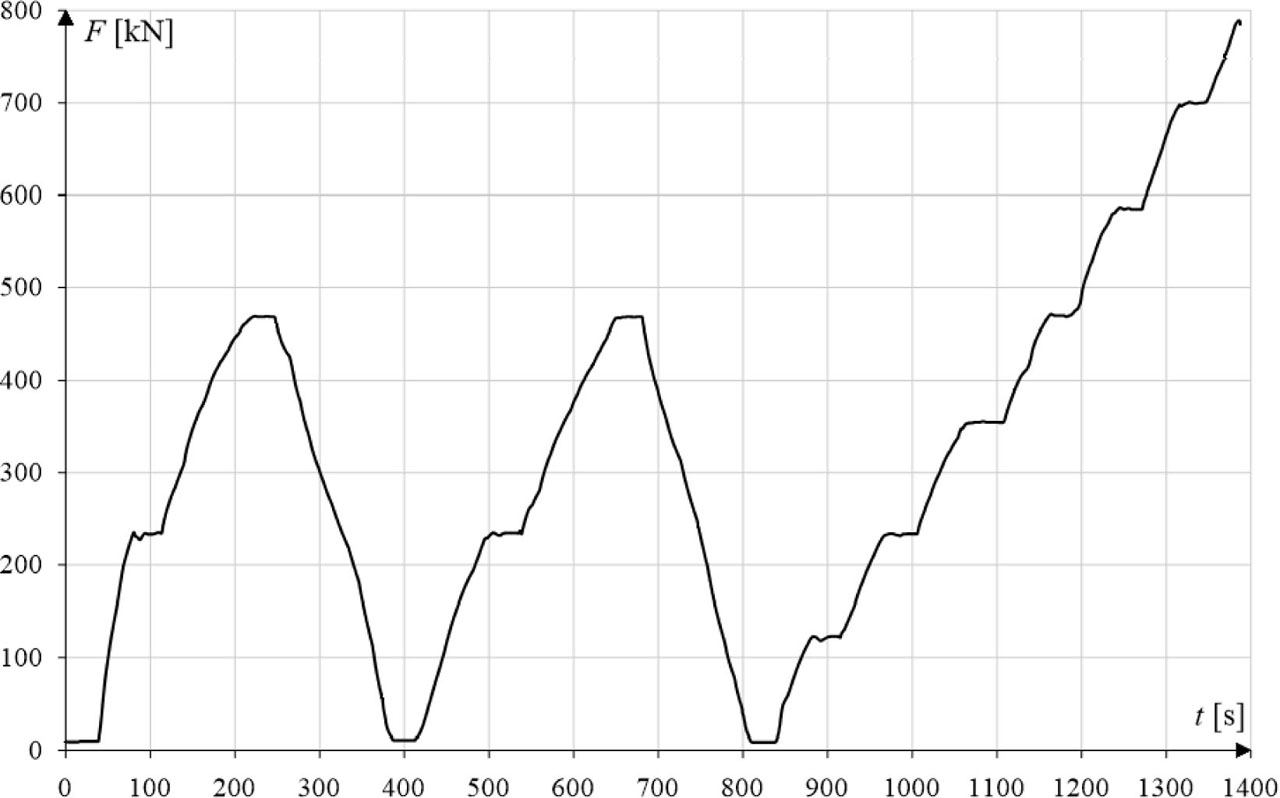
Figure 10
Diagram of specimen loading according to method II.
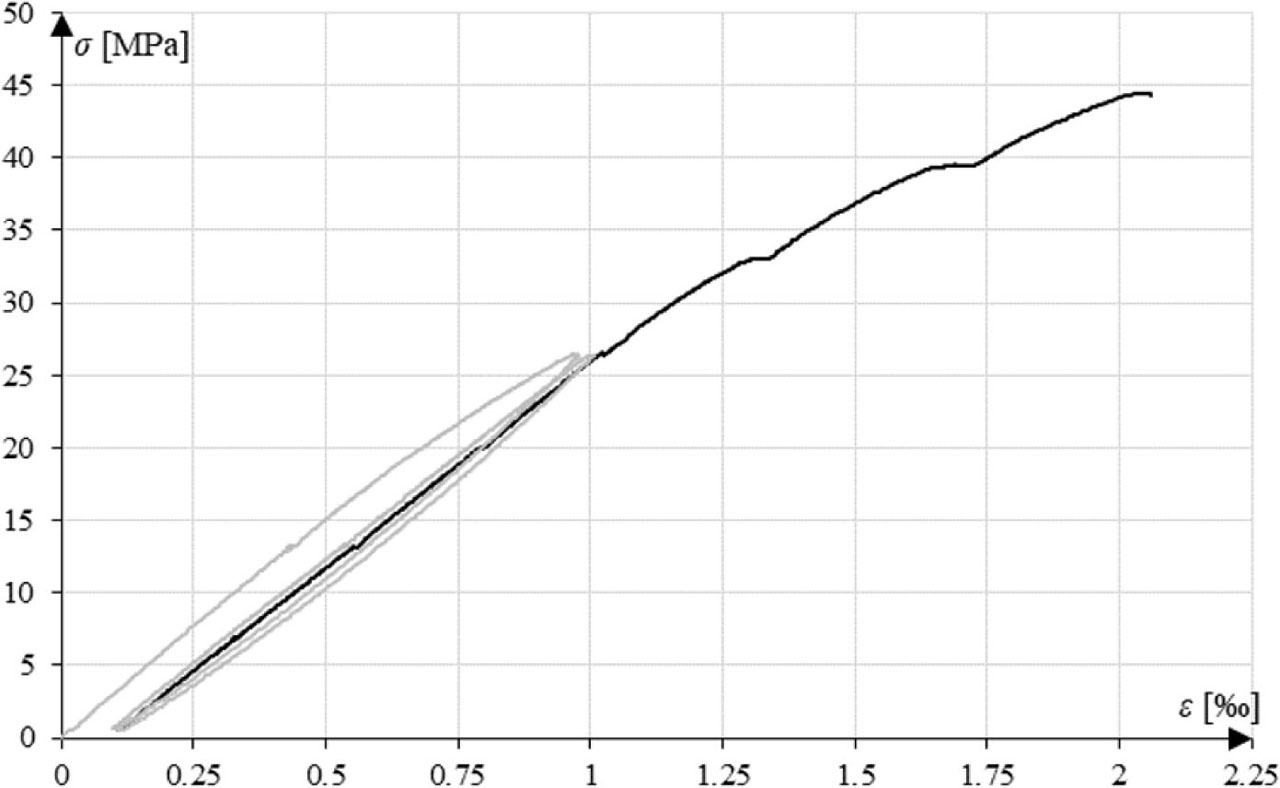
Figure 11
Stress–strain diagram for specimen tested according to method II.
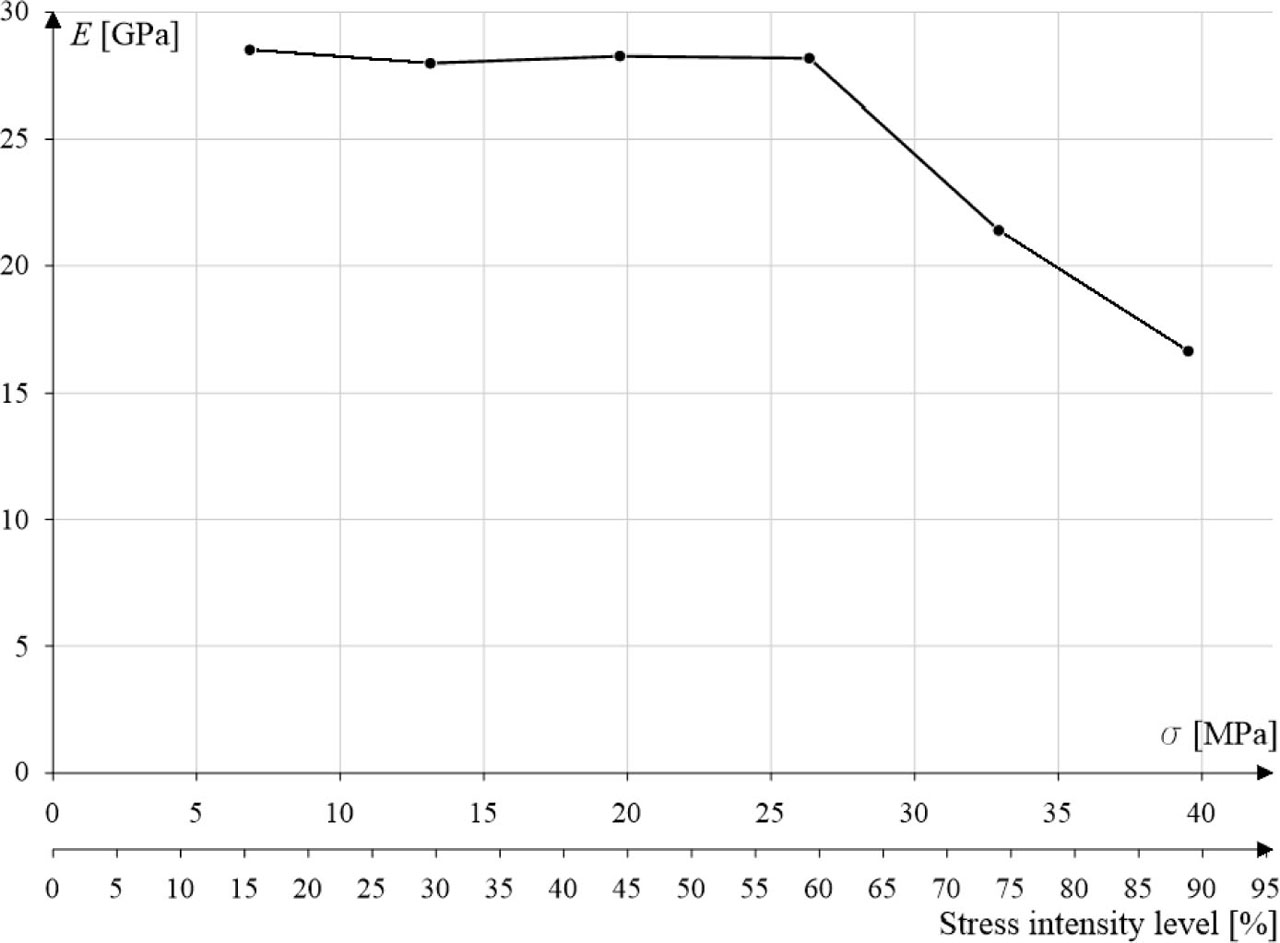
Figure 12
Young's modulus E versus compressive stress σ and stress intensity level in concrete (method II).
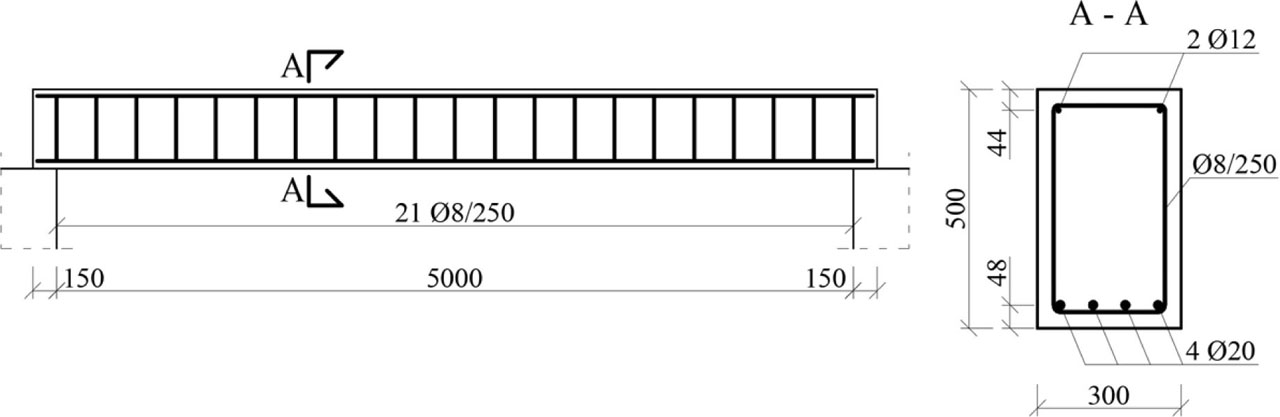
Figure 13
View and cross section of the considered beam (all dimensions in mm).
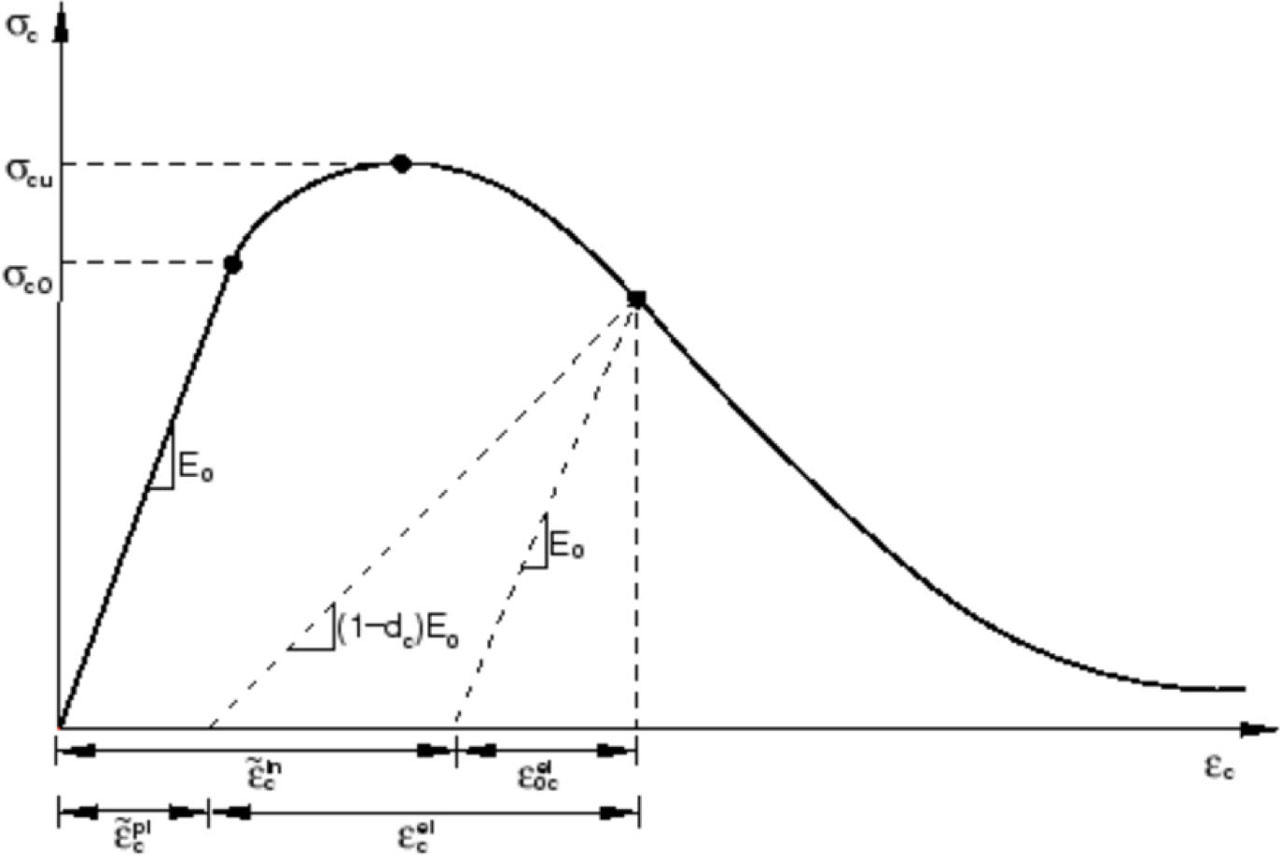
Figure 14
CDP stress–strain curve for concrete in compression (Abaqus Analysis User's Guide, 2014).
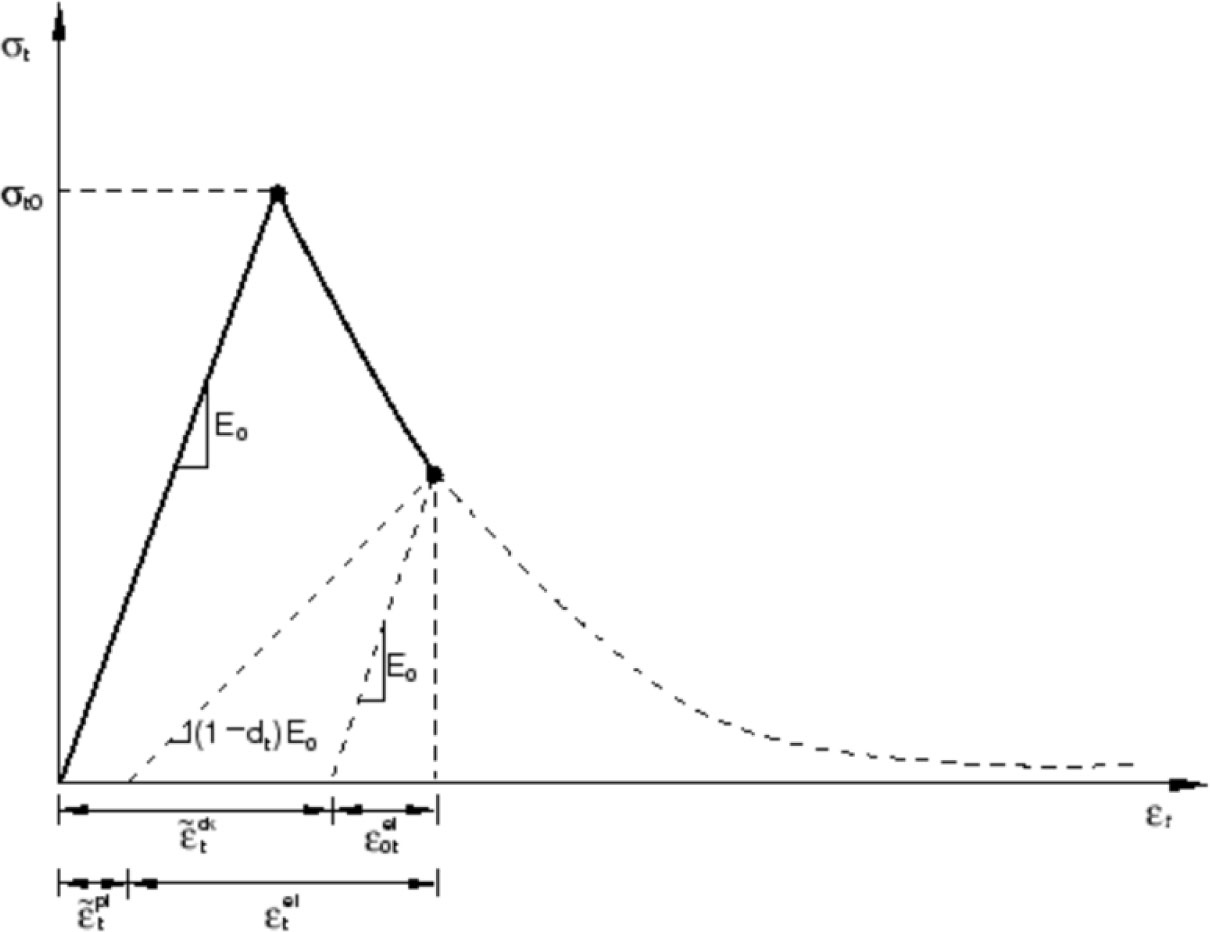
Figure 15
CDP stress–strain curve for concrete in tension (Abaqus Analysis User's Guide, 2014)
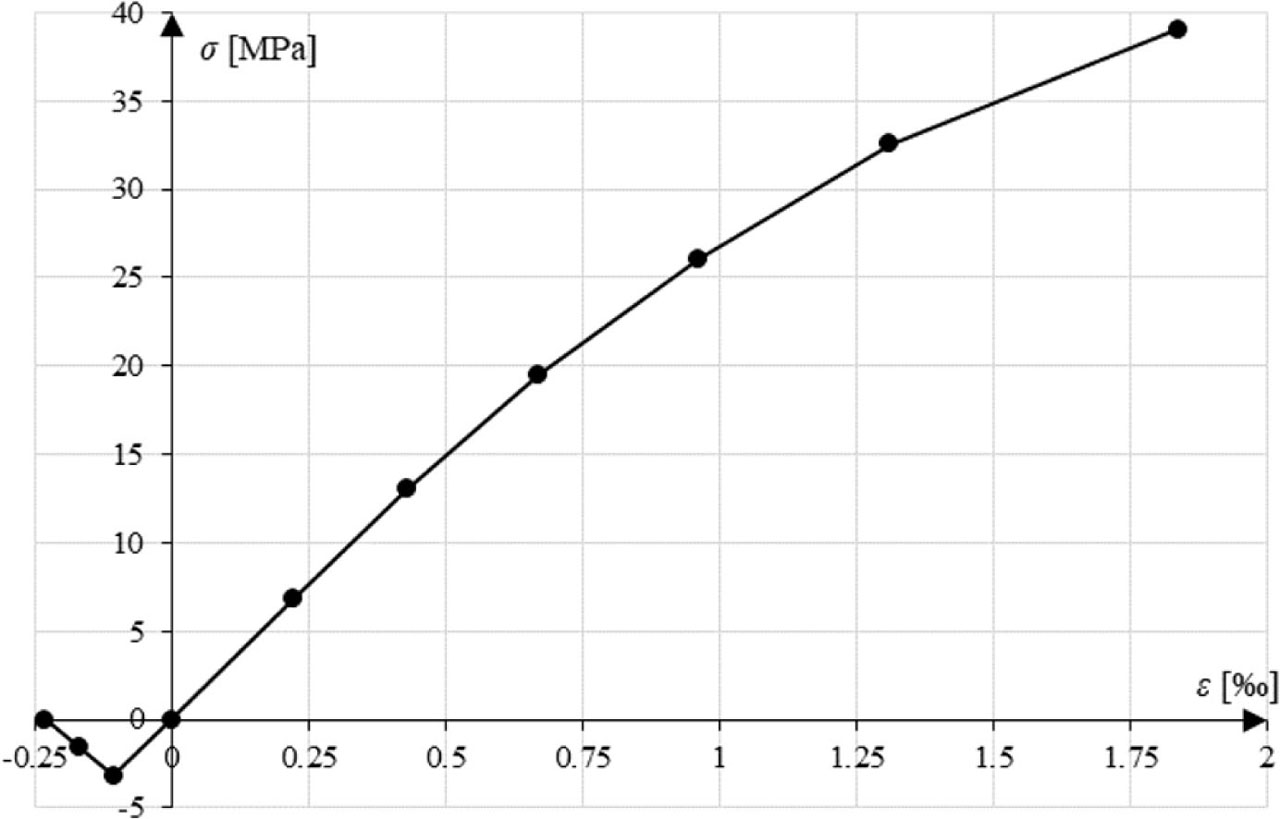
Figure 16
Stress–strain characteristic entered into ABAQUS.
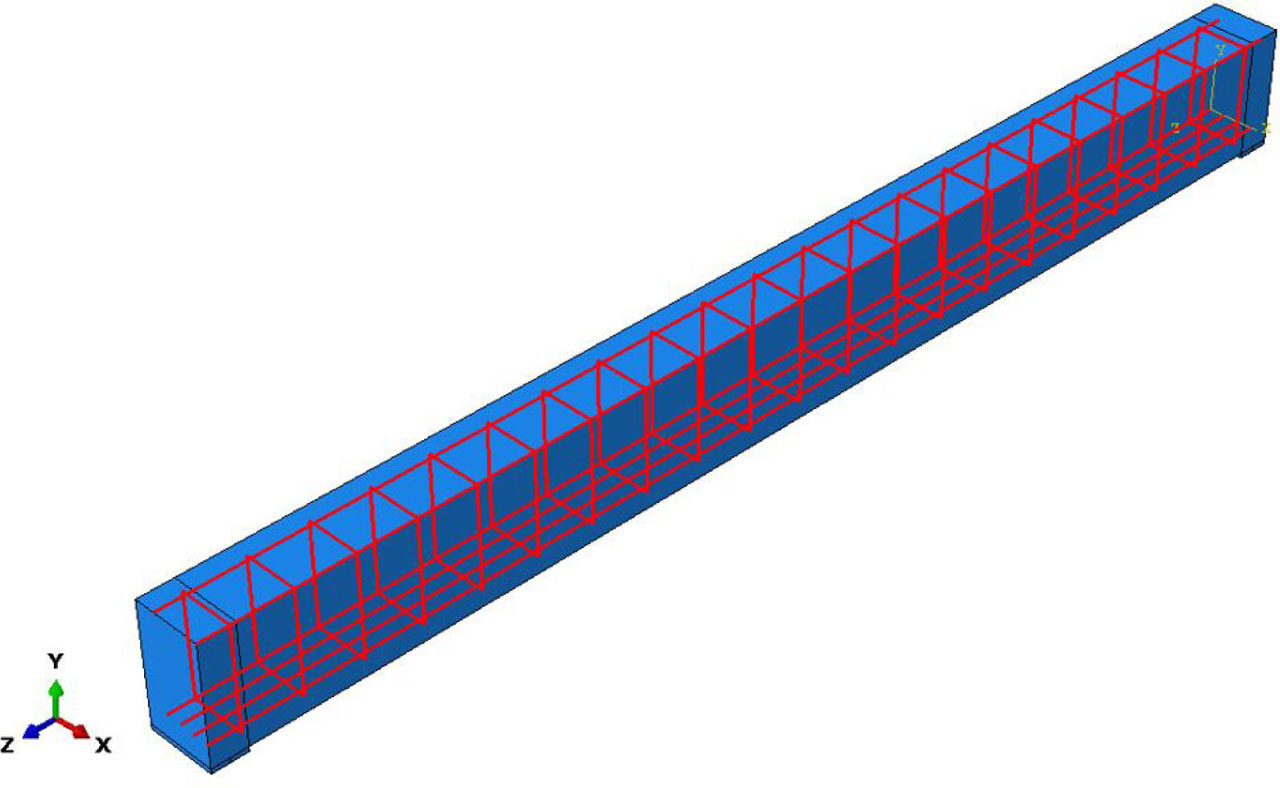
Figure 17
Beam model in ABAQUS.
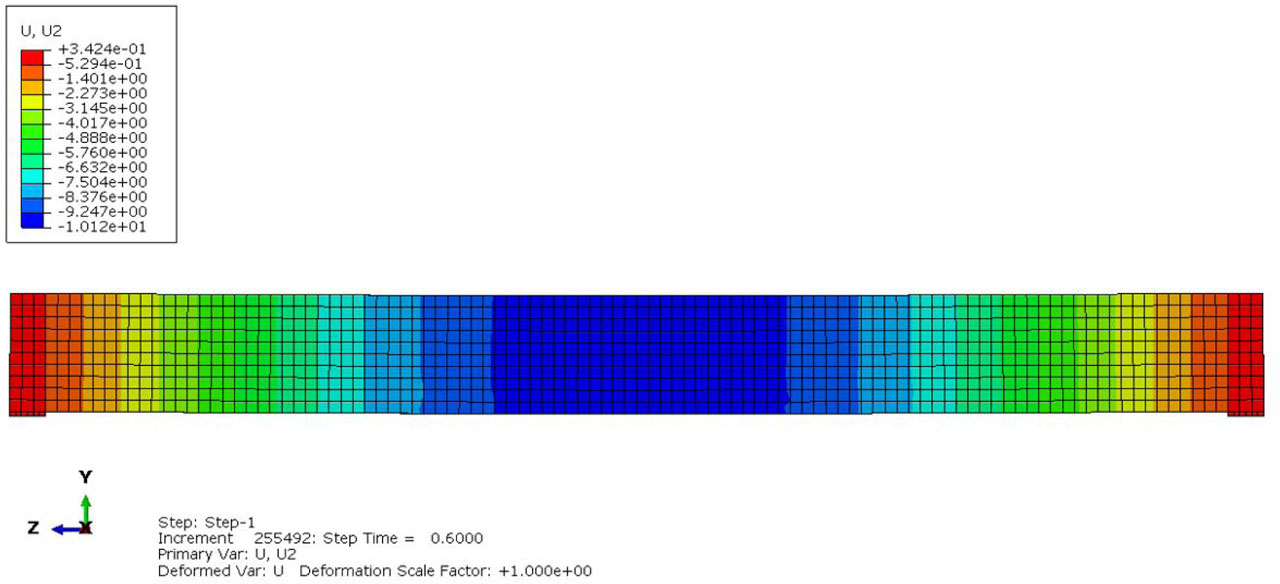
Figure 18
Beam deflection under load of 40 kN/m (deflection values in mm).
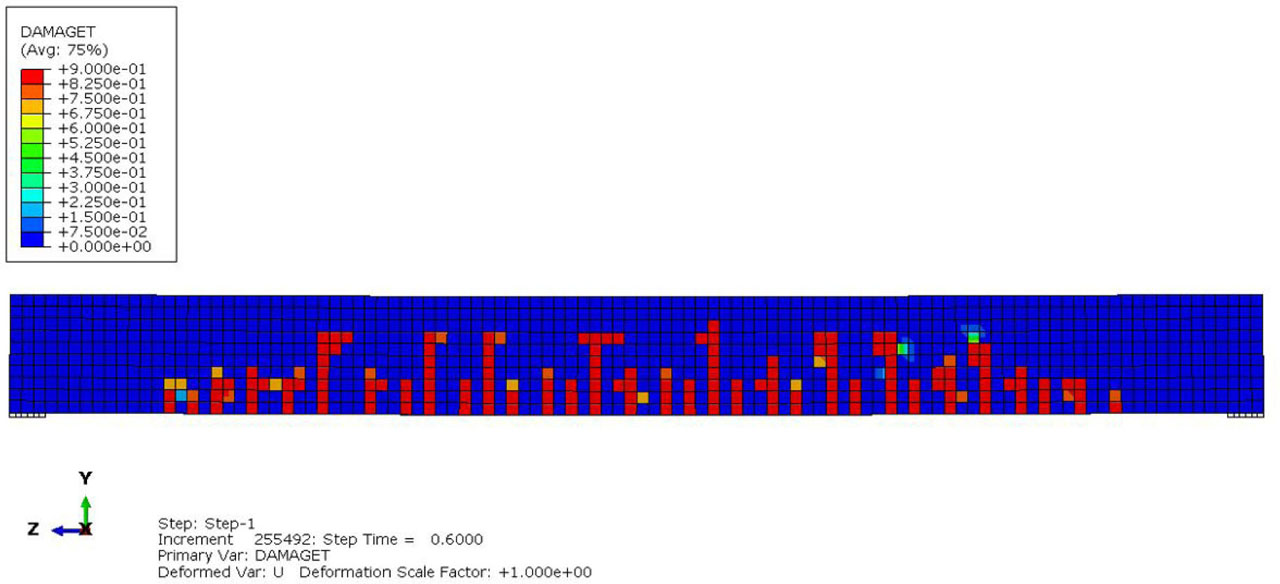
Figure 19
Image of beam cracking under load of 40 kN/m.

Figure 20
Structure and loading diagram – simply supported beam uniformly loaded along its whole length.
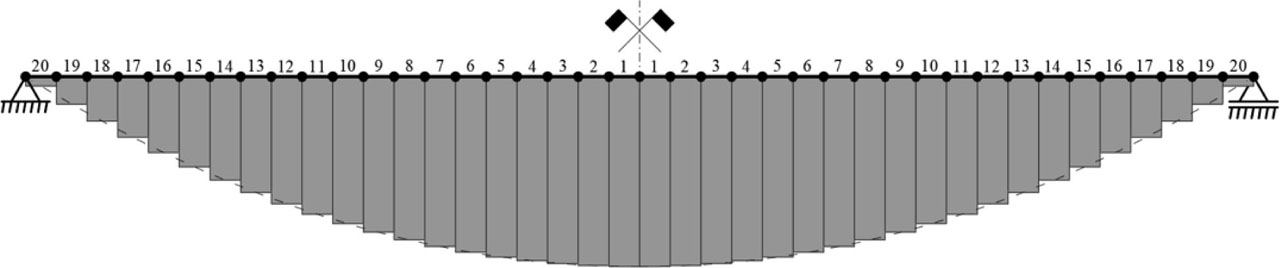
Figure 21
Stepped graph of bending moments with division of beam into fragments (dashed line shows actual shape of bending moments graph; dots on element's longitudinal axis denote points of division of beam into fragments).
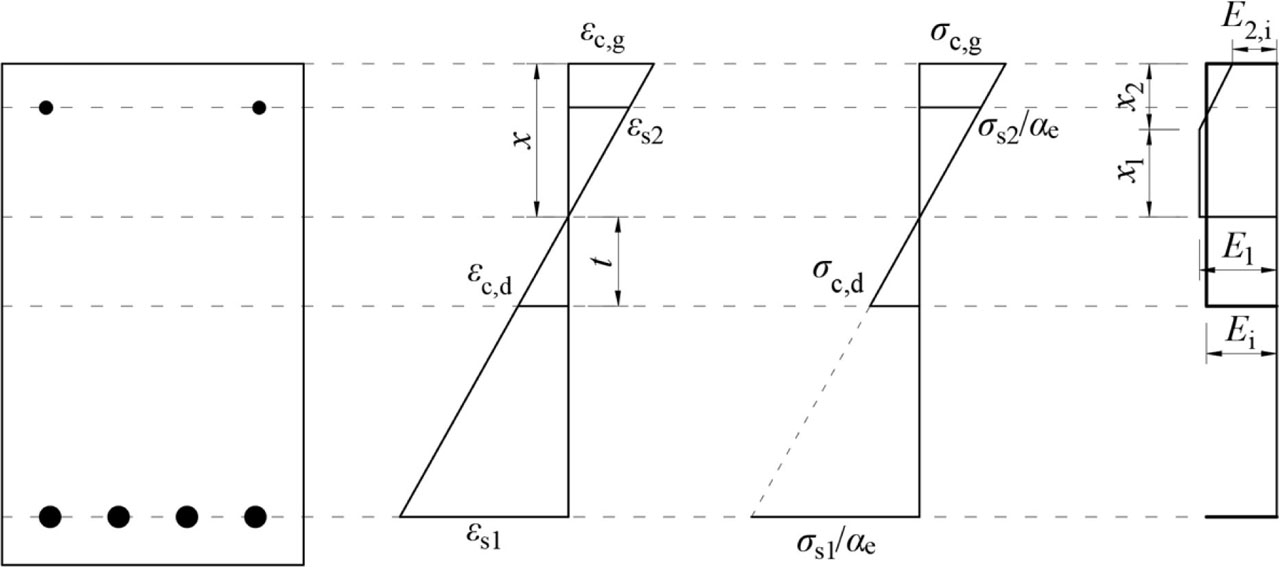
Figure 22
Normal strain, normal stress (for equivalent cross section) and Young's modulus of concrete in cross section of given beam fragment.
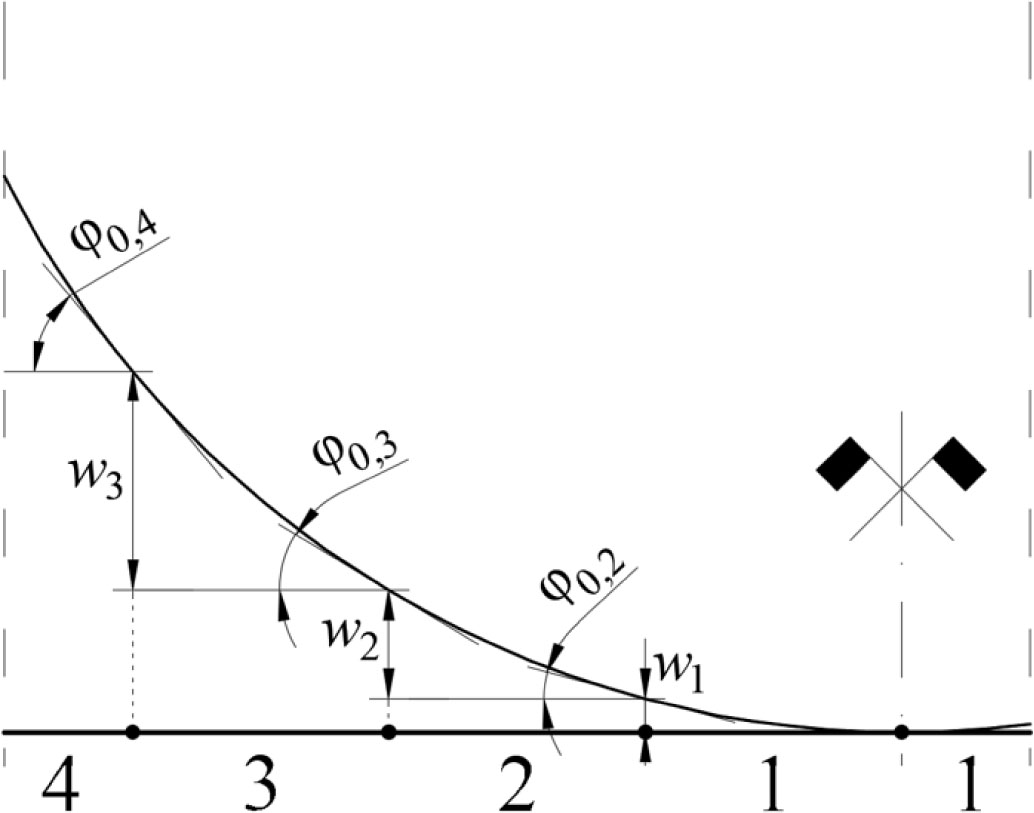
Figure 23
Visualization of way of calculating deflections of particular beam fragments.
Table 2
Comparison of beam deflections for constant and variable Young's modulus of concrete.
| No. | Load | Bending effort of the element | Constant Young's modulus | Variable Young's modulus | Relative increment in deflection |
|---|---|---|---|---|---|
| α | α’ | ||||
| [kN/m] | [%] | [mm] | [mm] | [%] | |
| 1 | 40 | 58 | 10.20 | 10.26 | 0.59 |
| 2 | 45 | 66 | 11.69 | 11.84 | 1.28 |
| 3 | 50 | 73 | 13.16 | 13.44 | 2.13 |
| 4 | 55 | 80 | 14.61 | 15.08 | 3.22 |
| 5 | 60 | 88 | 16.05 | 16.75 | 4.36 |
| 6 | 65 | 95 | 17.49 | 18.48 | 5.66 |
Table 3
Comparison of deflections for bar model and FEM model.
| No. | Bar model | FE model | Relative difference between α〉 and αCDP | ||
|---|---|---|---|---|---|
| Load | Constant Young's modulus | Variable Young's modulus | ABAQUS - CDP | ||
| α | α’ | αCDP | |||
| [kN/m] | [mm] | [mm] | [mm] | [%] | |
| 1 | 40 | 10.20 | 10.26 | 9.90 | 3.51 |
| 2 | 45 | 11.69 | 11.84 | 12.09 | 2.11 |
| 3 | 50 | 13.16 | 13.44 | 14.31 | 6.47 |
| 4 | 55 | 14.61 | 15.08 | 16.57 | 9.88 |
| 5 | 60 | 16.05 | 16.75 | 18.88 | 12.72 |
| 6 | 65 | 17.49 | 18.48 | 21.23 | 14.88 |
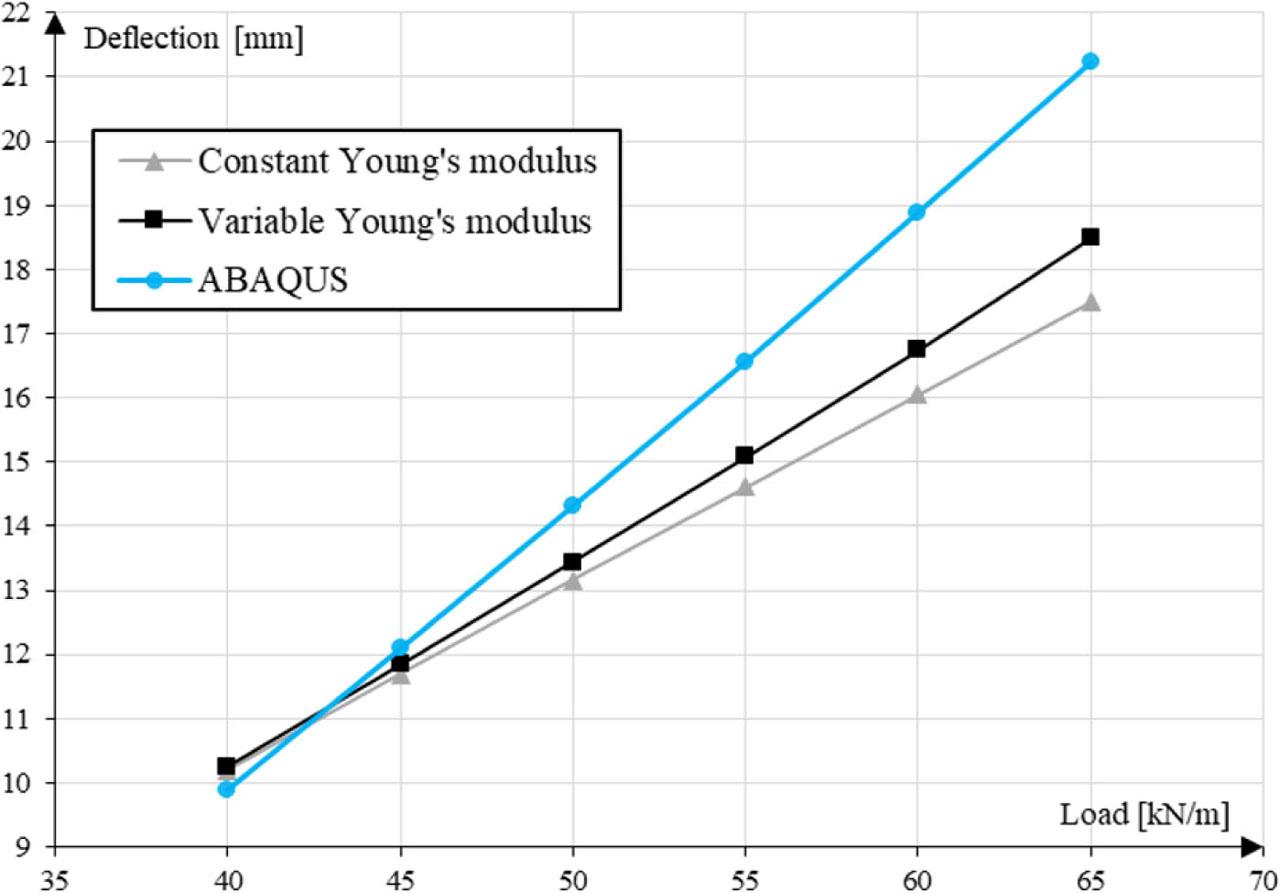
Figure 24
Maximum absolute deflection versus applied load for bar model taking into account constant and variable Young's modulus and for ABAQUS FEM model.
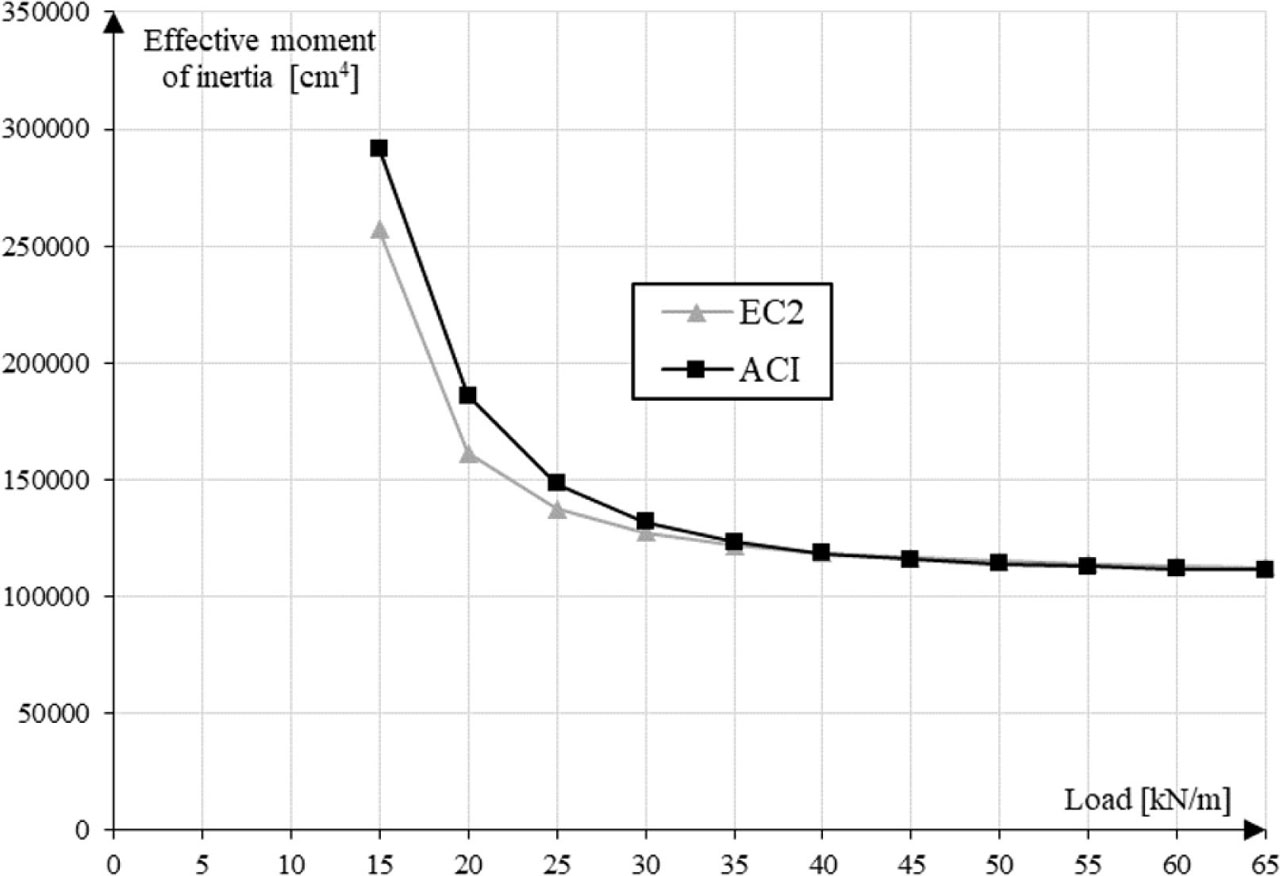
Figure 25
Values of effective moments of inertia according to, respectively, ACI Code 318-19 (2019) and EN 1992-1-1 (2004), depending on load in range of 15–65 kN/m.