
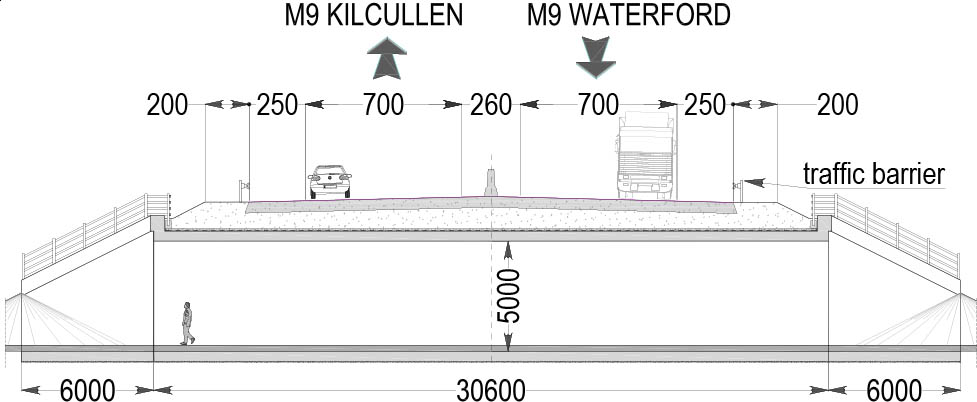
Figure 1
Longitudinal section of the bridge.
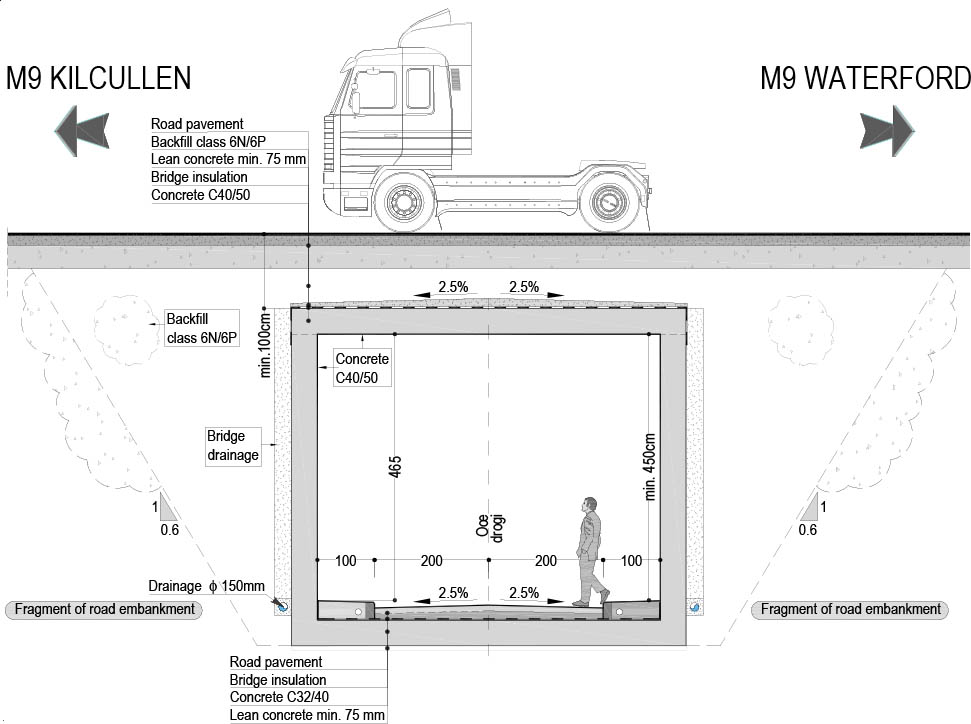
Figure 2
Cross-section of the bridge.
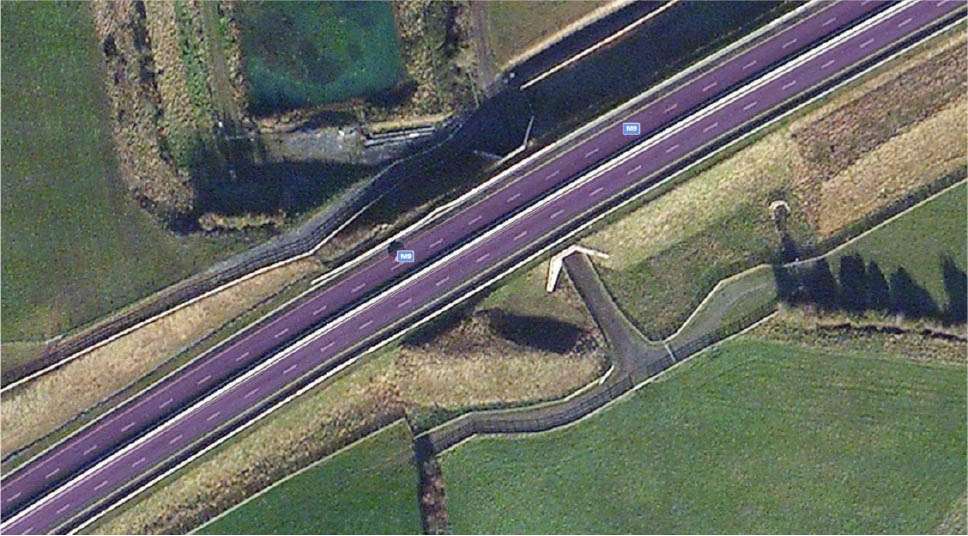
Figure 3
Bridge location (Microsoft Bing Maps) [18]
Table 1
Basic bridge parameters.
| Elements | |
|---|---|
| Effective span length | Lt=6.45 [m] |
| Overall span length | Lp=6.9 [m] |
| Skew angle | a=90° |
| Wall, upper floor slab, and bottom slab thickness | h=0.45 [m] |
| Minimal soil surcharge height over bridge structure | Hn=1.1 [m] |
| Length of bridge without wing walls | Lo=30.6 [m] |
| Overall length of wing walls | Ls=8.49 [m] |
| Angle of rotation of wing walls relative to bridge length | b=45° |
| Span height to length ratio | 1:15 |
| Embankment height | 6.0 [m] |
| Bottom slab and wing wall strip footing concrete class | C32/40 |
| Bridge wall, upper floor slab, wing wall, and string course concrete class | C40/50 |
| Live load type | HA and HB45 |
Table 2
Grading of 6N and 6P class backfills [14].
| Square mesh sieve [mm] | Percent passing sieve [%] | |
|---|---|---|
| 6N | 6P | |
| 125 | 100 | |
| 100 | 100 | |
| 75 | 65–100 | |
| 37,5 | 45–100 | |
| 10 | 15–75 | |
| 5 | 10–60 | |
| 0.6 | 0–30 | |
| 0.063 | 0–15 | |
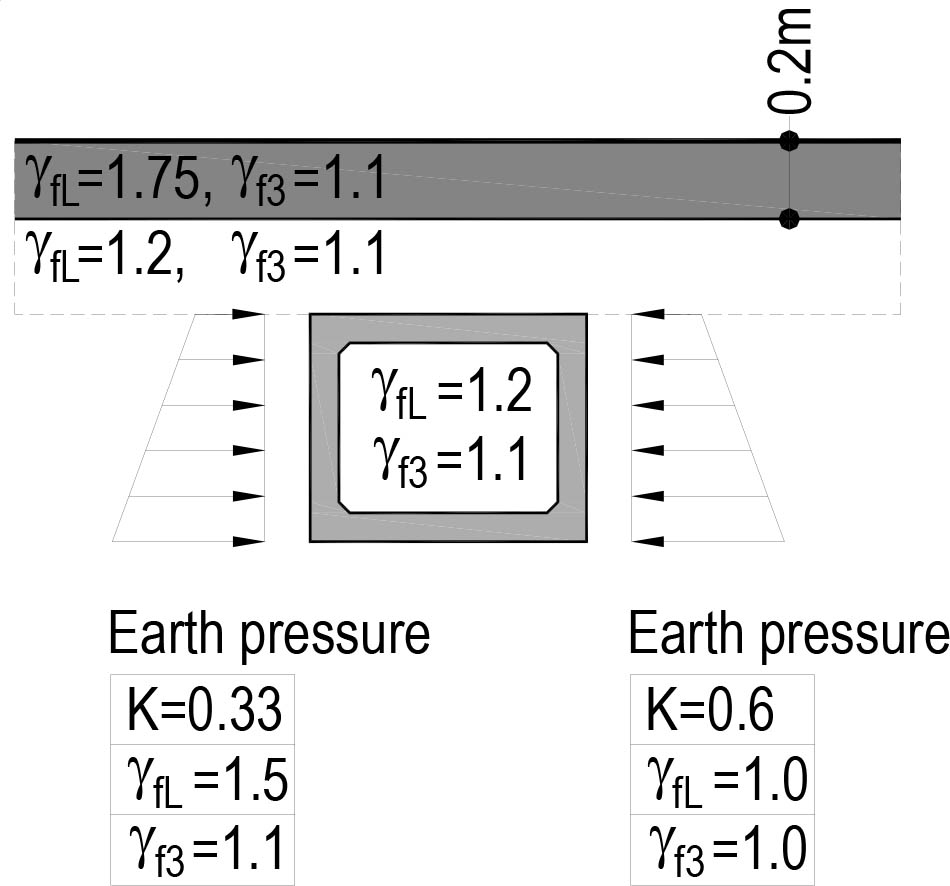
Figure 4
Partial load factors consistent with diagram A/4a [8].
Table 3
Permanent load.
| Load | Values [kN/m] | |
|---|---|---|
| Road pavement | V1 | 2.3 • 0.2 • 9.81 • 1.75 • 1.1 = 8.7 |
| Surcharge over bridge | V2 | 2.0 • 1.1 • 9.81 • 1.2 • 1.1 = 28.5 |
| Earth pressure behind left abutment wall | HL1 | (2.3 • 0.2+2.0 • 1.1) • 9.81 • 0.33 • 1.5 • 1.1 = 14.2 |
| HL2 | (2.3 • 0.2+2.0 • (1.1 + 5.9)) • 9.81 • 0.33 • 1.5 • 1.1 = 77.2 | |
| Earth pressure behind right abutment wall | HP1 | (2.3 • 0.2+2.0 • 1.1) • 9.81 • 0.6 • 1.0 • 1.0 = 15.7 |
| HP2 | (2.3 • 0.2+2.0 • (1.1 + 5.9)) • 9.81 • 0.6 • 1.0 • 1.0 = 85.1 | |
| Self-weight of concrete | CW | 2.4 • 1 • 0.45 • 9.81 • 1.2 • 1.1 = 13.99 |
Table 4
Concrete modulus of elasticity and Poisson's ratios [11].
| Member | ||
|---|---|---|
| Bottom slab, | 33.34 [GPa] | |
| concrete C32/40 | Ecm, | 0.2 |
| Abutment walls, upper floor slab, | ν | 35.22 [GPa] |
| concrete C40/50 | 0.2 |
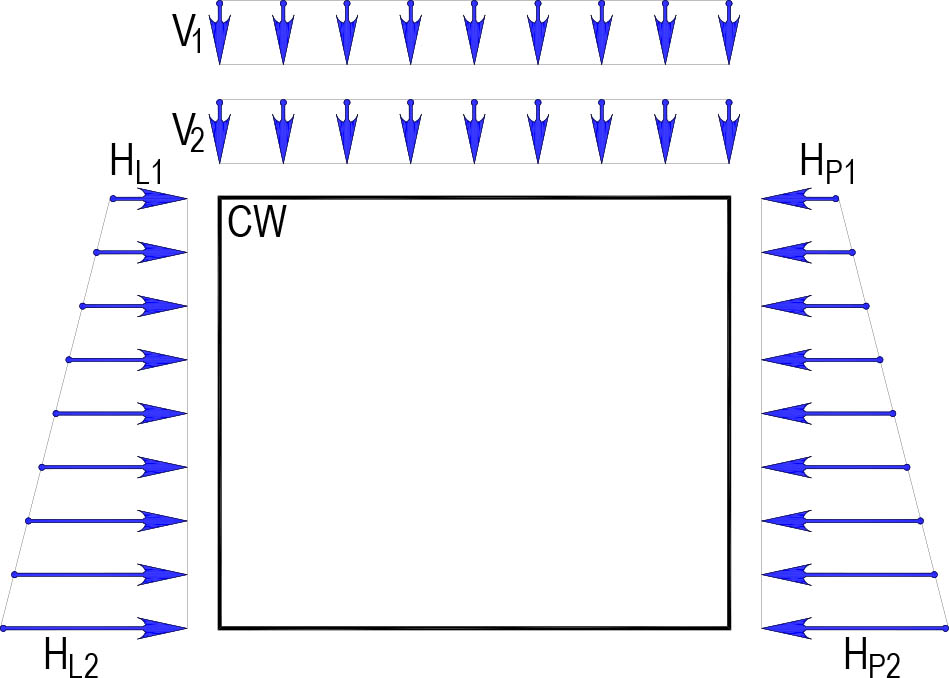
Figure 5
Load denotations and load action directions.
Table 5
Model and parameters analyzed.
| Model | kh [kN/m3] | kv [kN/m3] |
|---|---|---|
| M-1 | 10,000 | 10,000 |
| M-2 | 37,000 | 10,000 |
| M-3 | 120,000 | 10,000 |
| M-4 | 10,000 | 80,000 |
| M-5 | 37,068 | 80,000 |
| M-6 | 120,000 | 80,000 |
| M-7 | 10,000 | 120,000 |
| M-8 | 37,000 | 120,000 |
| M-9 | 120,000 | 120,000 |
| M-10 | 0 | ∞ |
| kh | Modulus of horizontal subgrade reaction (backfill material) |
| a, b | Coefficients dependent on soil type and consistency, e.g. gravel a = 1/4, b = 1/2 |
| Ep | Pressuremeter modulus of soil, Ep ≈ β qc, |
| qc | Cone soil penetration resistance determined by cone penetration test (CPT) |
| r0 | Reference radius, r0 = 0.3m |
| D | Bridge abutment wall height, D = 5.9 m, |
| r | Radius, a half of abutment wall height r = D / 2 = 5.9 / 2 = 2.95 m |
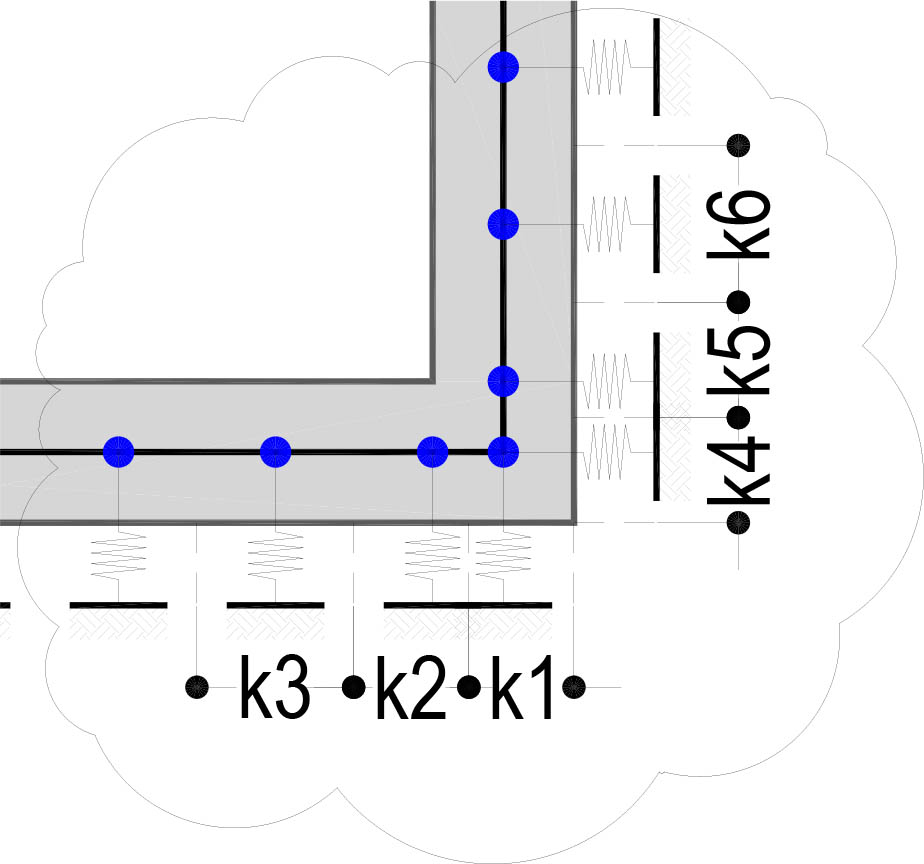
Figure 6
Elastic constrains location.
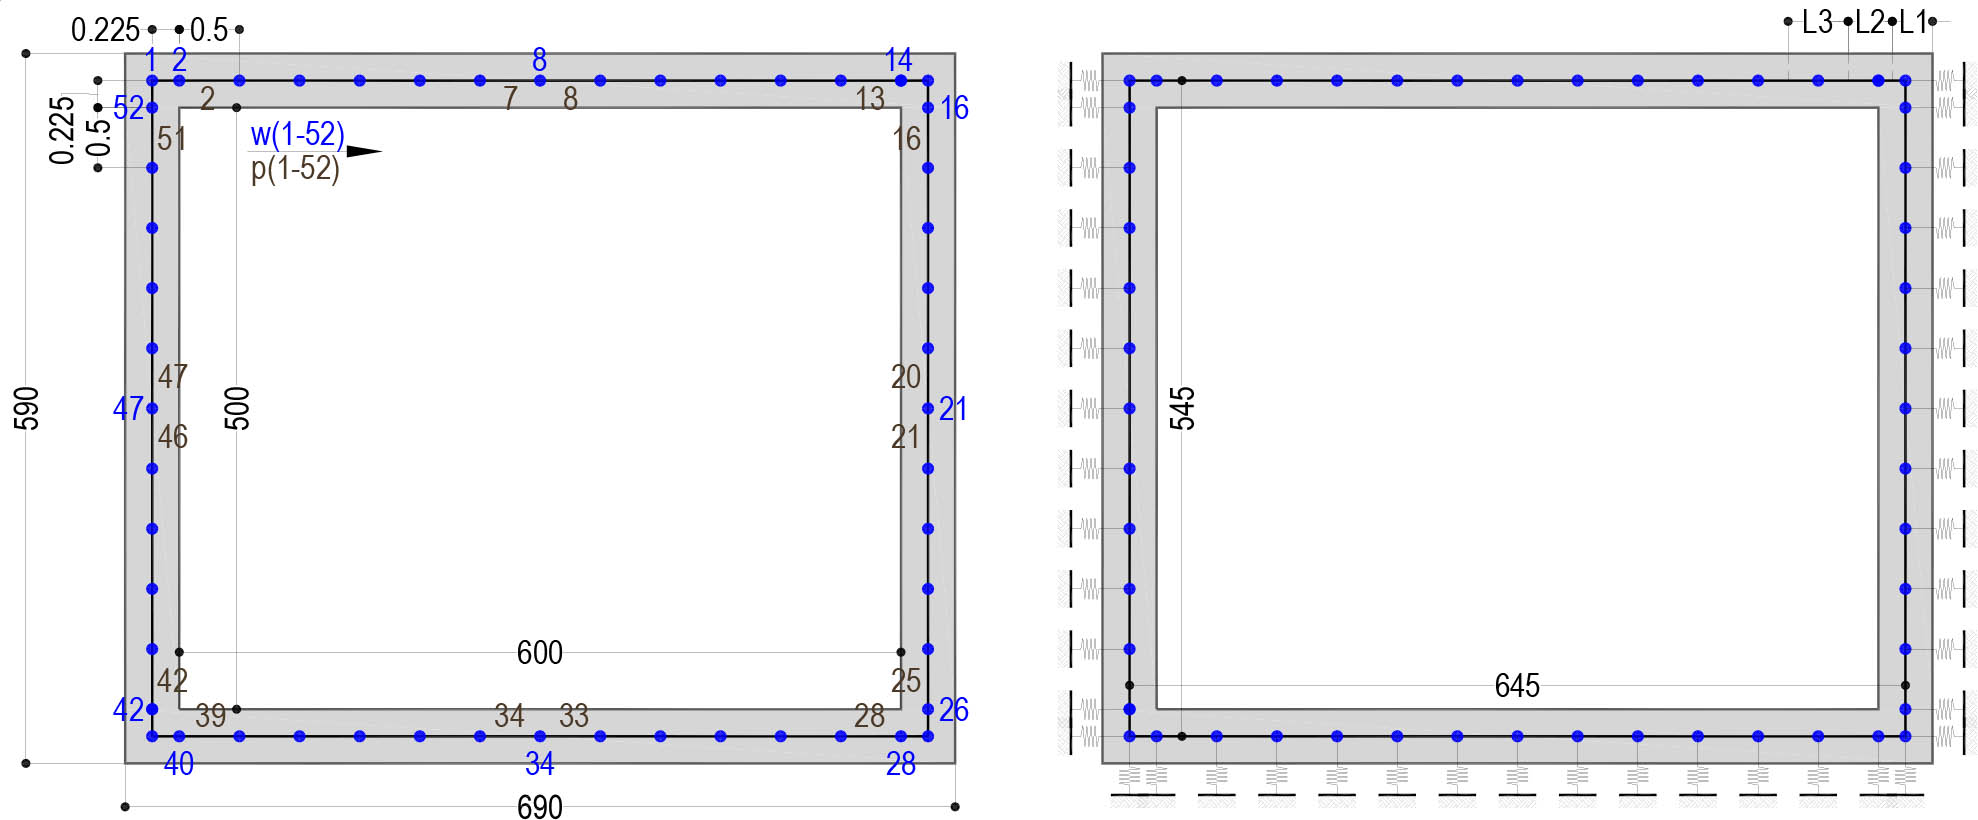
Figure 7
Beams and nodes location and elastic constraints distribution in cross-section.
Table 6
Stiffness of elastic constraints for M-5 model.
| Symbol | Range of influence [m] | Modulus of subgrade reaction [kN/m3] | Stiffness of elastic constraints [kN/m2] |
|---|---|---|---|
| k1 | 0.3375 | kh = 80,000 | 0.3375 • 80,000 = 27,000 |
| k2 | 0.3625 | 0.3625 • 80,000 = 29,000 | |
| k3 | 0.5 | 0.5 • 80,000 = 40,000 | |
| k4 | 0.3375 | kv = 37,068 | 0.3375 • 37,068 = 12,510 |
| k5 | 0.3625 | 0.3625 • 37,068 = 13,437 | |
| k6 | 0.5 | 0.5 • 37,068 = 18,536 |
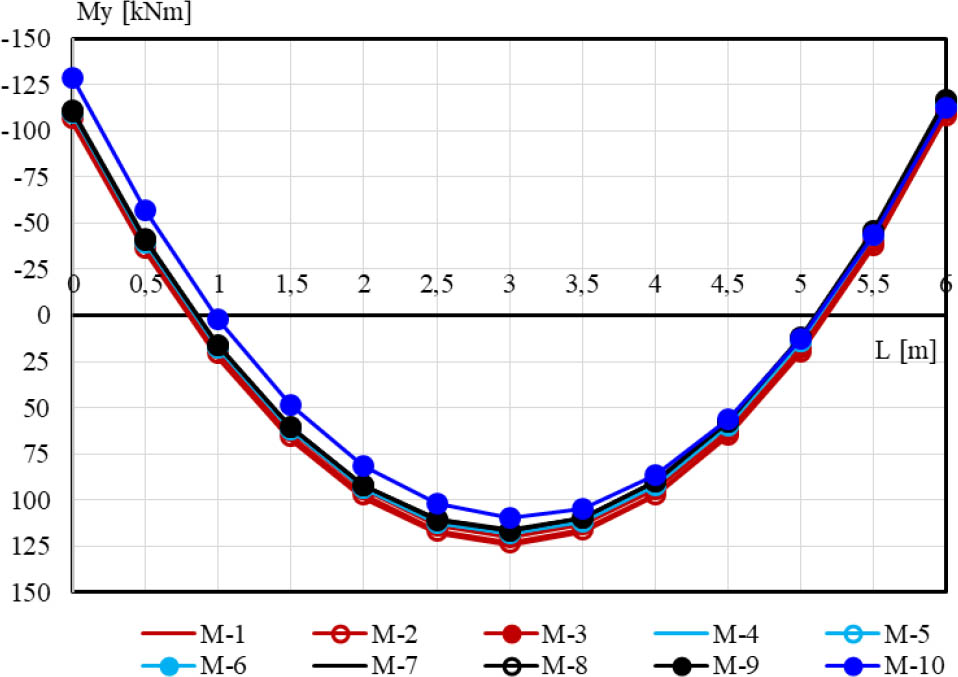
Figure 8
Distribution of bending moments in bridge's upper floor slab.
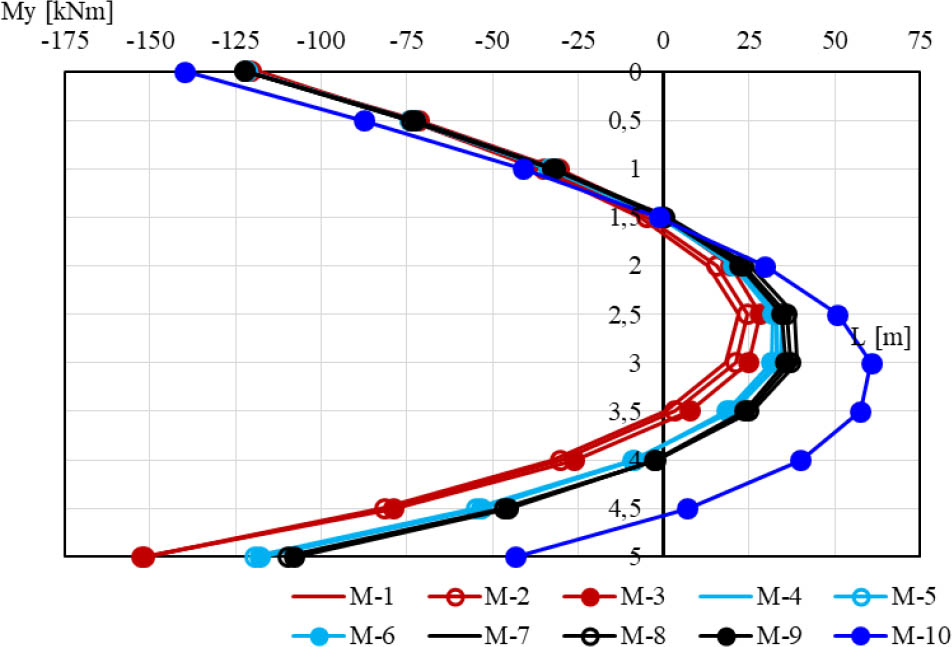
Figure 9
Distribution of bending moments in bridge's left abutment wall.
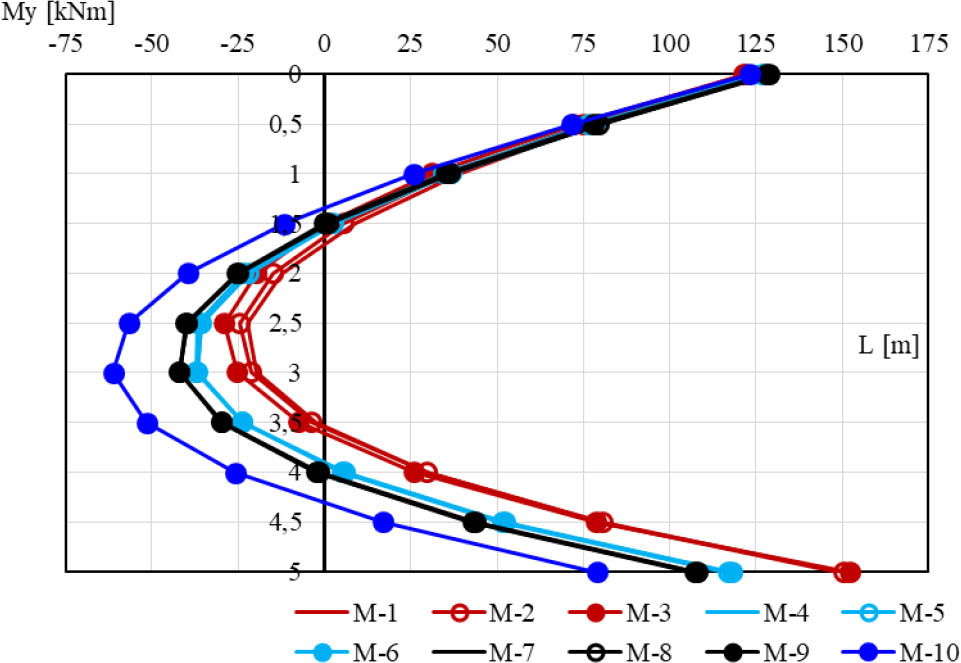
Figure 10
Distribution of bending moments in bridge's right abutment wall.
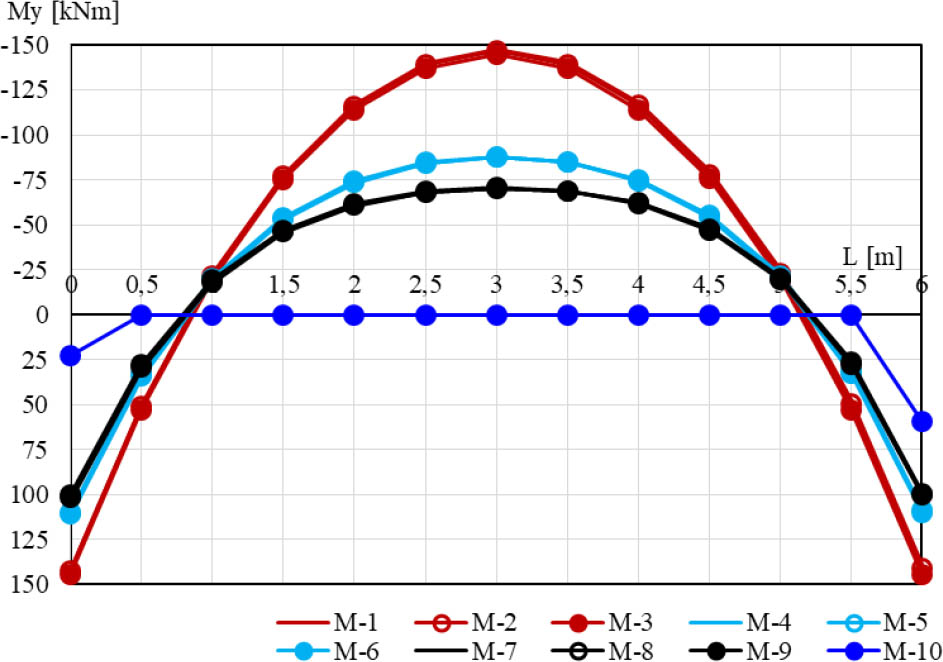
Figure 11
Distribution of bending moments in bridge's bottom slab.