
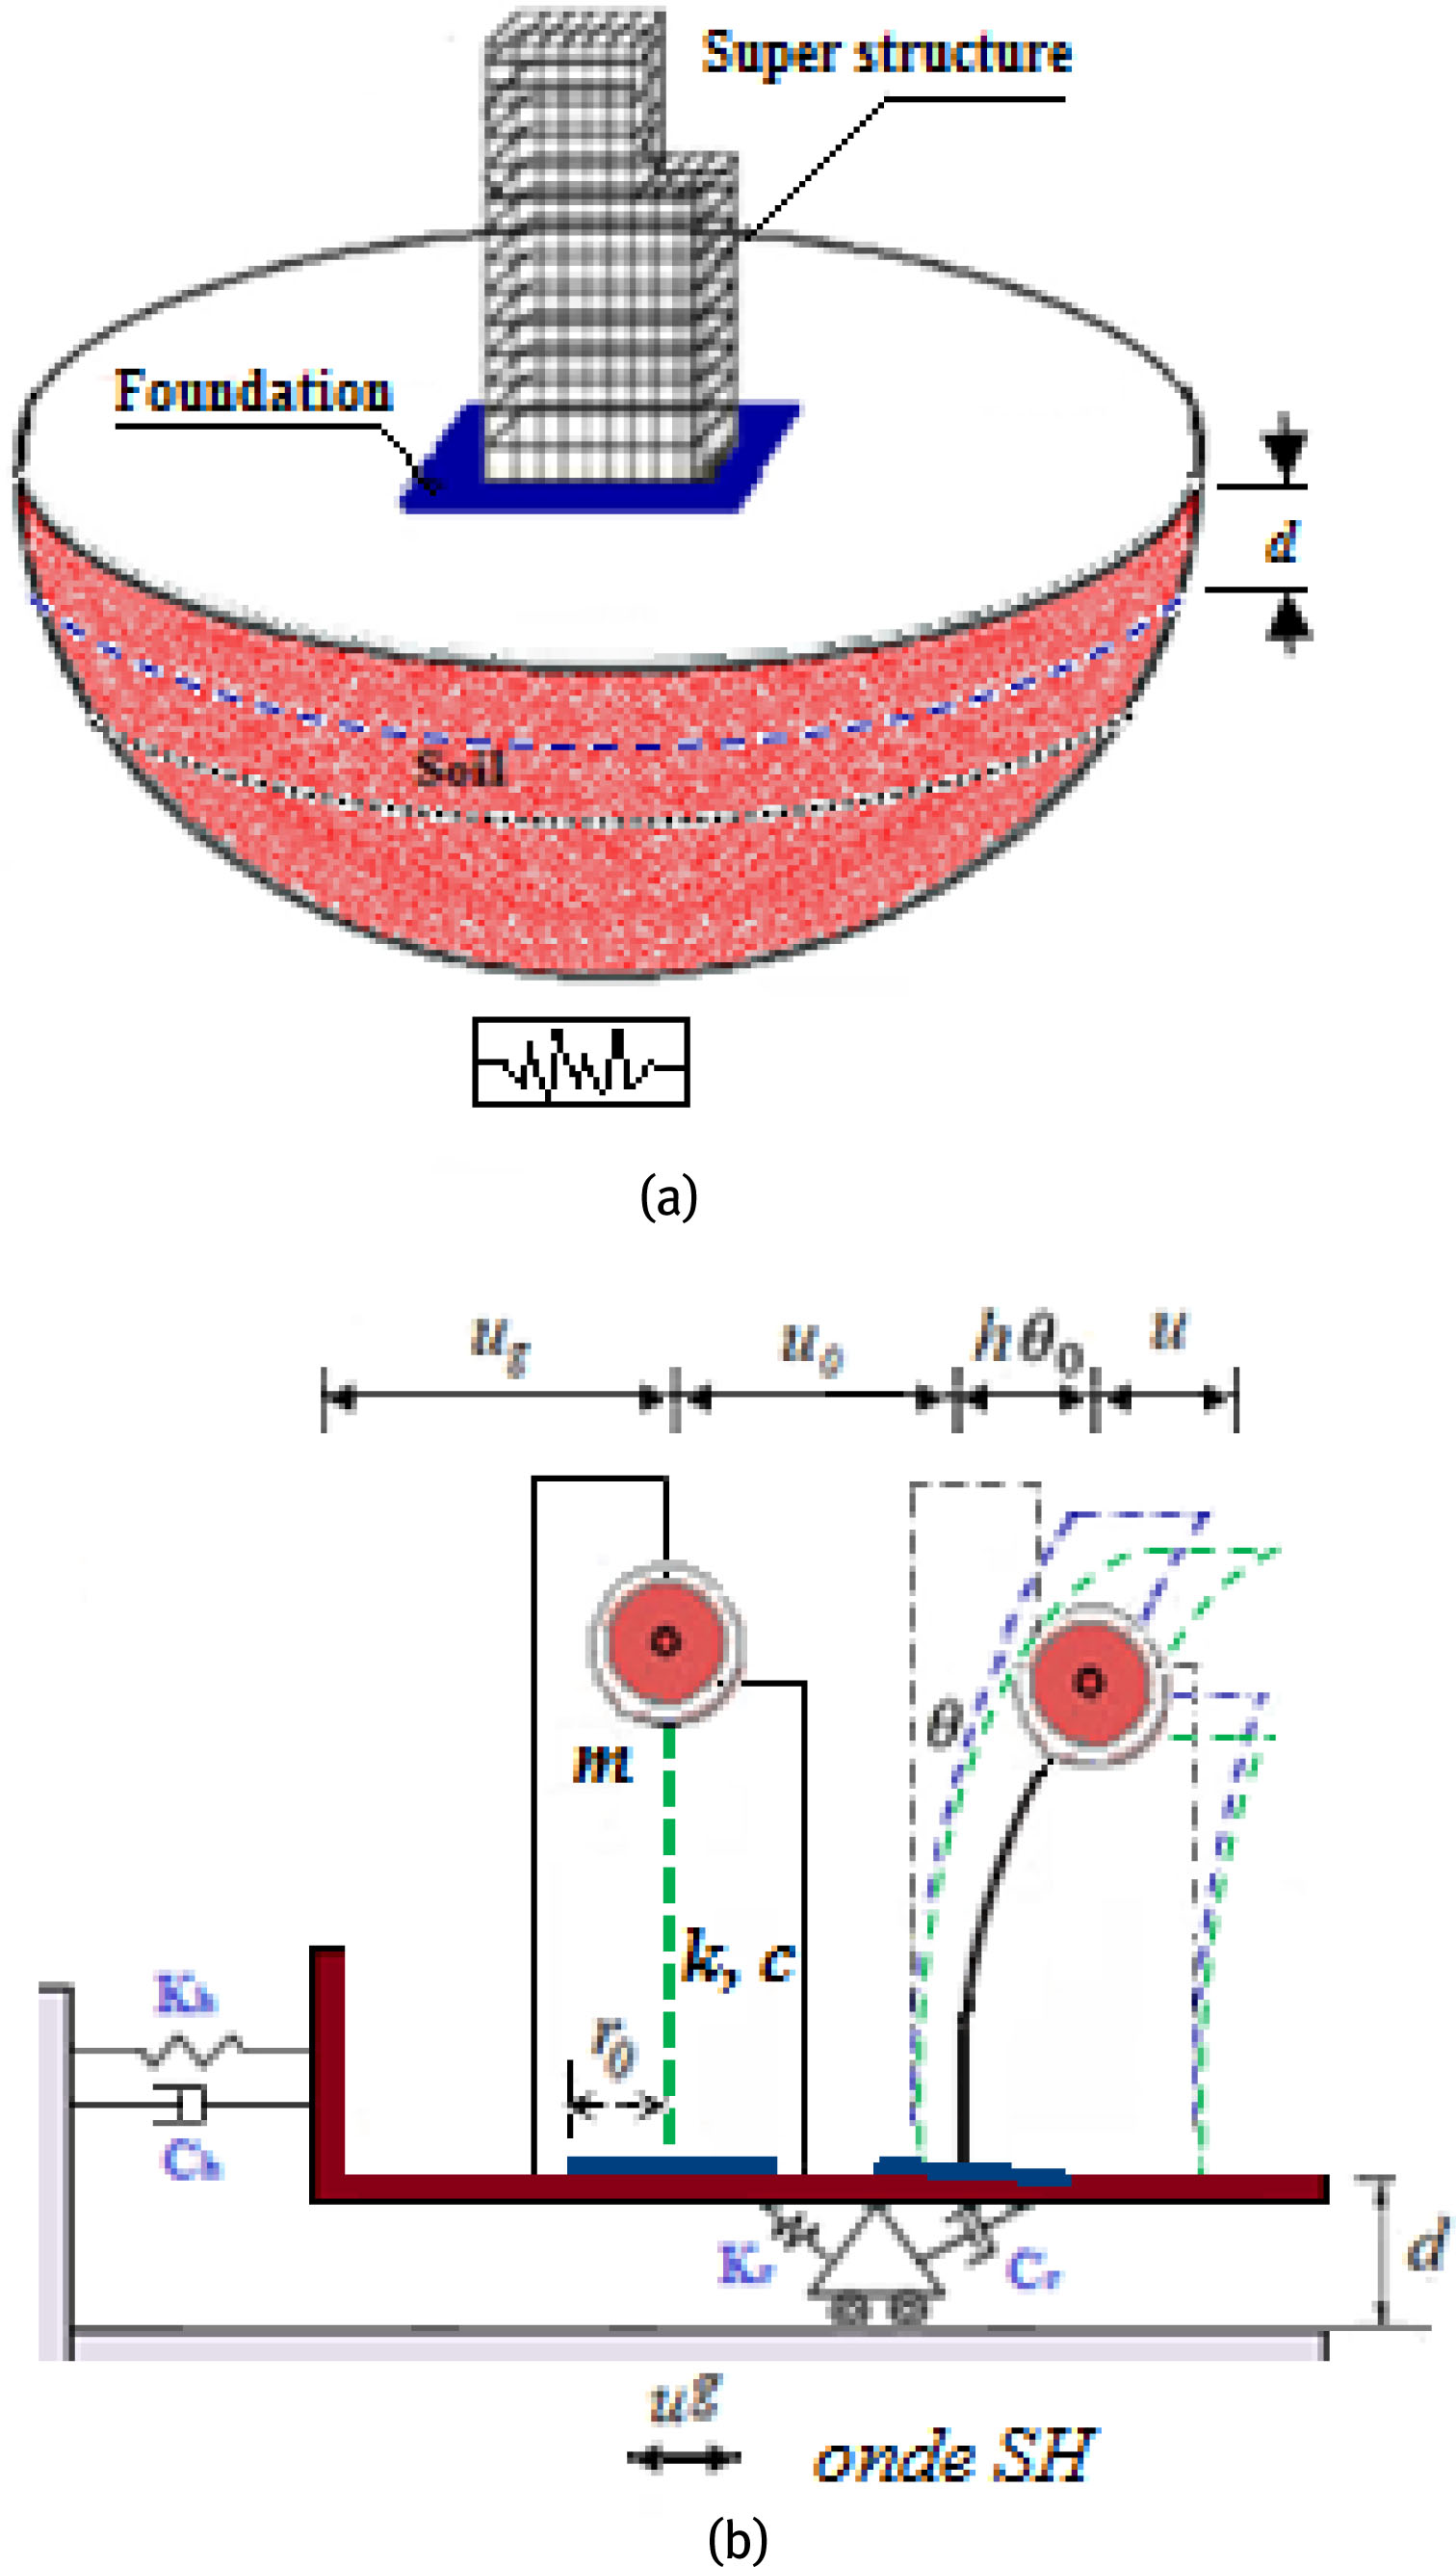
Figure 1
Modelling of SSI: (a) schematic view of SSI system, (b) equivalent SDOF system.
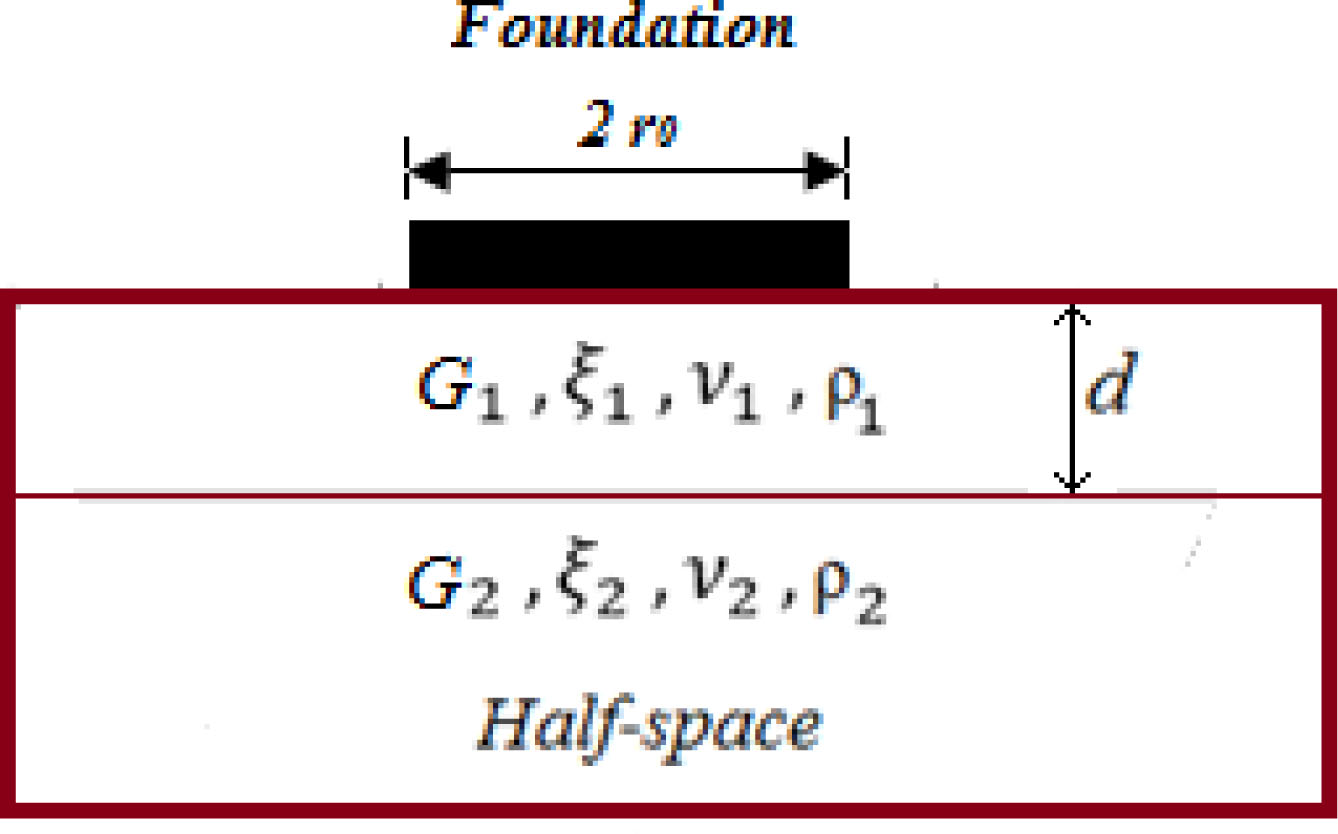
Figure 2
Model of a rigid circular footing on a soil layer underlain by elastic half-space.
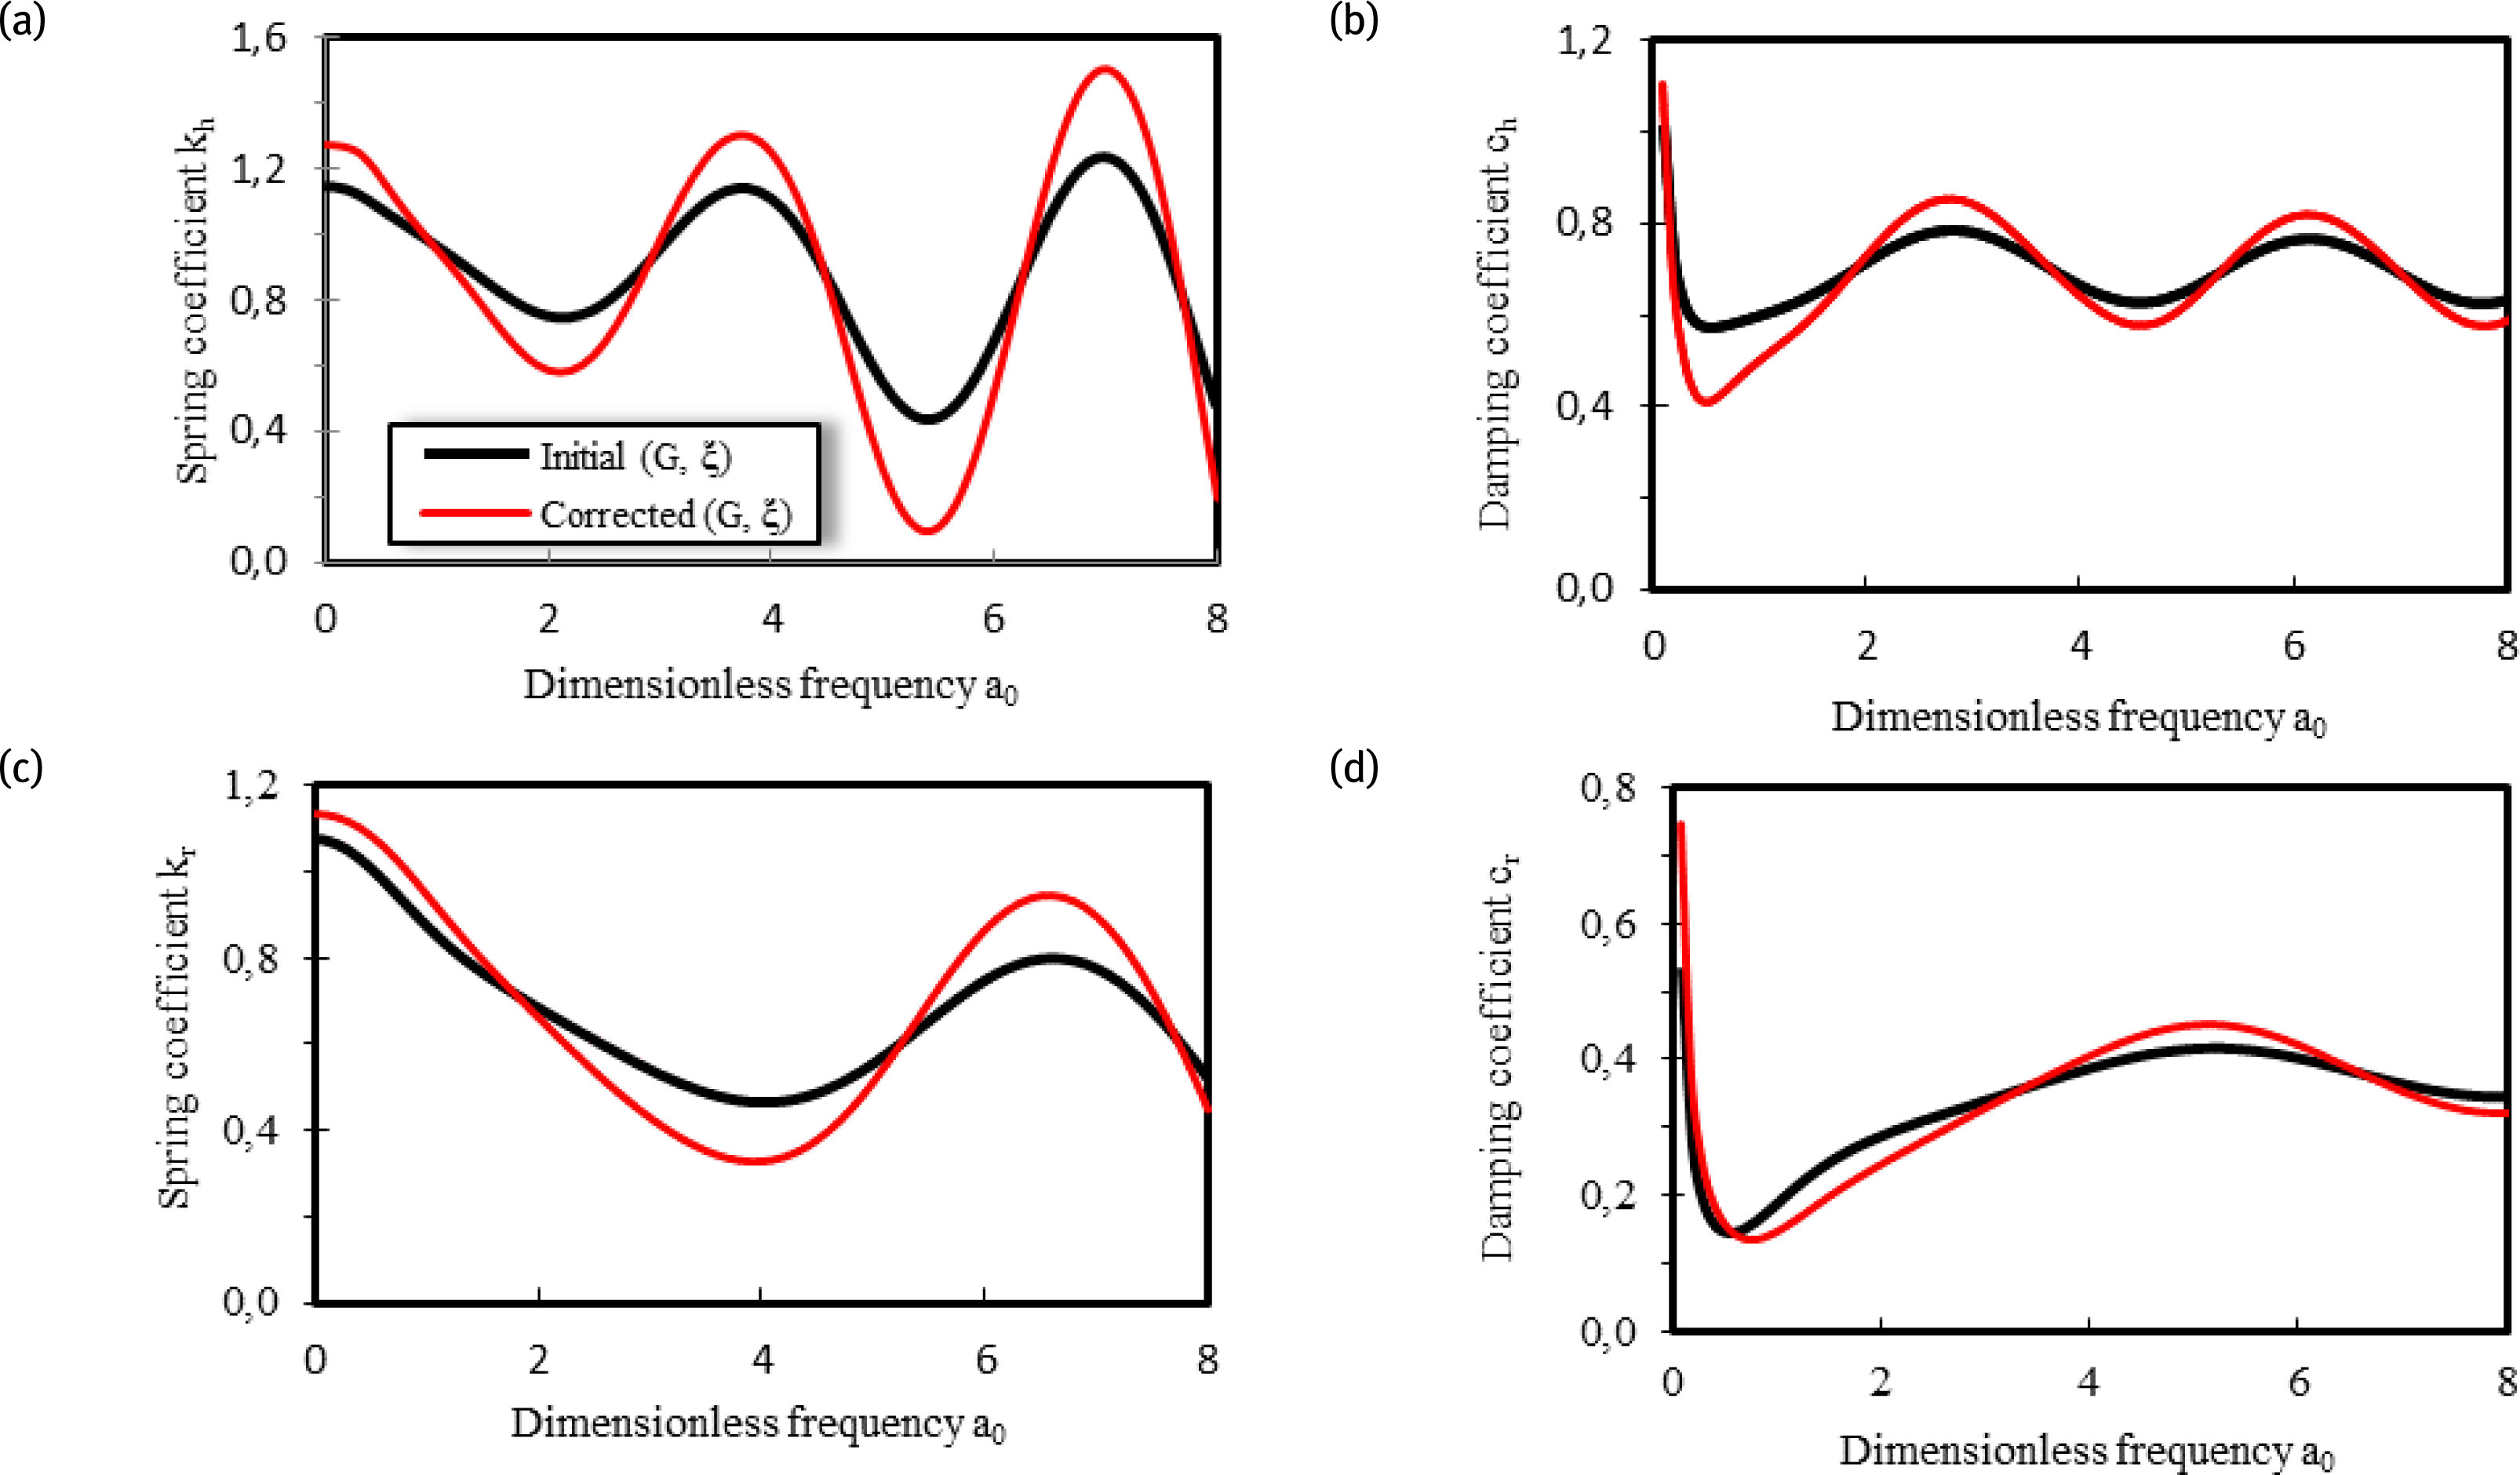
Figure 3
Impedance functions obtained before and after the correction of shear modulus and damping coefficient: (a) and (b) for horizontal motion, (c) and (d) for rotational motion.
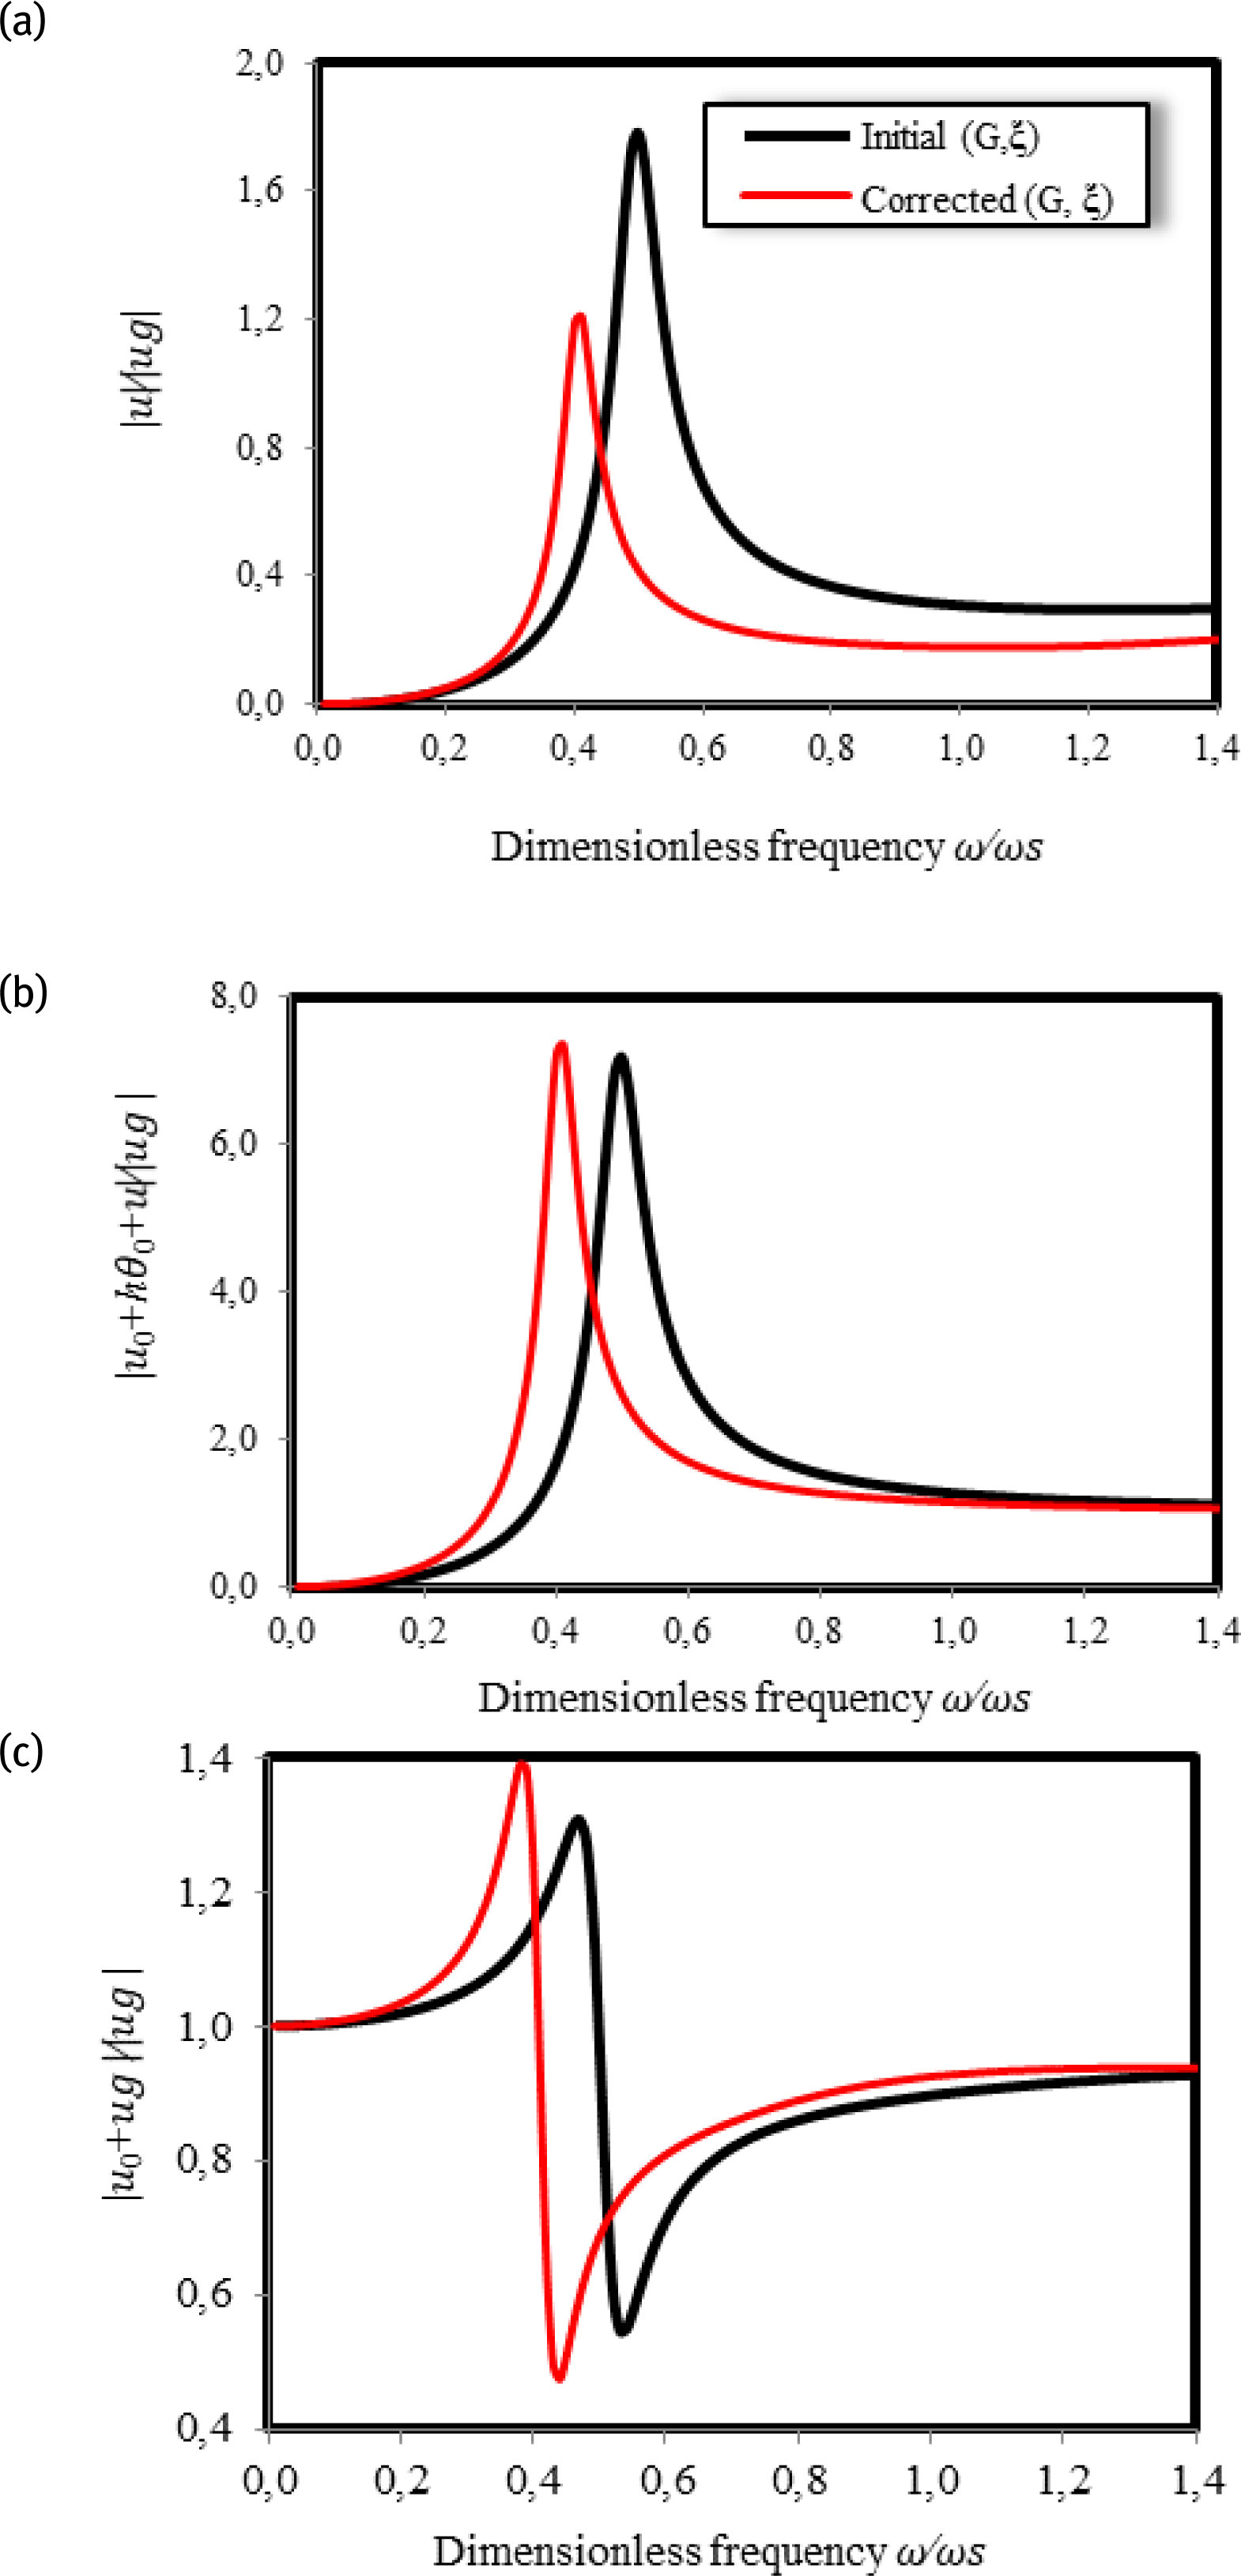
Figure 4
SSI response with respect to the free field before and after the correction of shear modulus and damping coefficients: (a) displacement of the structure, (b) displacement of the mass and (c) total displacement of the base.
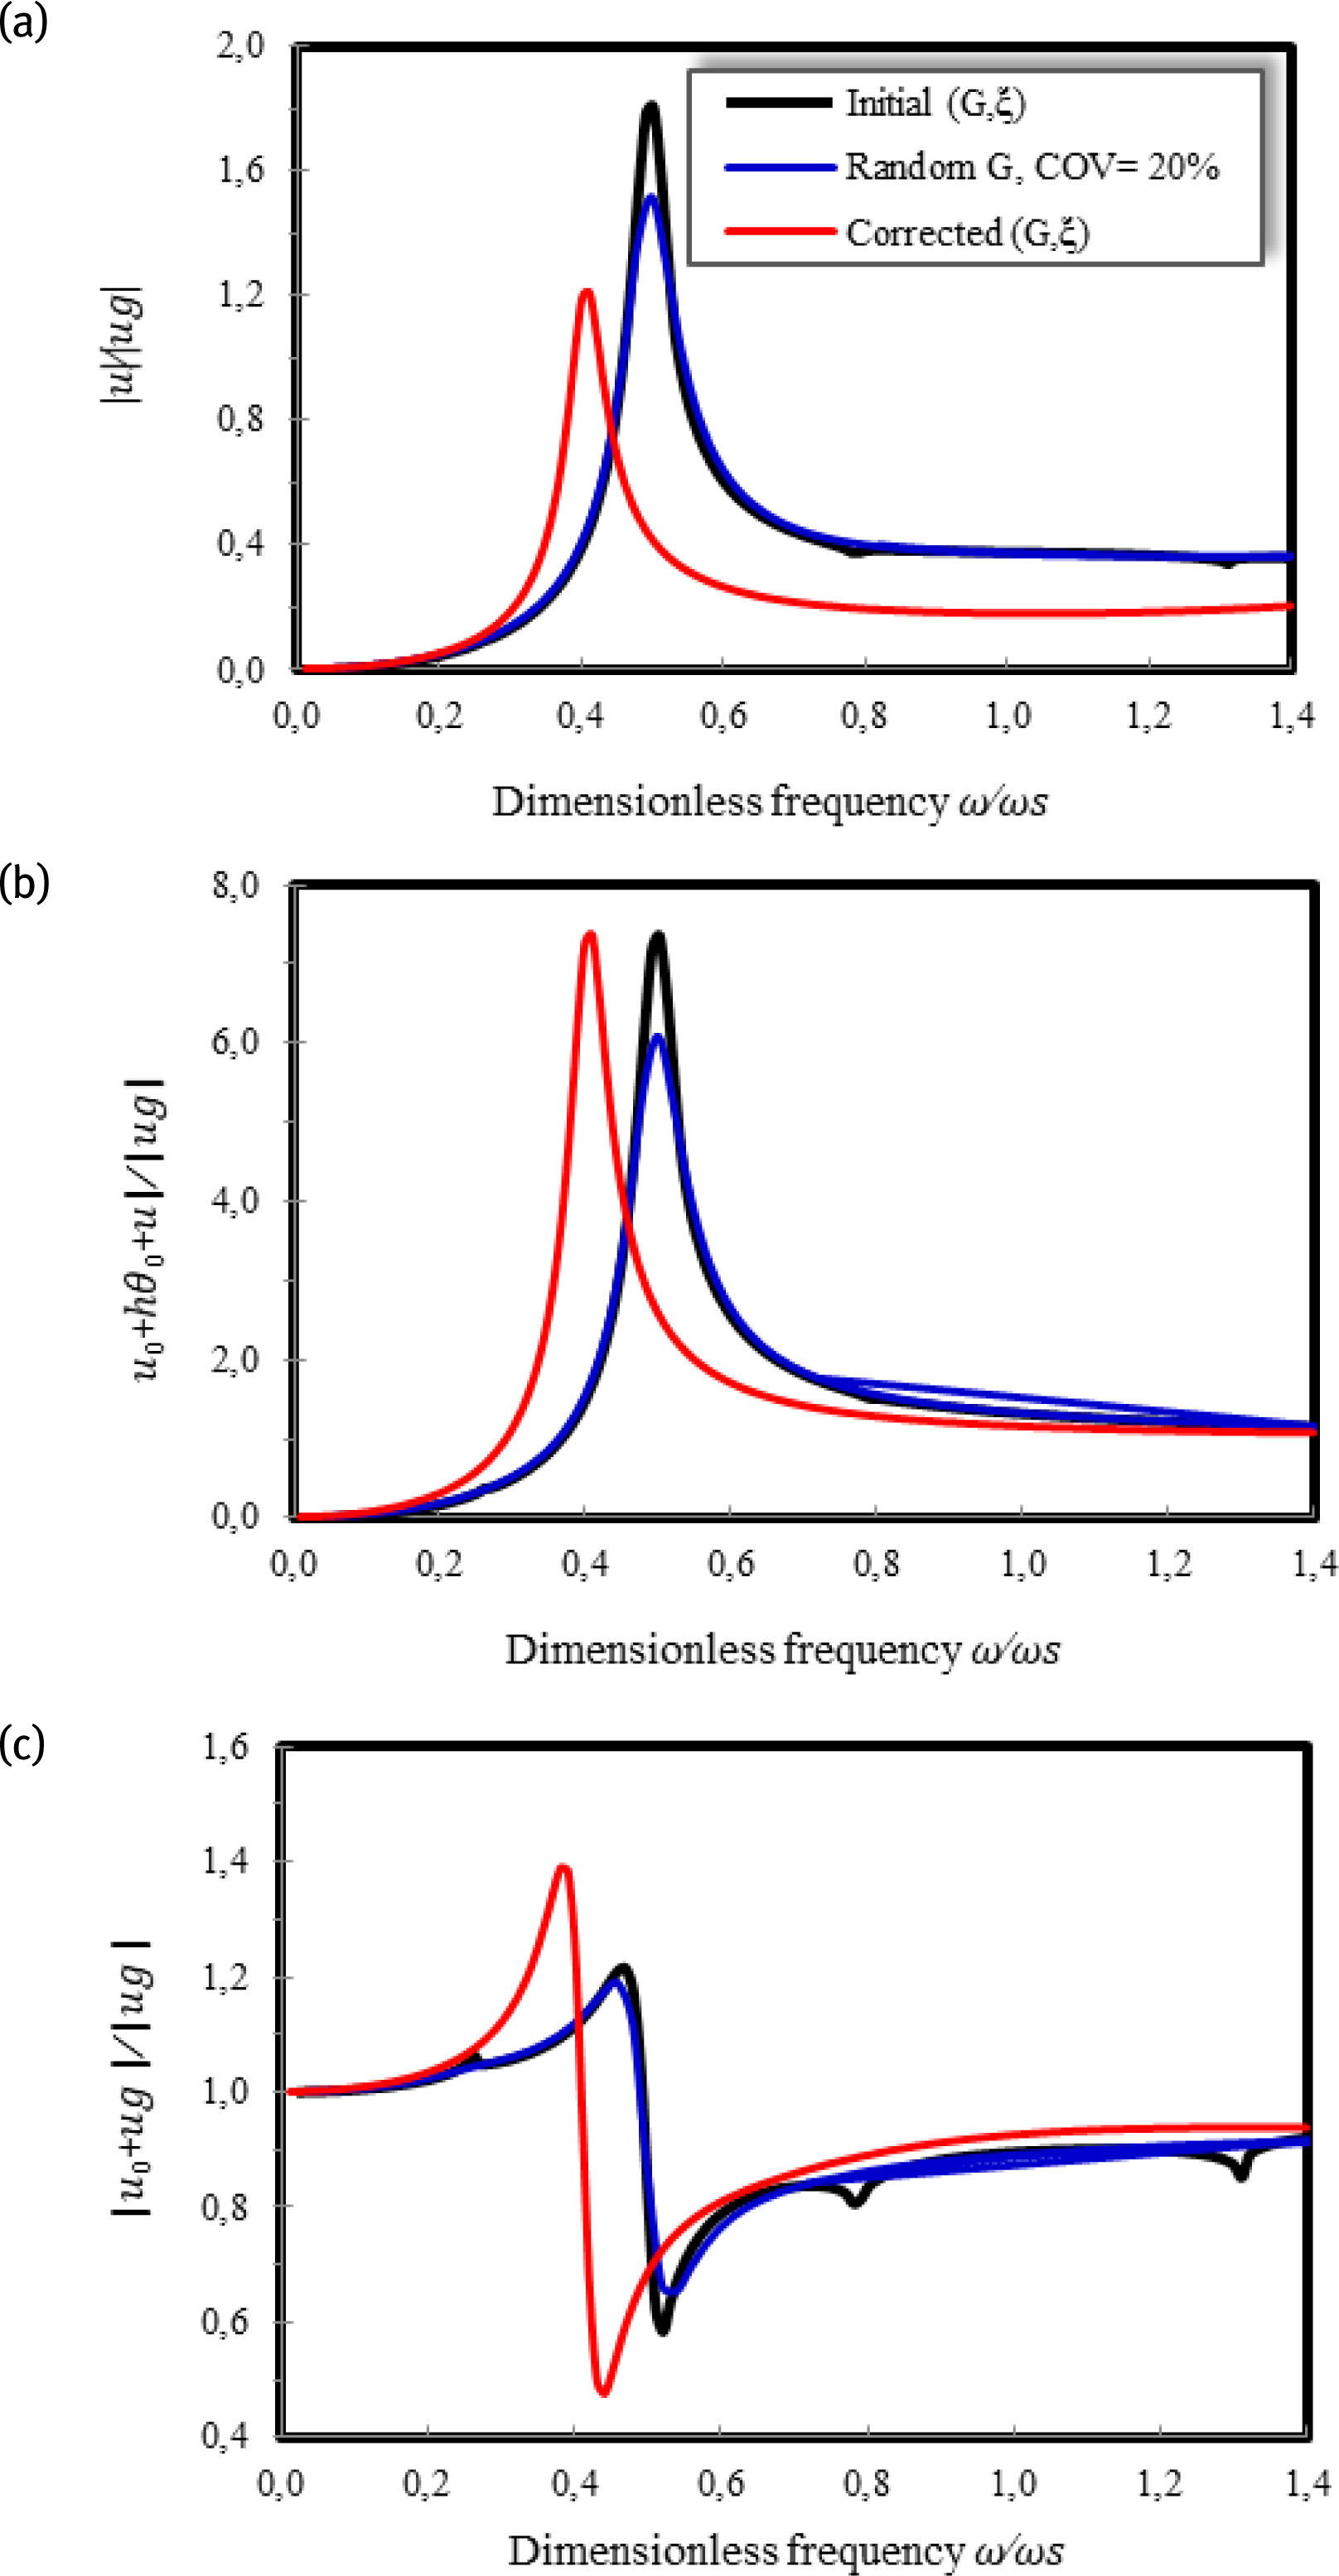
Figure 5
Comparison between stochastic (random G) and nonlinear (corrected G and ξ) SSI responses: (a) structure displacement, (b) mass displacement, (c) base displacement.
Table 1
Error margin (%) in displacements and frequency SSI system due to random G and corrected (G and ξ).
| SSI response | Deterministic | Stochastic (20% COV of G) | Nonlinear | Error margin (%) | |
|---|---|---|---|---|---|
| 20% COV of G vs. initial G | Corrected (G & ξ) vs initial G | ||||
| |u|/|ug| | 1.81 | 1.51 | 1.21 | − 16.6% | − 33.1% |
| |u0+hθ0+u|/|ug | 7.35 | 6.07 | 7.37 | − 17.4% | + 0.3% |
| |u0+ug|/|ug| | 0.86 | 0.86 | 0.95 | ±00.0% | + 10.4% |
| Frequency (ω/ωs) | 0.5 | 0.5 | 0.41 | ±00.0% | −18.0% |
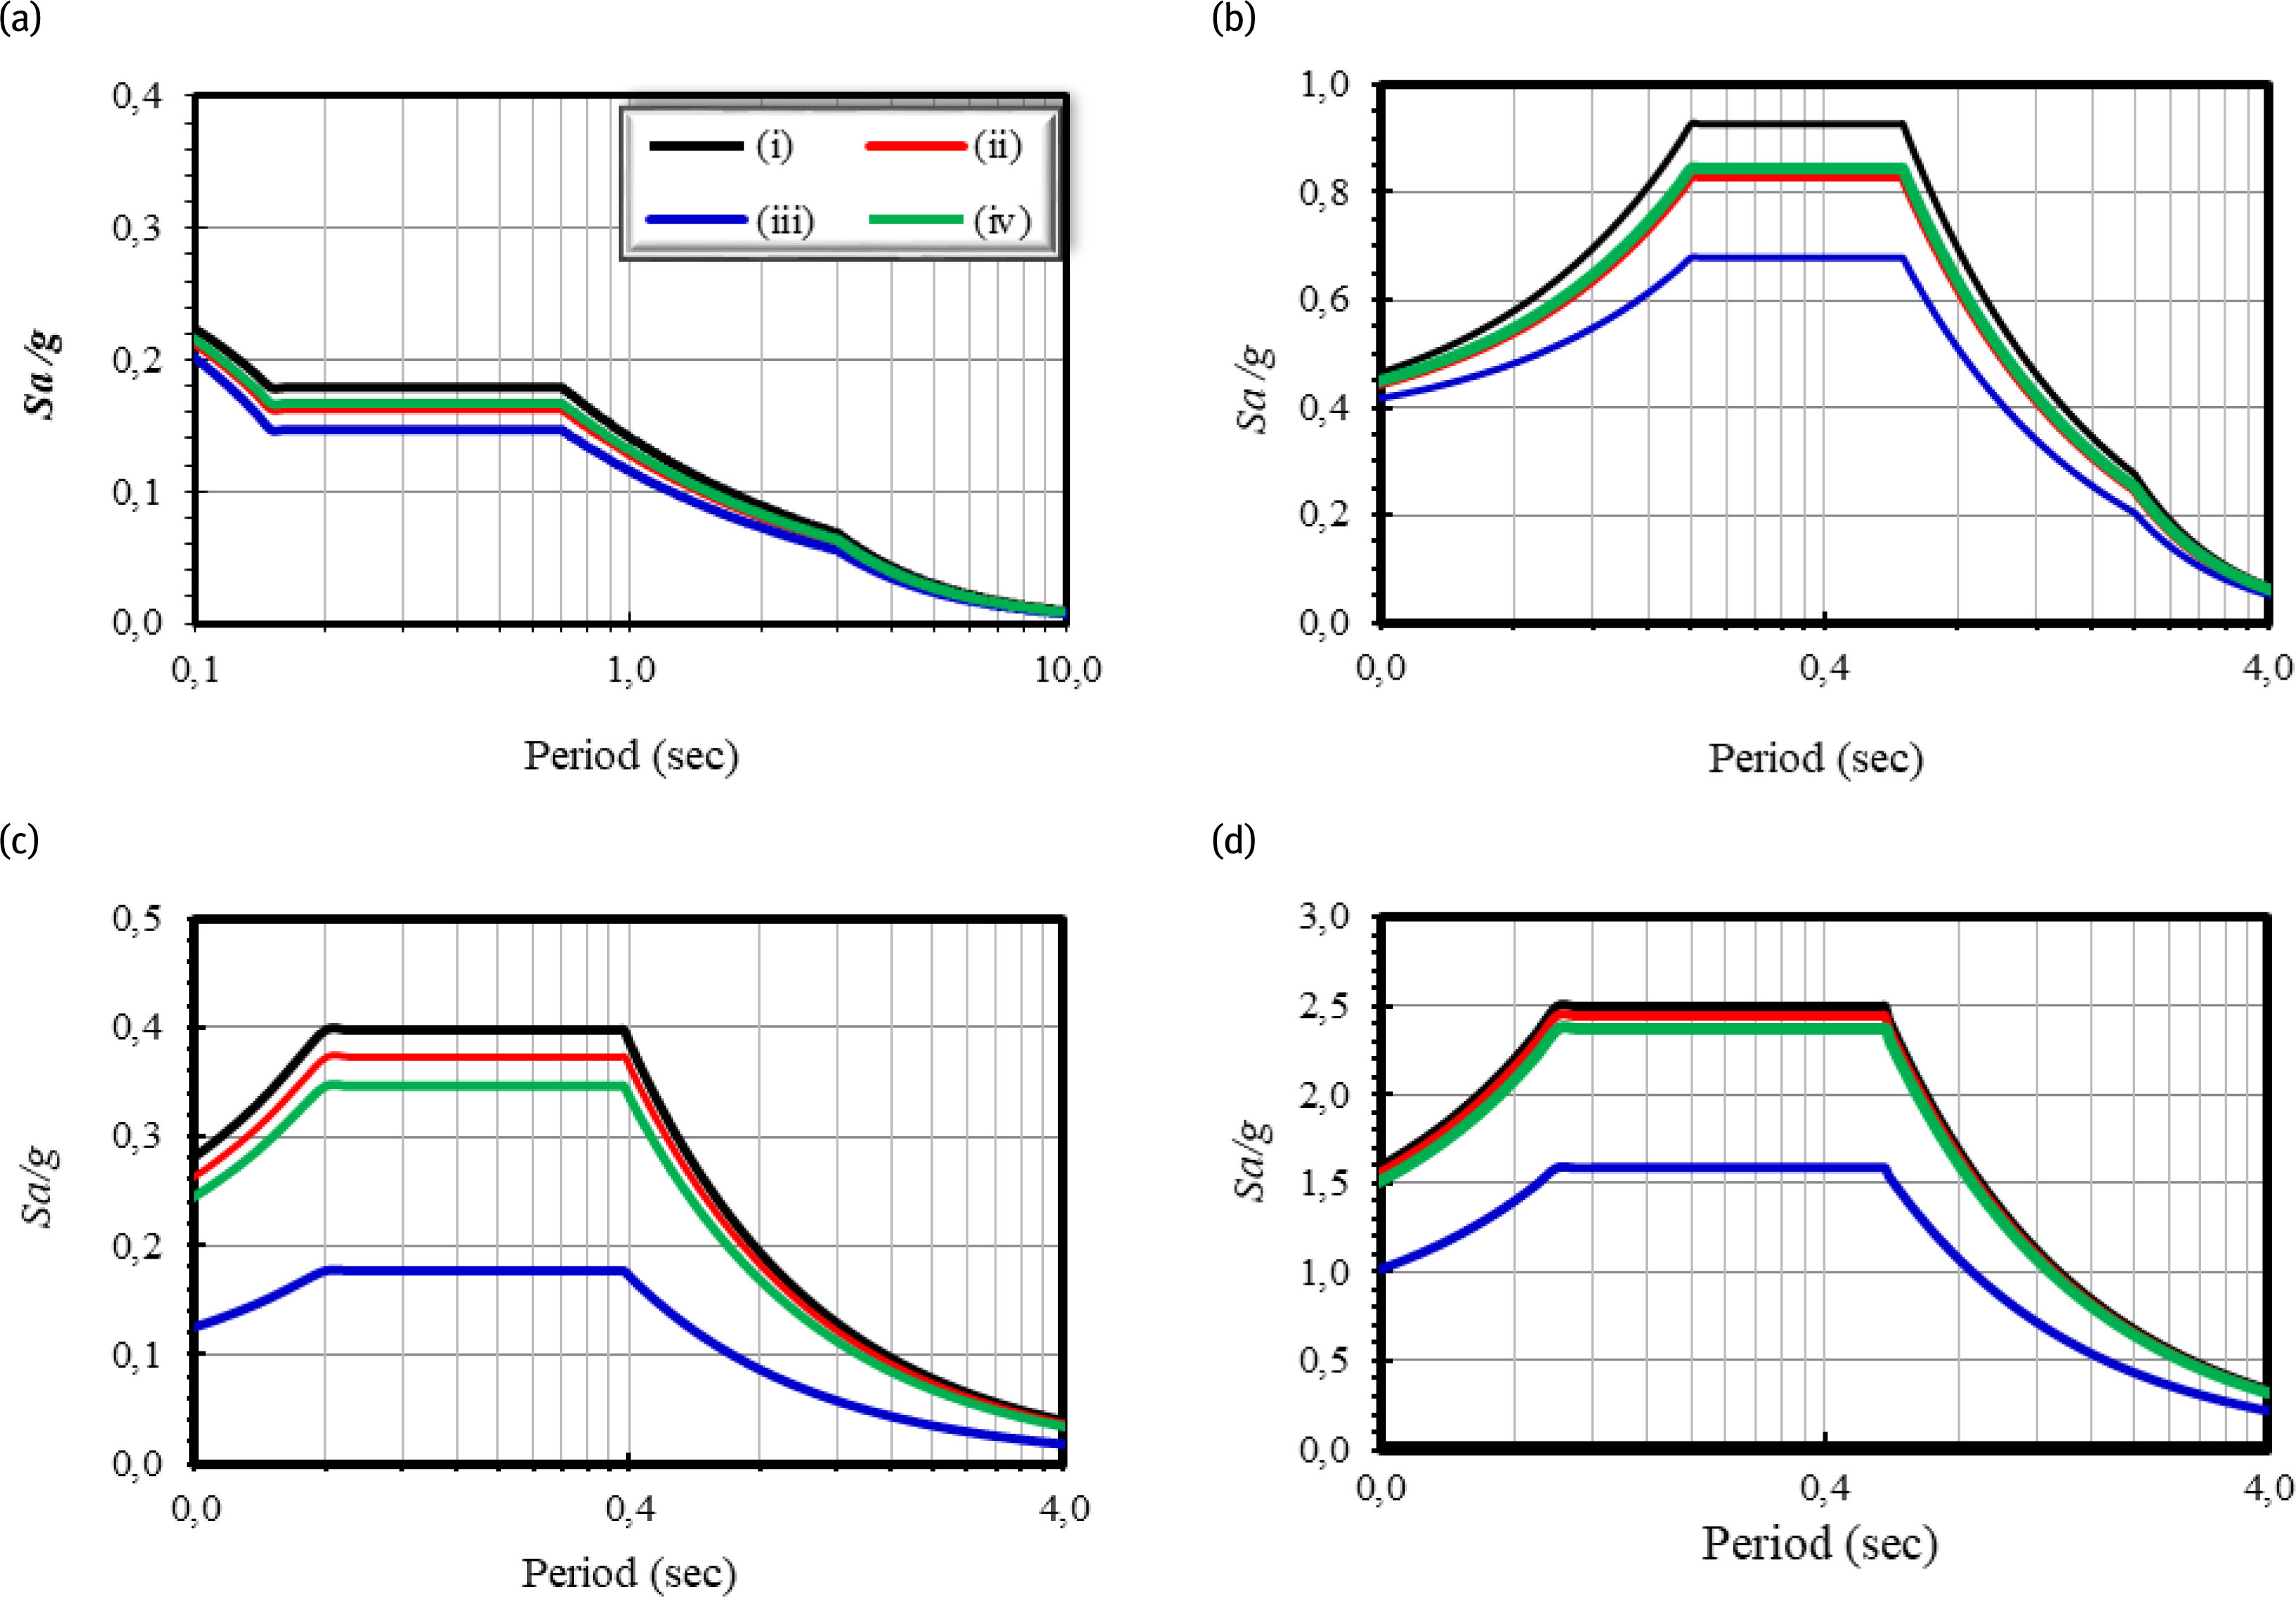
Figure 6
Design response spectrum: (a) RPA99-2003, (b) EC8-2004, (c) IBC-2015 and (d) IS-1893-2002.
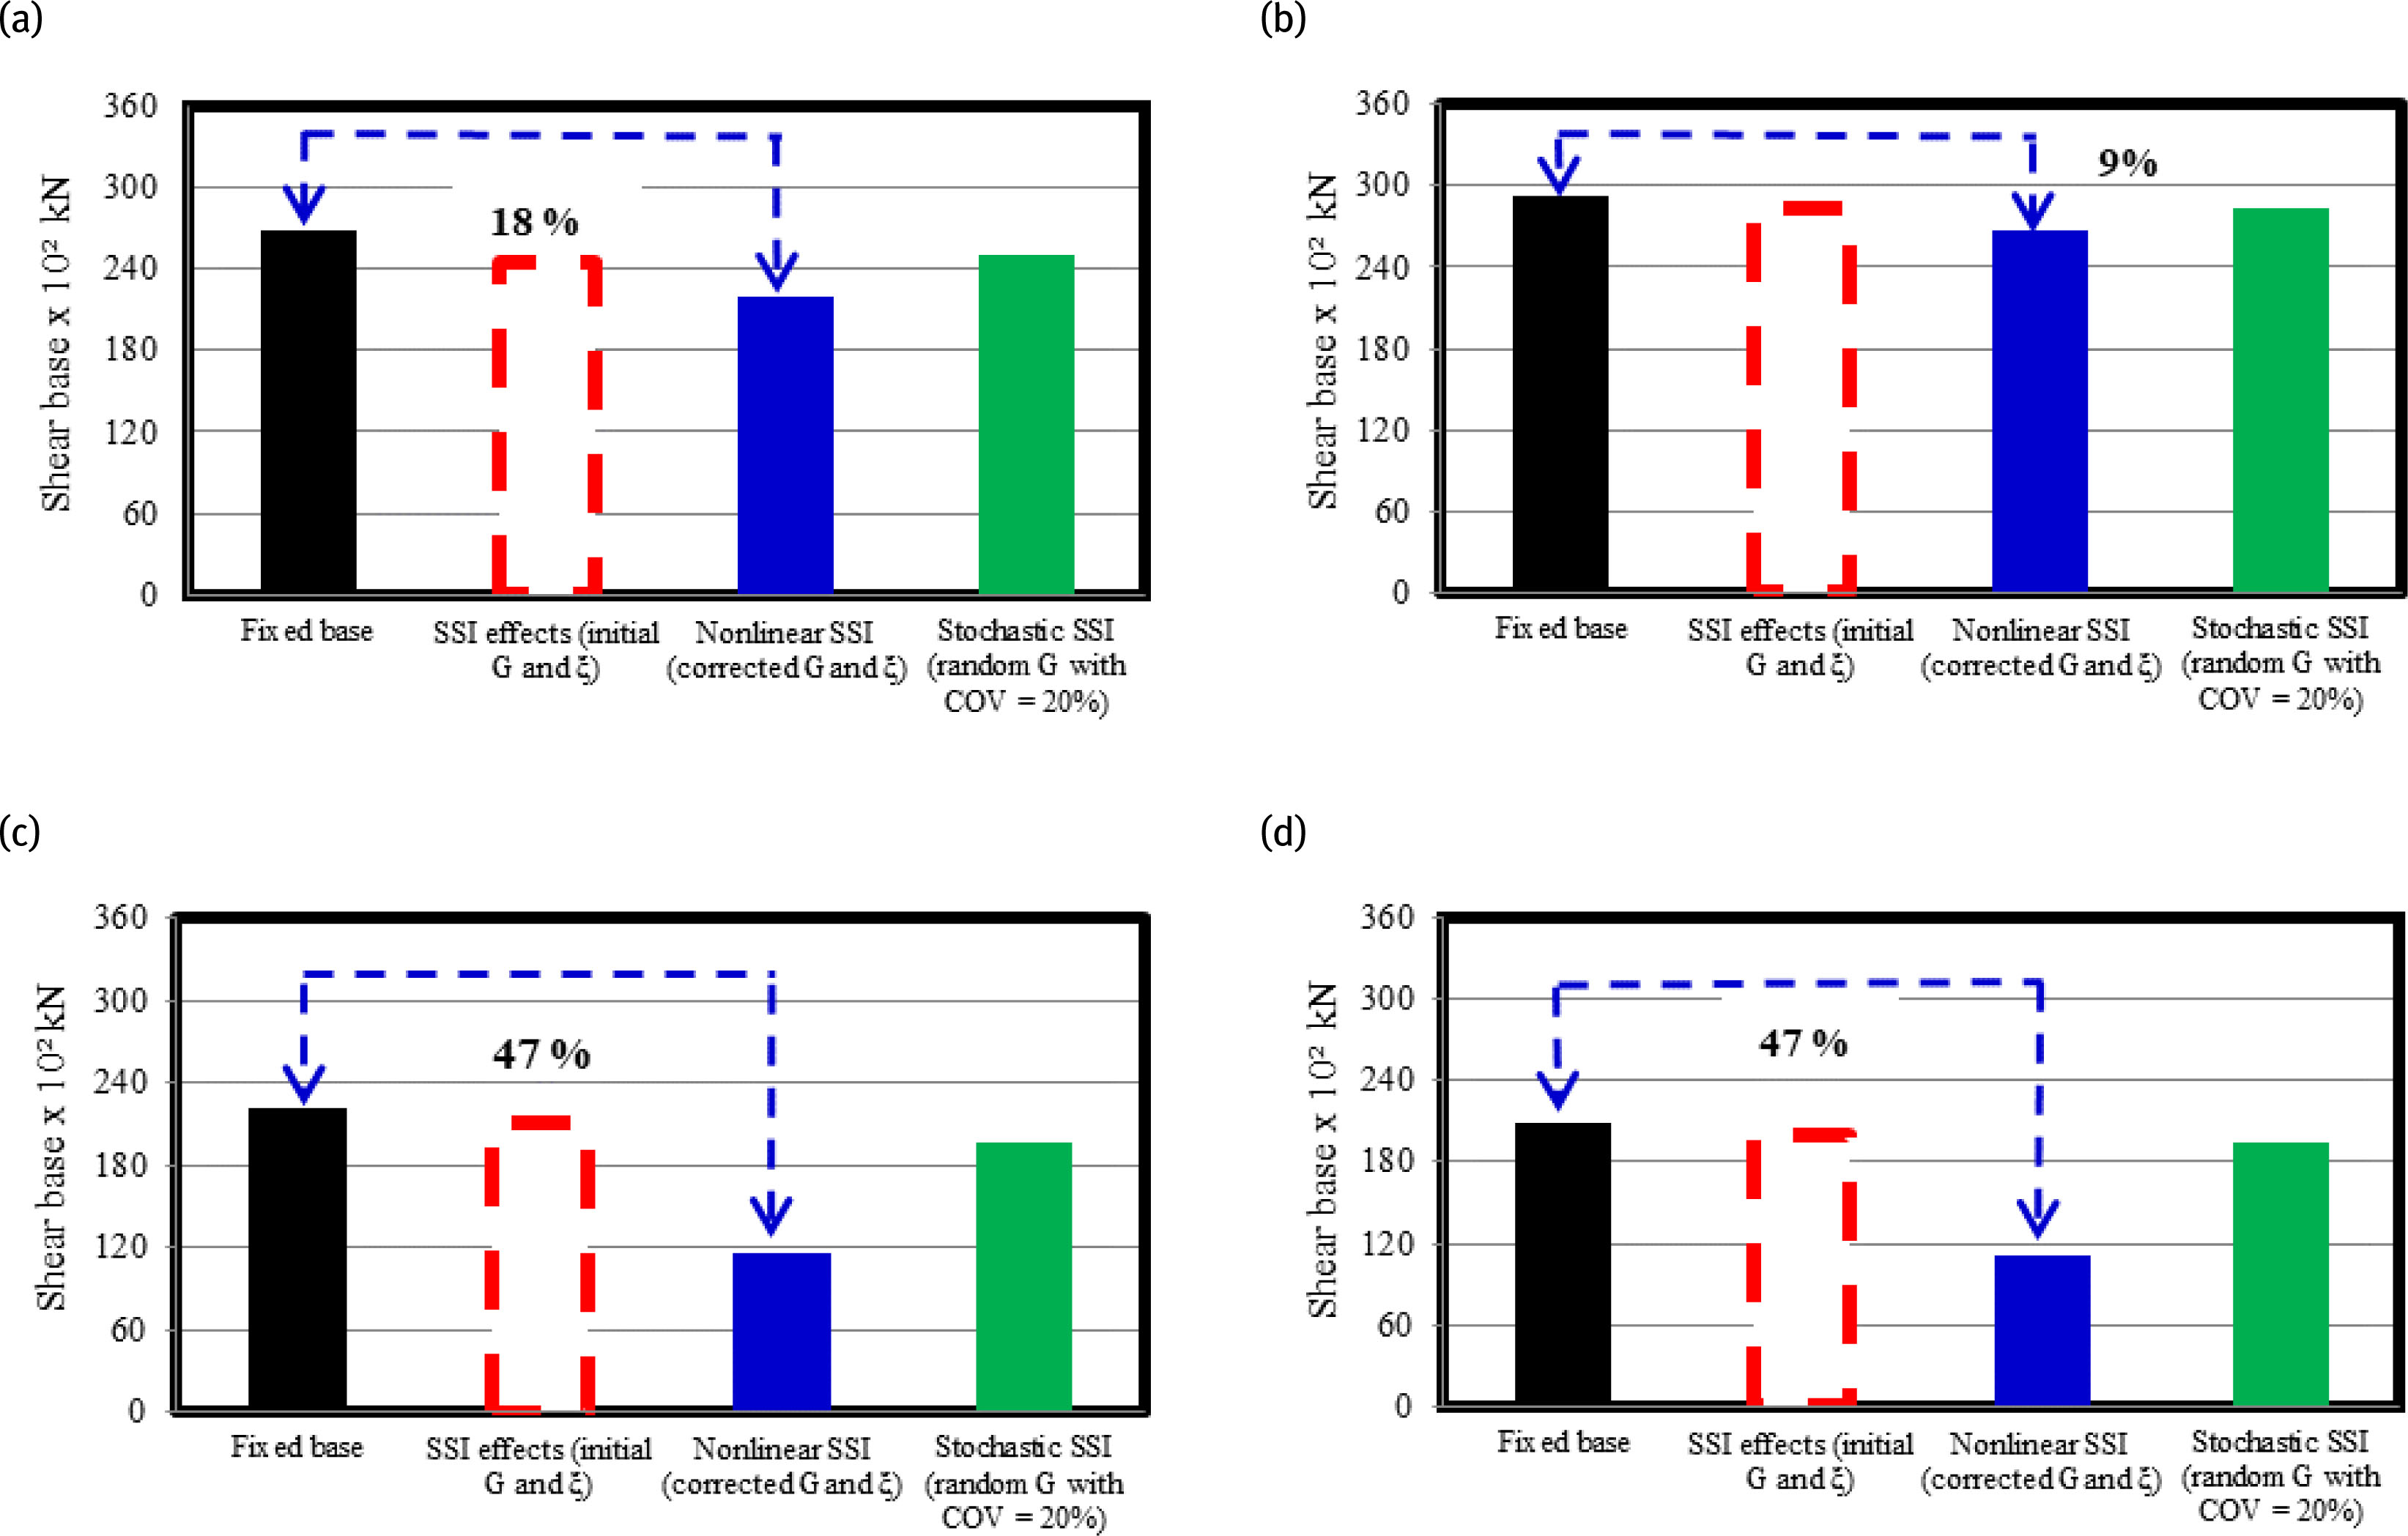
Figure 7
Base shear forces: (a) RPA99-2003, (b) EC8-2004, (c) IBC-2015 and (d) IS-1893-2002.
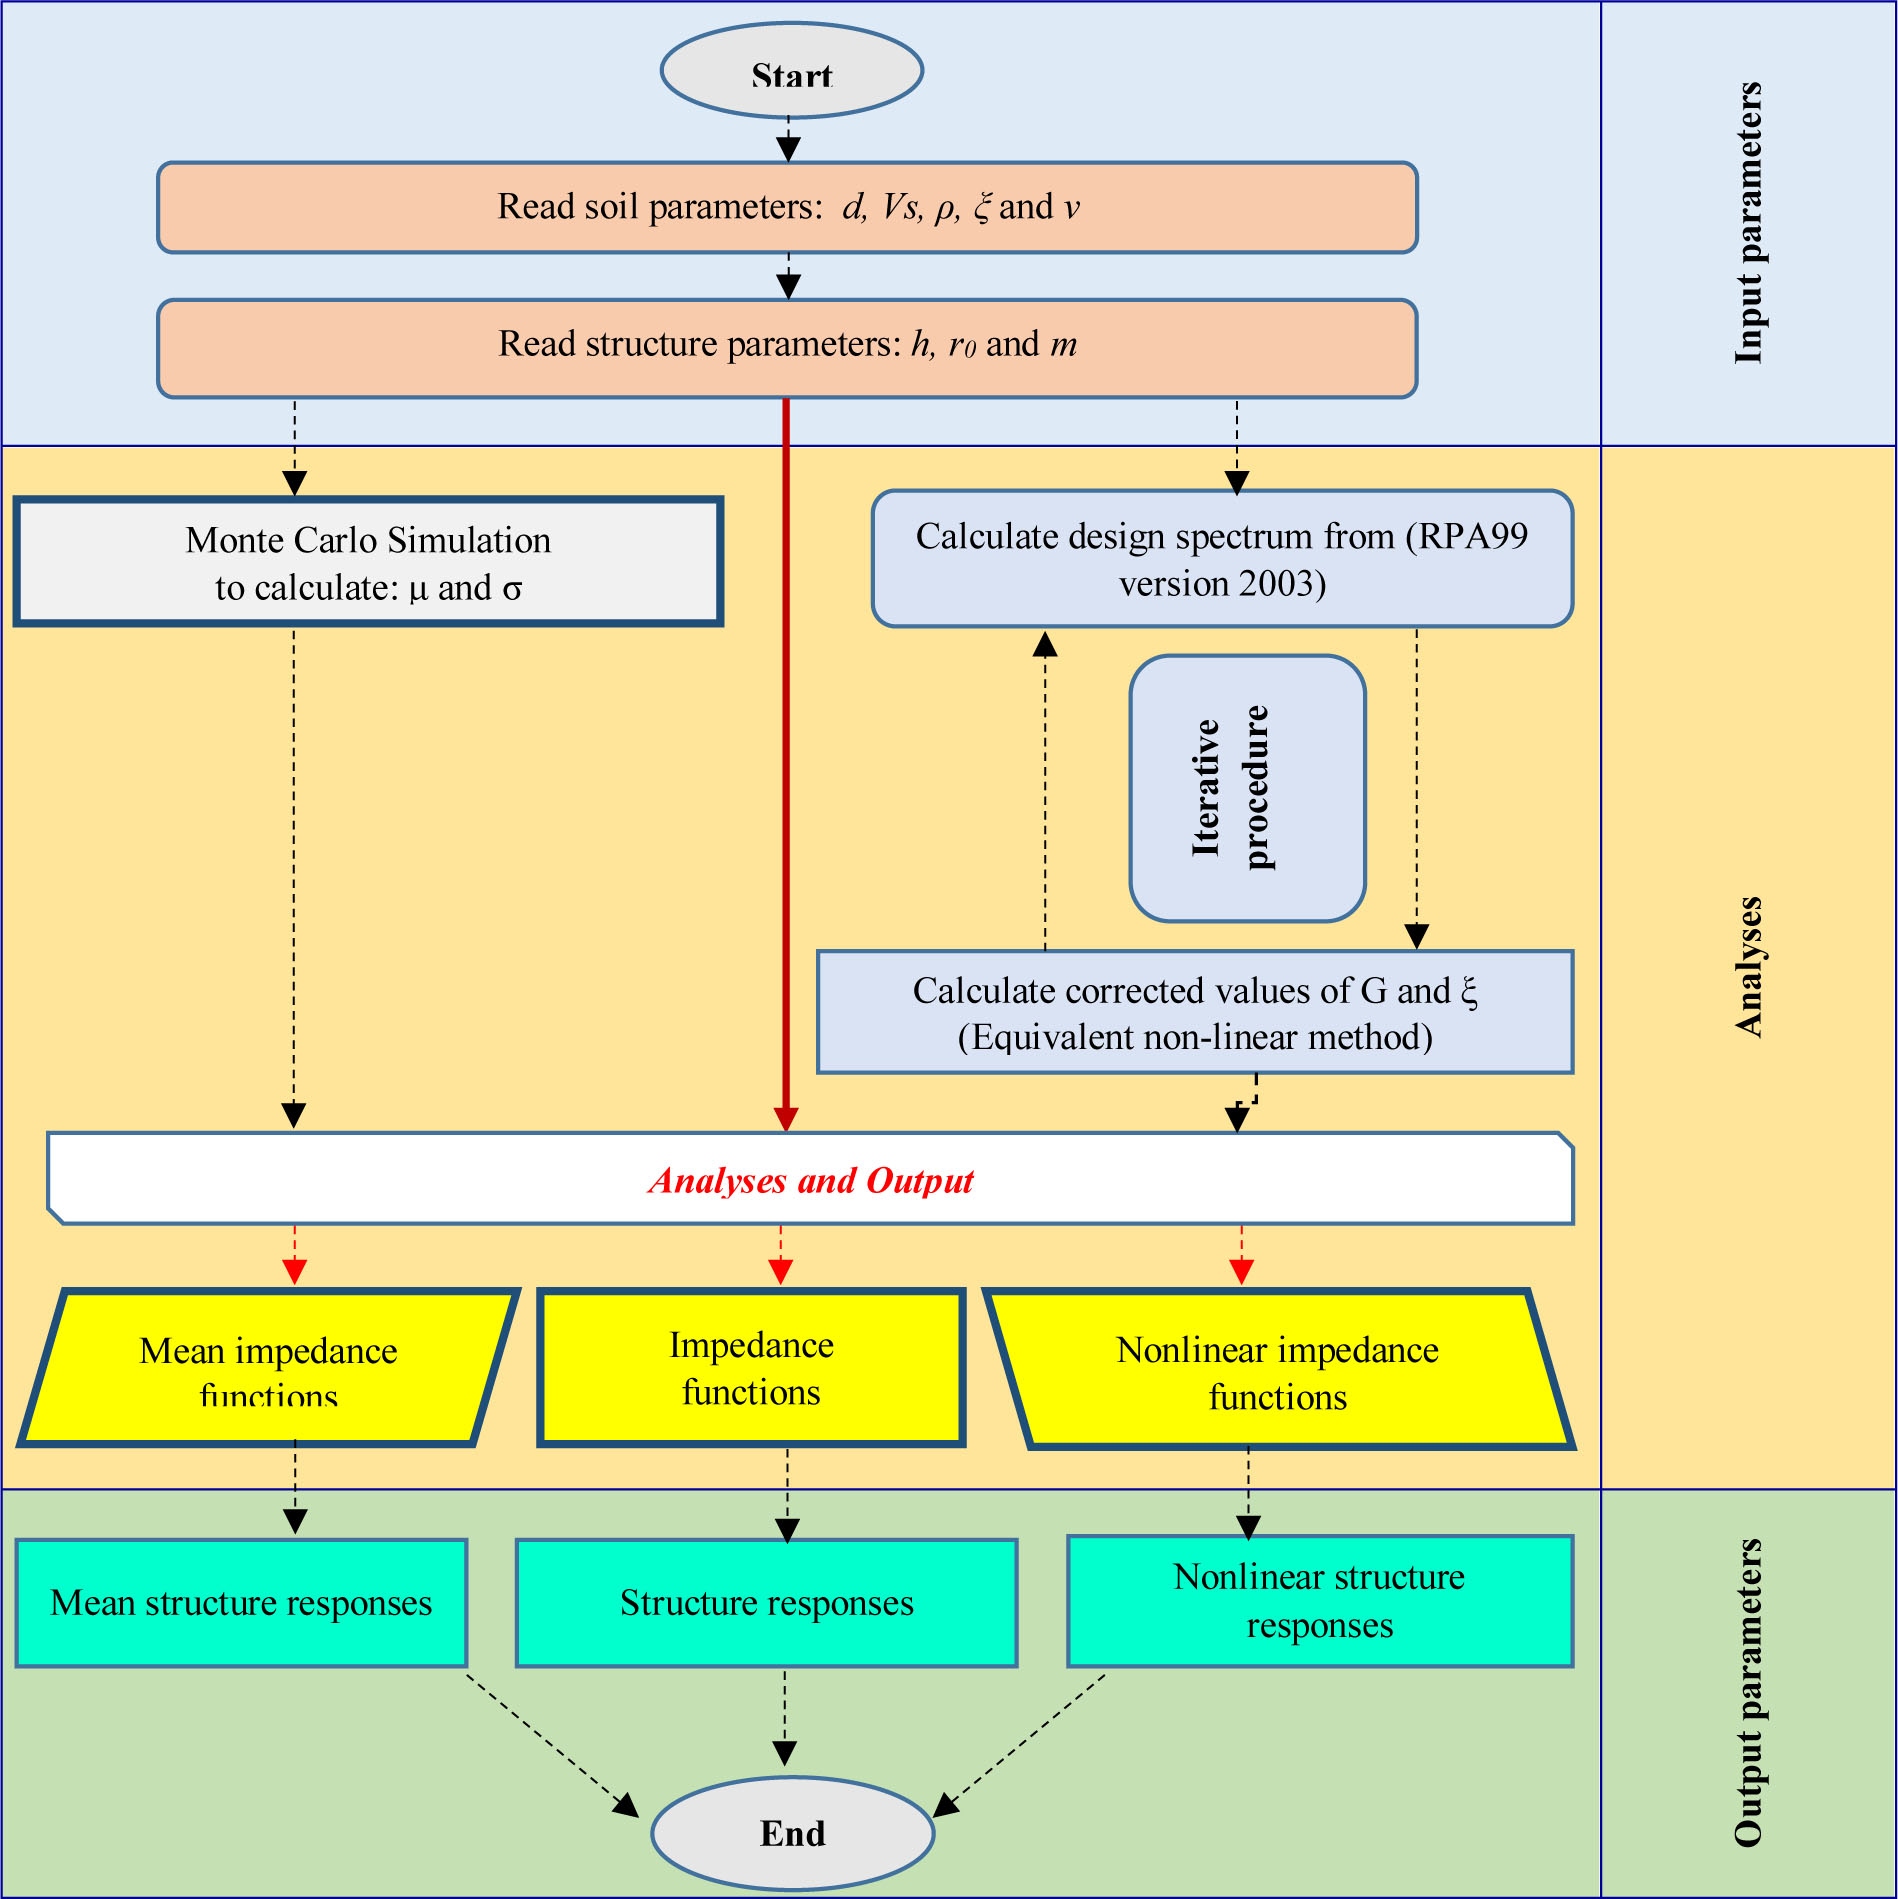
Figure 8
Flow chart of method analysis steps