
Table 1
Different approaches used for evaluation of the Kersten number Ke and the conductivity of dry and saturated soil.
| Model | Kersten number | Thermal conductivity of | |
|---|---|---|---|
| dry soil | saturated soil | ||
| Johansen (1975) | Coarse-grained soil:Ke ≅ 0.7 log Sr + 1.0 Fine-grained soil:Ke ≅ log Sr + 1.0 | ||
| Côté and Konrad (2005a; 2005b) | λdry = χ10−ηn | - | |
| Lu et al. (2007) | λdry = 0.51 − 0.56n | - | |
| He at al. (2017) | - | - | |
[i] where:
λw – thermal conductivity of water,
λs – thermal conductivity of soil solids,
n – porosity,
κ – parameter reflecting the type of soil: 4.60 for gravel and coarse sand; 3.55 for medium and fine sands; 1.90 for silt and clay; 0.60 for organic soils,
χ, η – parameters reflecting the type of soil and grain shape: χ = 0.30 and η = 0.87 for organic soils; χ = 0.75 and η = 1.20 for mineral soils,
α – parameter depending on the type of soil: 0.96 or 0.27, respectively for coarse- or fine-grained soils,
A, B – fitting parameters.
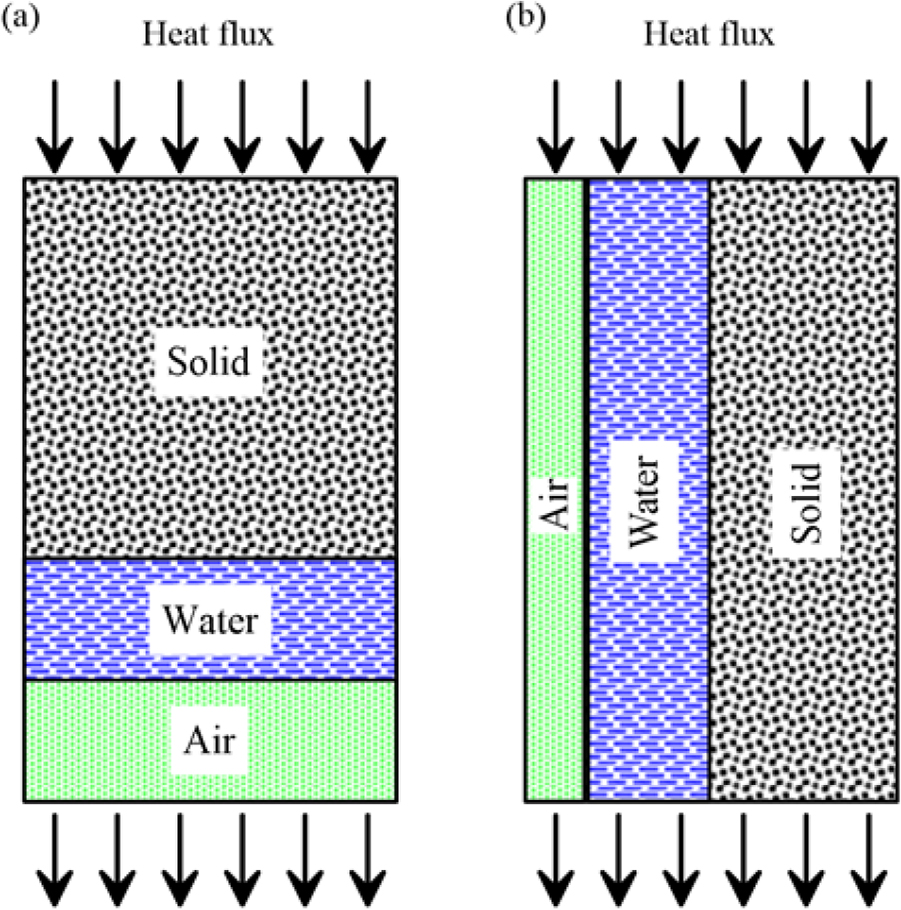
Figure 1
Wiener model scheme (Wiener, 1912): (a) series model - lower limit; (b) parallel model - upper limit.
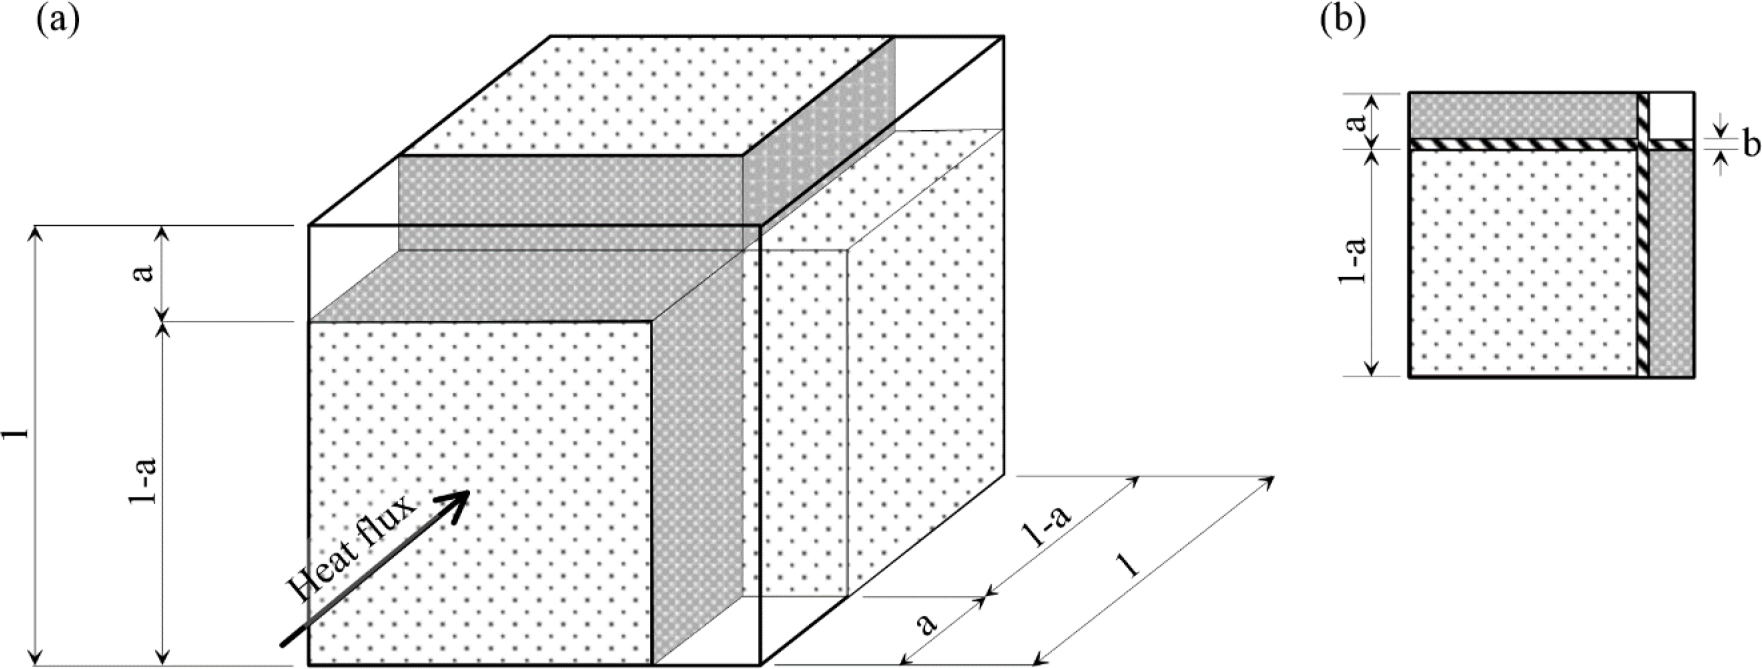
Figure 2
The unit cube considered by Mickley (Farouki, 1981): (a) isometric view; (b) lateral view showing the water layer.
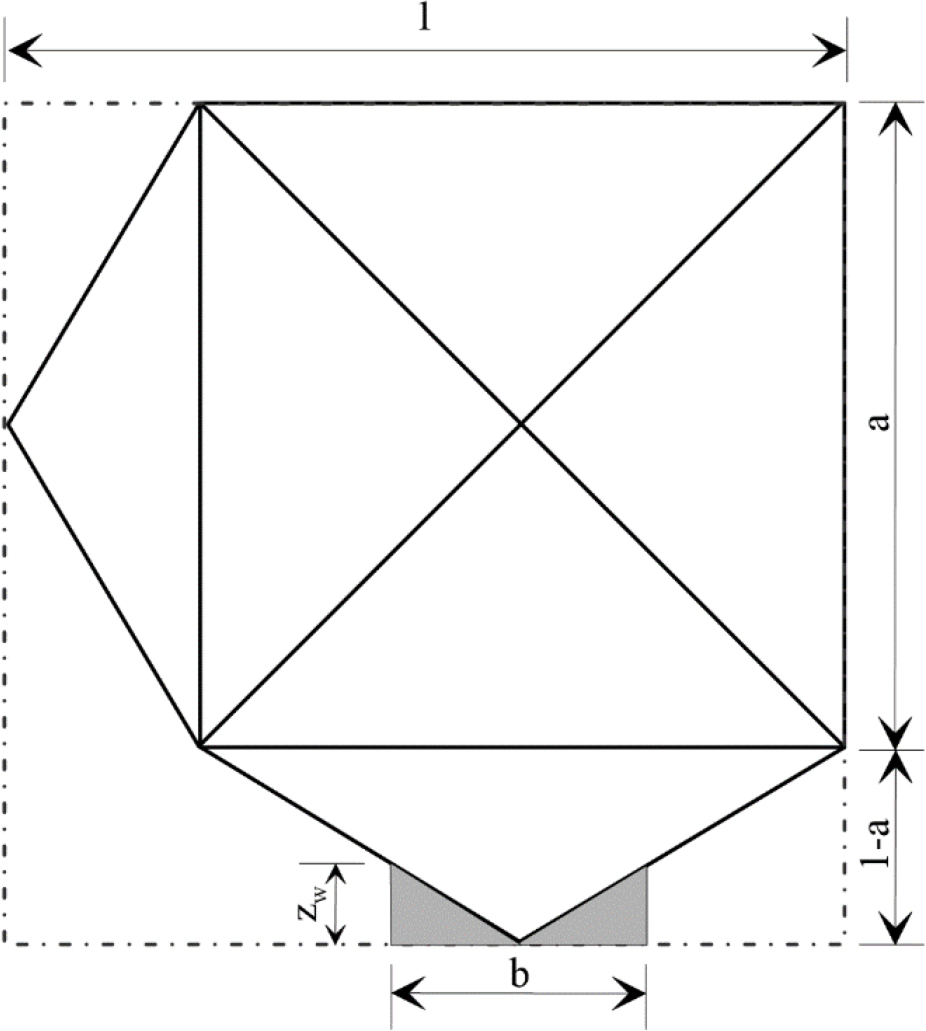
Figure 3
An idealized grain model according to Gemant (Farouki, 1981).
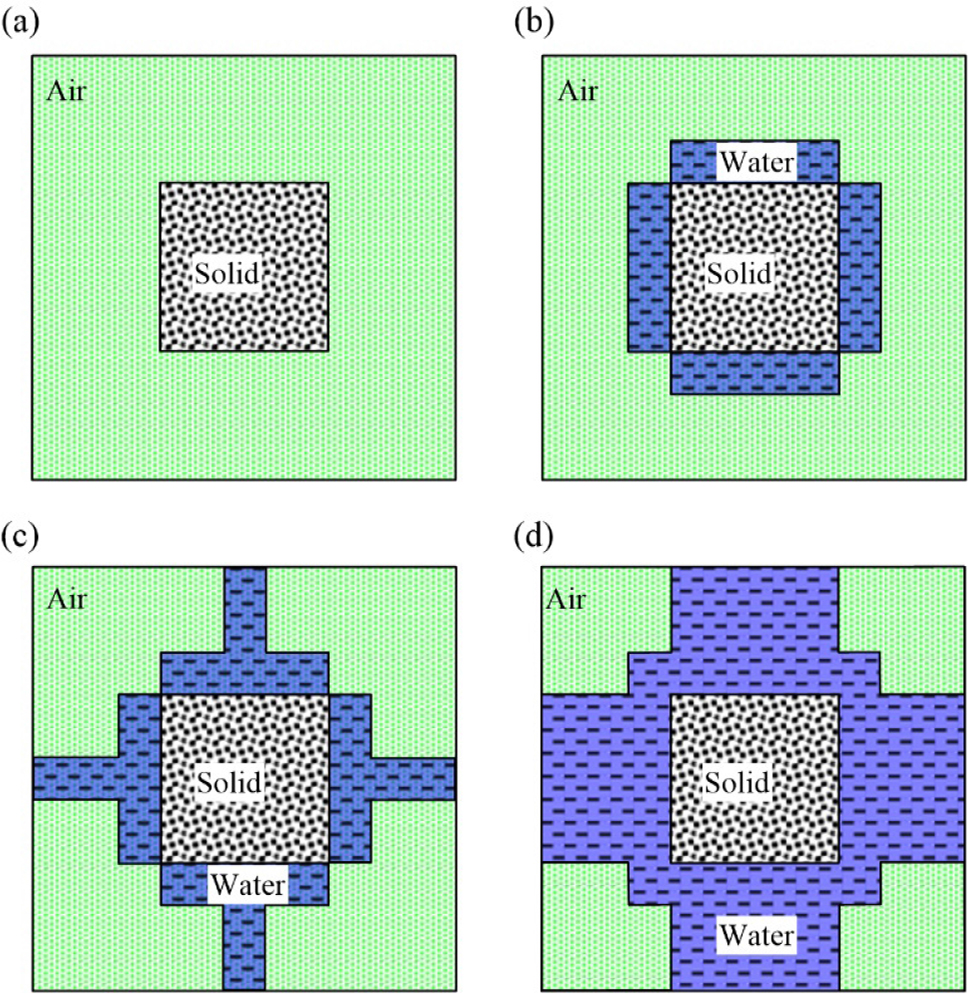
Figure 4
Periodic cell according to the Gori model (Gori, 1983): (a) dry soil; (b) low water content – thin film around the grain; (c) partially saturated soil – formed water bridges; (d) the state close to full saturation.
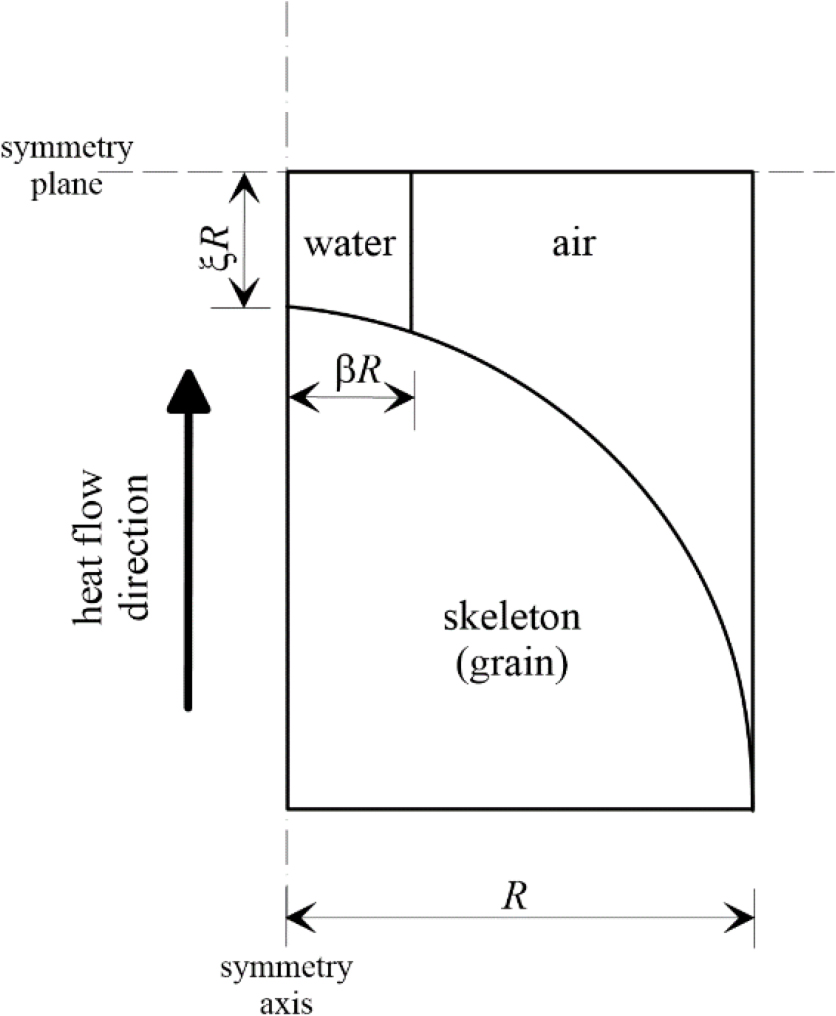
Figure 5
Assumed geometry of a three-phase medium (Haigh, 2012).
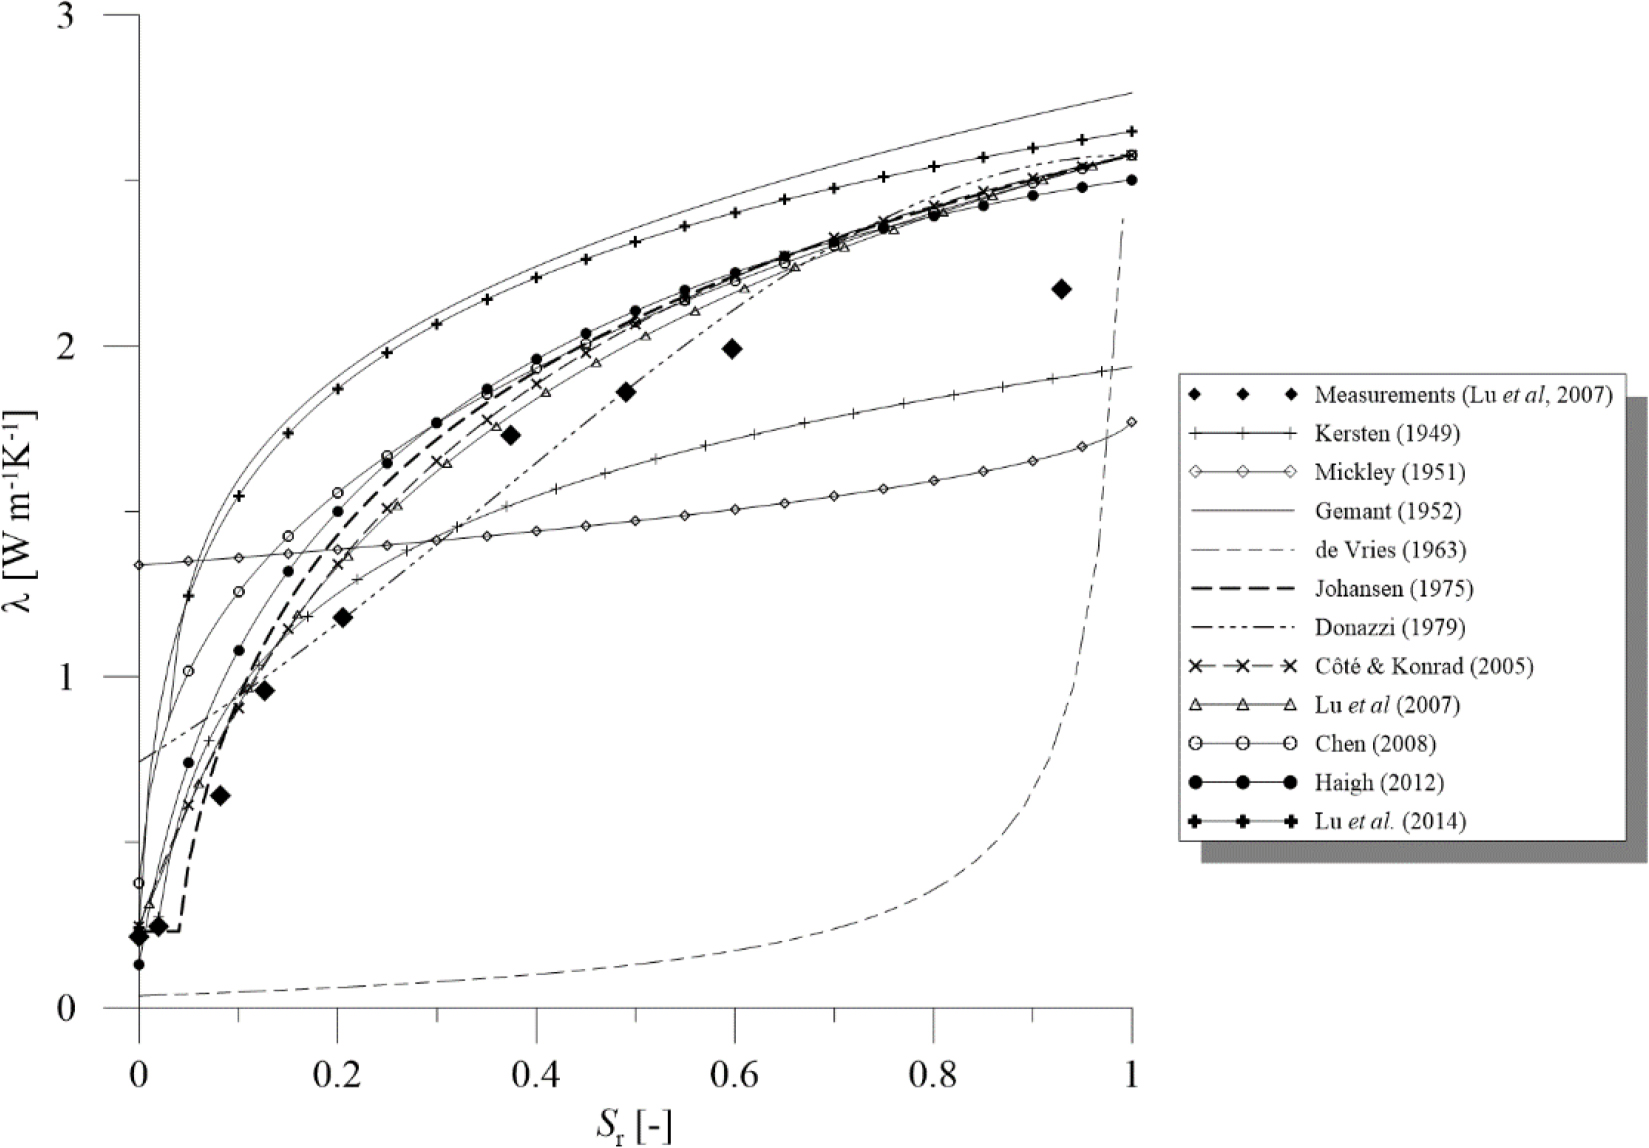
Figure 6
Prediction of thermal conductivity for coarse-grained soil at different saturation states (expressed as saturation degree Sr) and measurement results (Lu et al., 2007)
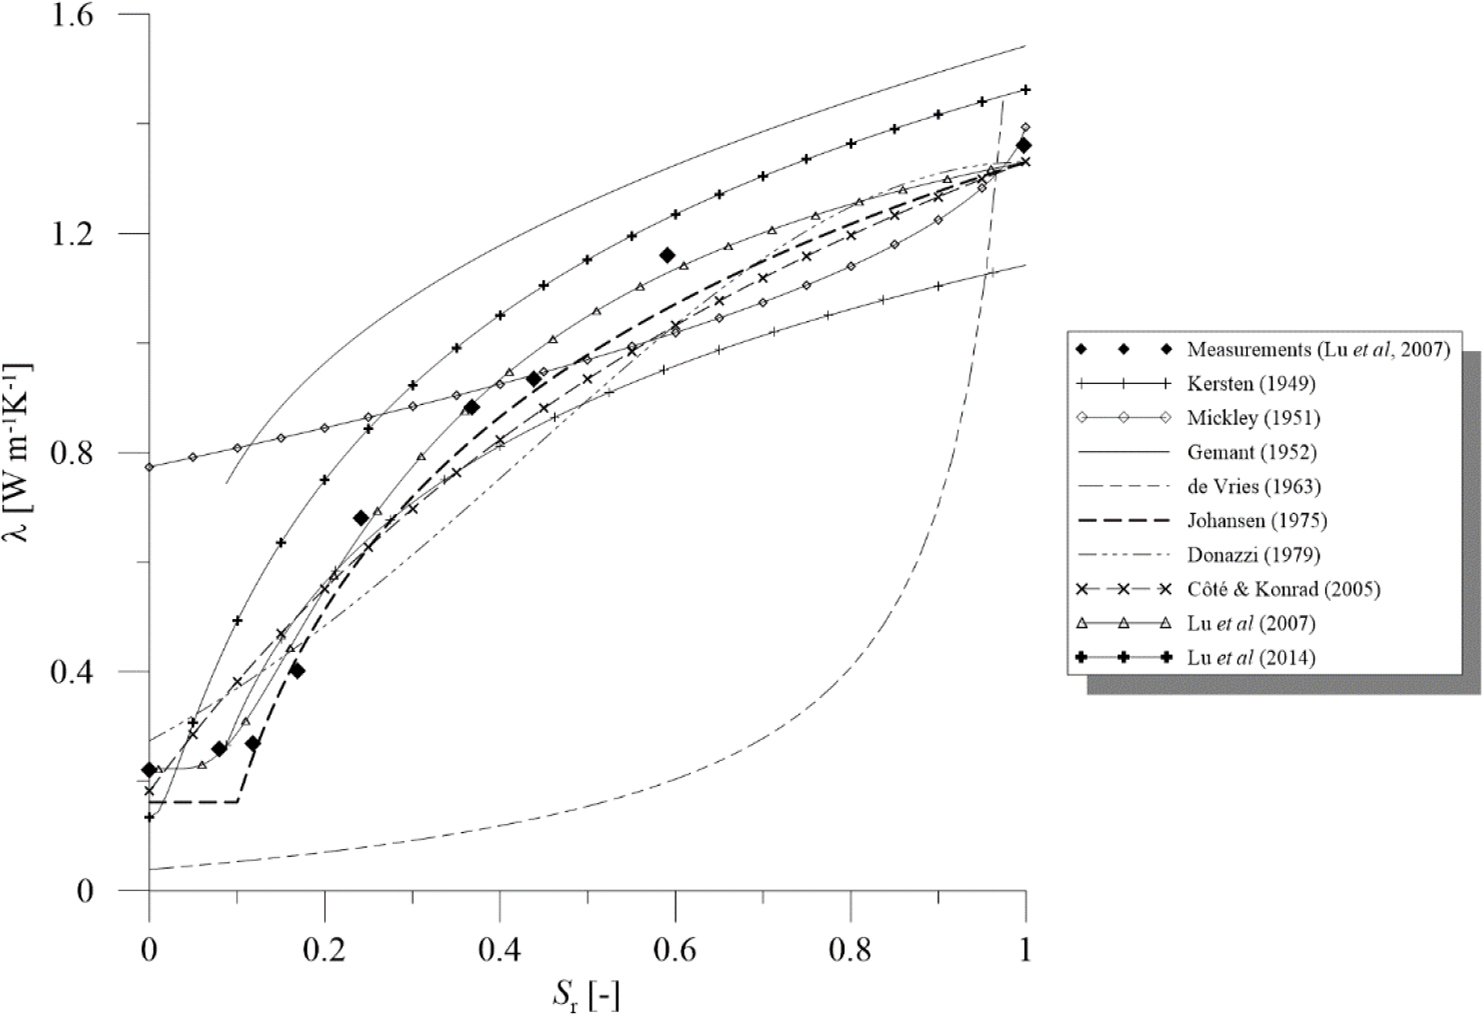
Figure 7
Prediction of thermal conductivity for fine-grained soil at different saturation states (expressed as saturation degree Sr) and measurement results (from Lu et al., 2007).
Table 2
Advantages, disadvantages and comments on considered empirical models (Różański, 2018).
| Empirical models | |||
|---|---|---|---|
| Model | Advantages | Disadvantages | Comments |
| Kersten (1949) | Simple formula; for every type of soil | Equations do not take into account the quartz content which has the largest contribution in overall value of λ | Thermal conductivity in dry state cannot be determined |
| Johansen (1975) | Can be used for frozen soils; relatively high quality of prediction; for every type of soil | Possible inaccuracy for dry soil (±20%) | Empirical relations valid for Sr>0.05 (coarse-grained soil) and Sr>0.01 (fine-grained soil) |
| Donazzi et al. (1979) | Simple formula; for every type of soil | Weak prediction for soils with low water content | The shape of the λ − Sr curve does not fully comply with the test results and with most other models presented in literature |
| Côté and Konrad (2005b) | For every type of soil; includes the type of soil and the shape of grains | The course of the Ke − Sr curve is not entirely consistent with common knowledge for fine-grained soils with low water content | Modification of the Johansen method (1975) with respect to the Kersten number and dry soil conductivity |
| Lu et al. (2007) | For every type of soil; very good reflection of thermal conductivity for fine-grained soils with very low water content; the type of soil is taken into account | Unknown influence of the type of soil on the conductivity in the dry state | Modification of the Johansen method with respect to the Kersten number and dry soil conductivity |
| Chen (2008) | Simple formula; good quality of prediction | Limited applicability | Only for sands with a high quartz content |
| Lu et al. (2014) | Simple formula; for every type of soil; includes the effect of the dry density on thermal conductivity | For the analysed soils, the model clearly overestimated the values of λ in the entire range of water content | Dry soil conductivity should be computed using empirical relation proposed in Lu et al. (2007); possible weaker prediction for soils with high content of sand separate |
| He at al. (2017) | Simple formula; for every type of soil; good quality of prediction | Lack of correlation formulas for determining model parameters | Modification of the Johansen method with respect to the Kersten number |
Table 3
Advantages, disadvantages and comments on the considered theoretical models (Różański, 2018).
| Theoretical models | |||
|---|---|---|---|
| Model | Advantages | Disadvantages | Comments |
| Wiener (1912) | Determination of the range of possible thermal conductivity values of porous media (soils); simple formula | Rough estimate | For coarse soils, due to the contrast between the thermal conductivity of the components, these bounds are very wide |
| Mickley (1951) | For every type of soil | Weak prediction for dry soils or with low water content | Should not be applied to the soils with relatively high porosity |
| Gemant (1952) | For every type of soil | Complicated formula; need to use nomograms | Not applicable to dry soils; possible overestimation of thermal conductivity results if Gemant formula is not used to determine the thermal conductivity of the soil skeleton λs |
| de Vries (1963) | For every type of soil; can be used for partially or fully frozen soils | Need to assume values of shape factors ga; weak prediction for dry soils; weak reflection of real λ − Sr characteristic | For good predictions, one should incorporate in Eq. (22) heterogeneity of solid phase and at least five minerals should be taken into account (Tarnawski & Wagner, 1992, 1993); do not use if the volume fraction of water is less than 0.03 (coarse-grained soil) or 0.05–0.10 (fine-grained soil) |
| Gori (1983) | For every type of soil; can be used for different temperatures | Very complex formula; Certain parameters should be determined on the basis of laboratory tests’ results | Possible underestimation of thermal conductivity for dry soils |
| Tong et al. (2009) | Includes the impact of many factors on the thermal conductivity of the porous media | Complex formula; a series of laboratory tests have to be performed | Lack of formulas from which model parameters can be computed |
| Haigh (2012) | High accuracy of prediction | Complex formula; Underestimation of results by a constant factor, about 1.58 | Only for sandy soils with a porosity higher than 0.333 |