
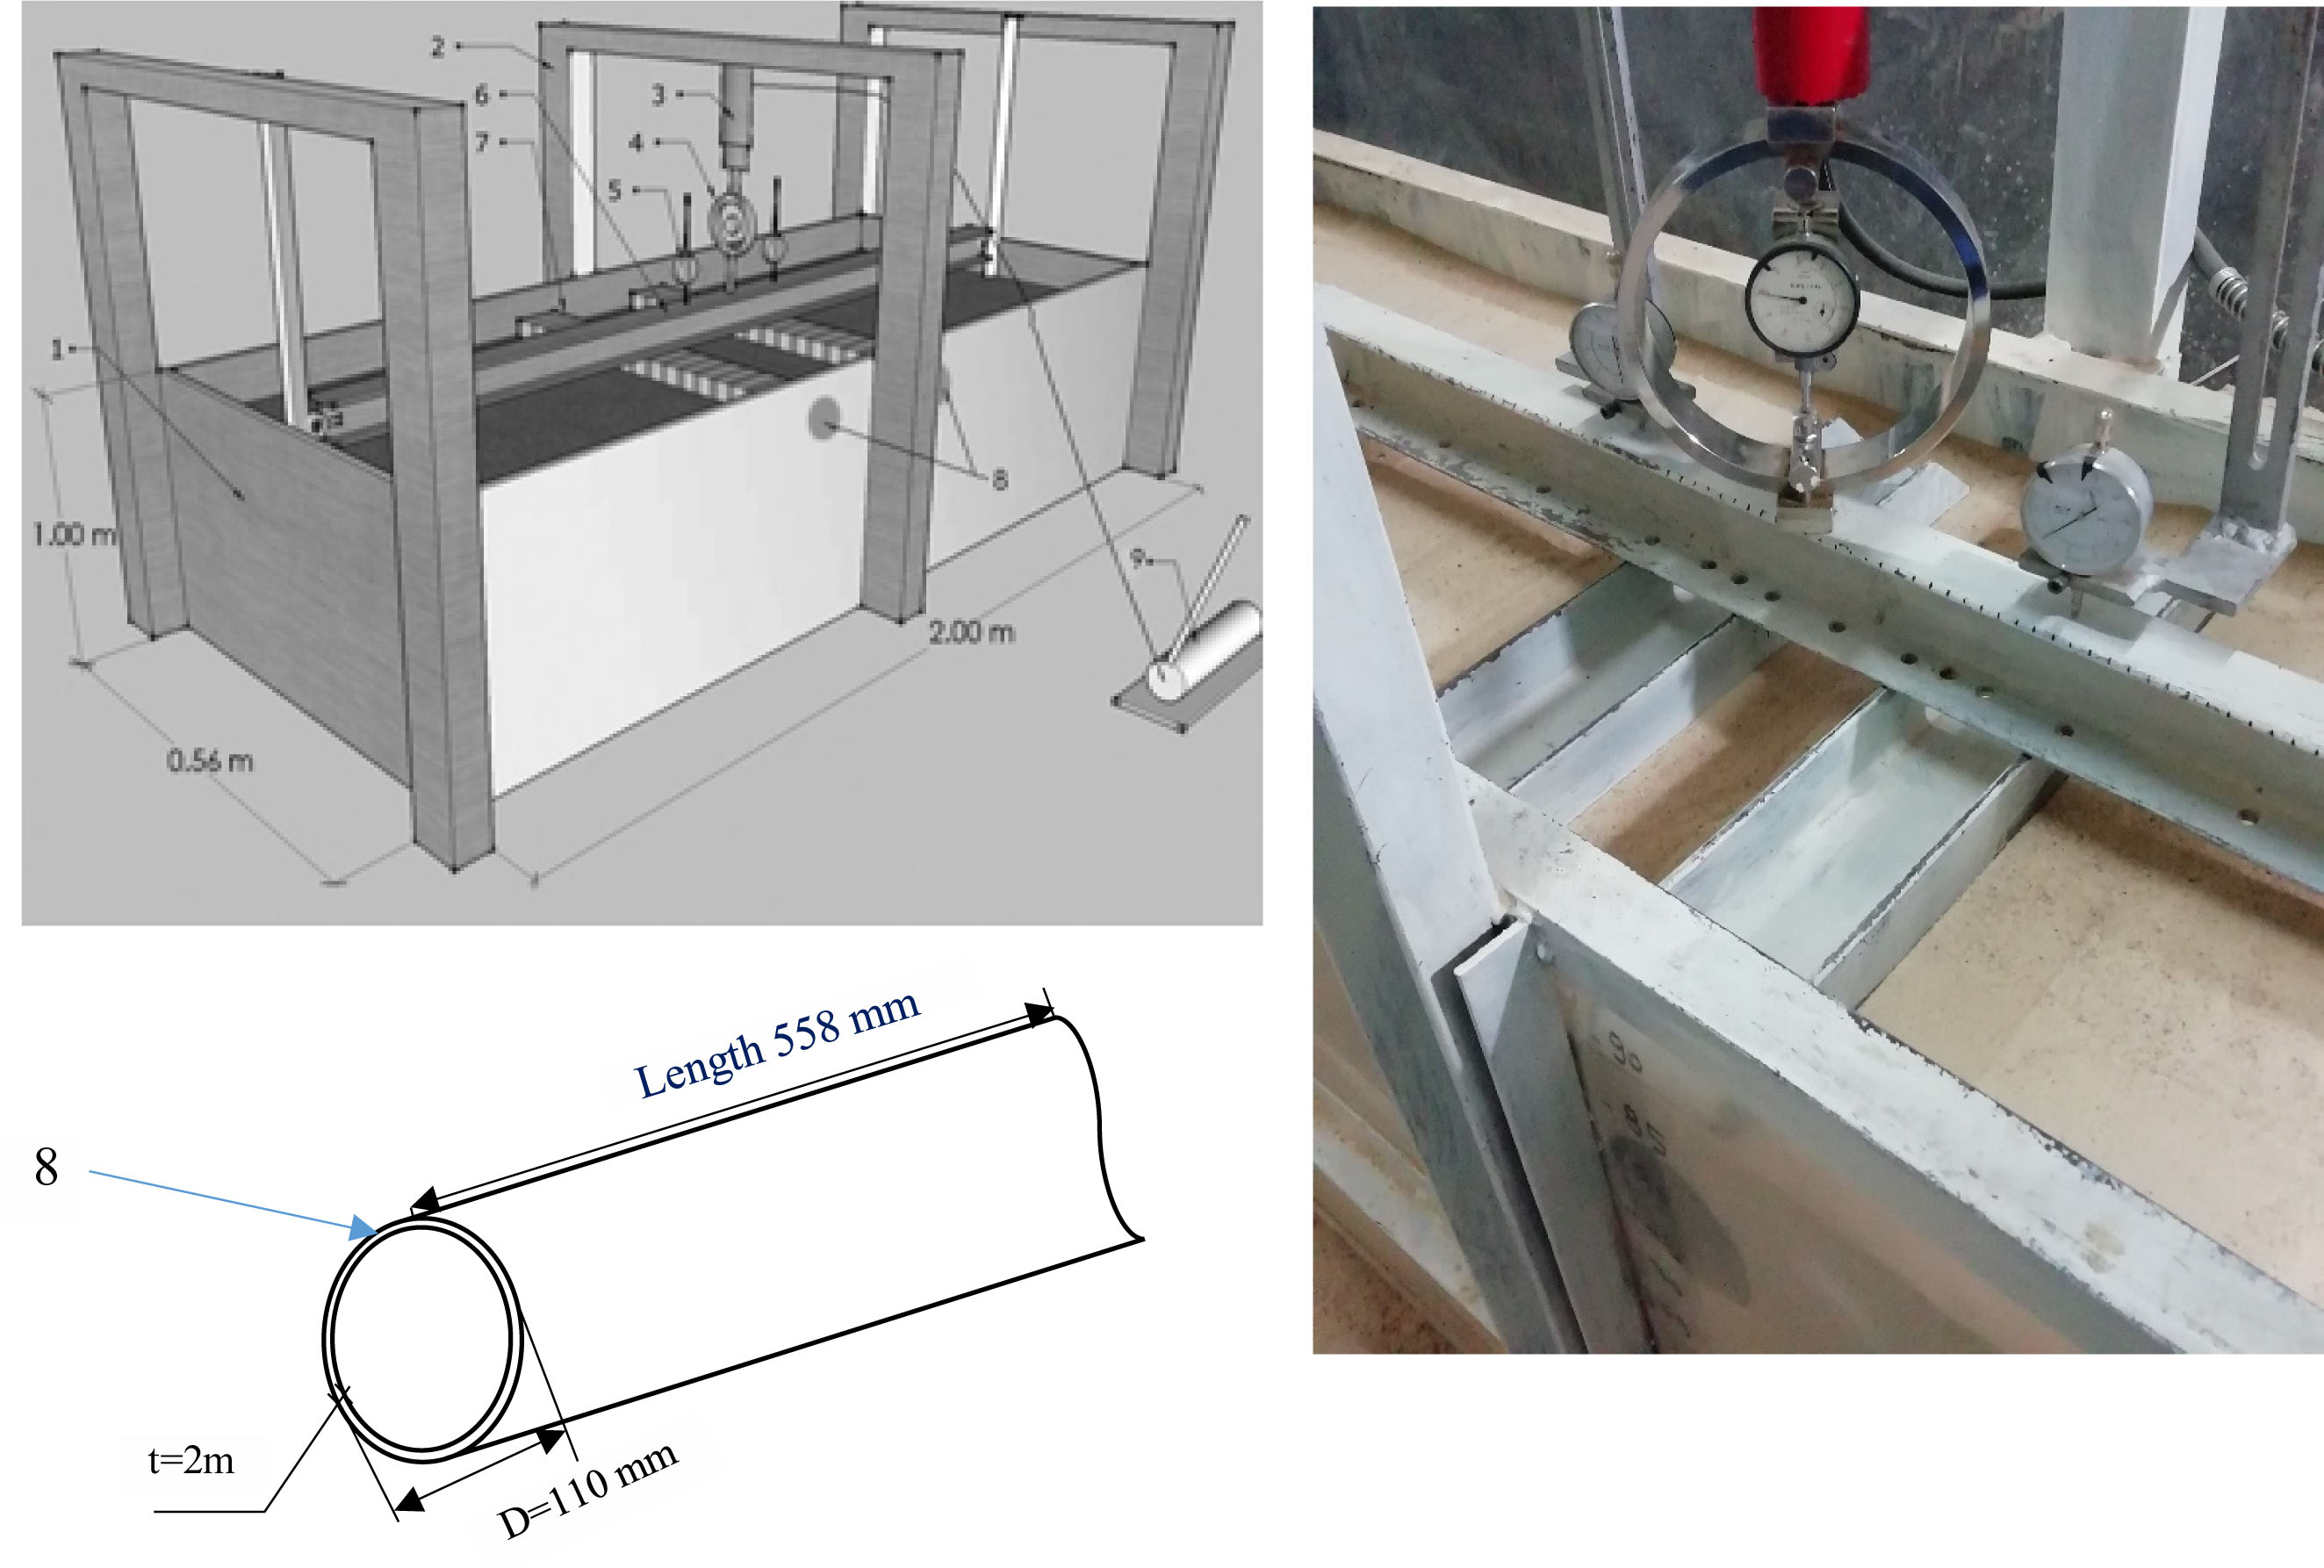
Figure 1
Schematic diagram of test setup: 1) steel test box; 2) steel load frame; 3) hydraulic jack; 4) proving ring; 5) dial gauge; 6) steel beam; 7) model steel footing; 8) cavities (PVC 110 mm); 9) roller compactor.
Table 1
Geotechnical properties of the tested sand.
| Property | Value |
|---|---|
| Specific gravity Gs | 2.583 |
| Effective particle size D10, mm | 0.094 |
| Mean particle size D30, mm | 0.200 |
| Mean particle size D60, mm | 0.300 |
| Uniformity coefficient Cu | 3.19 |
| Coefficient of curvature Cc | 1.42 |
| Maximum dry unit weight γd(max), KN/m3 | 17.02 |
| Minimum dry unit weight γd(min), KN/m3 | 14.51 |
| Peak friction angle φ0 | 35 |
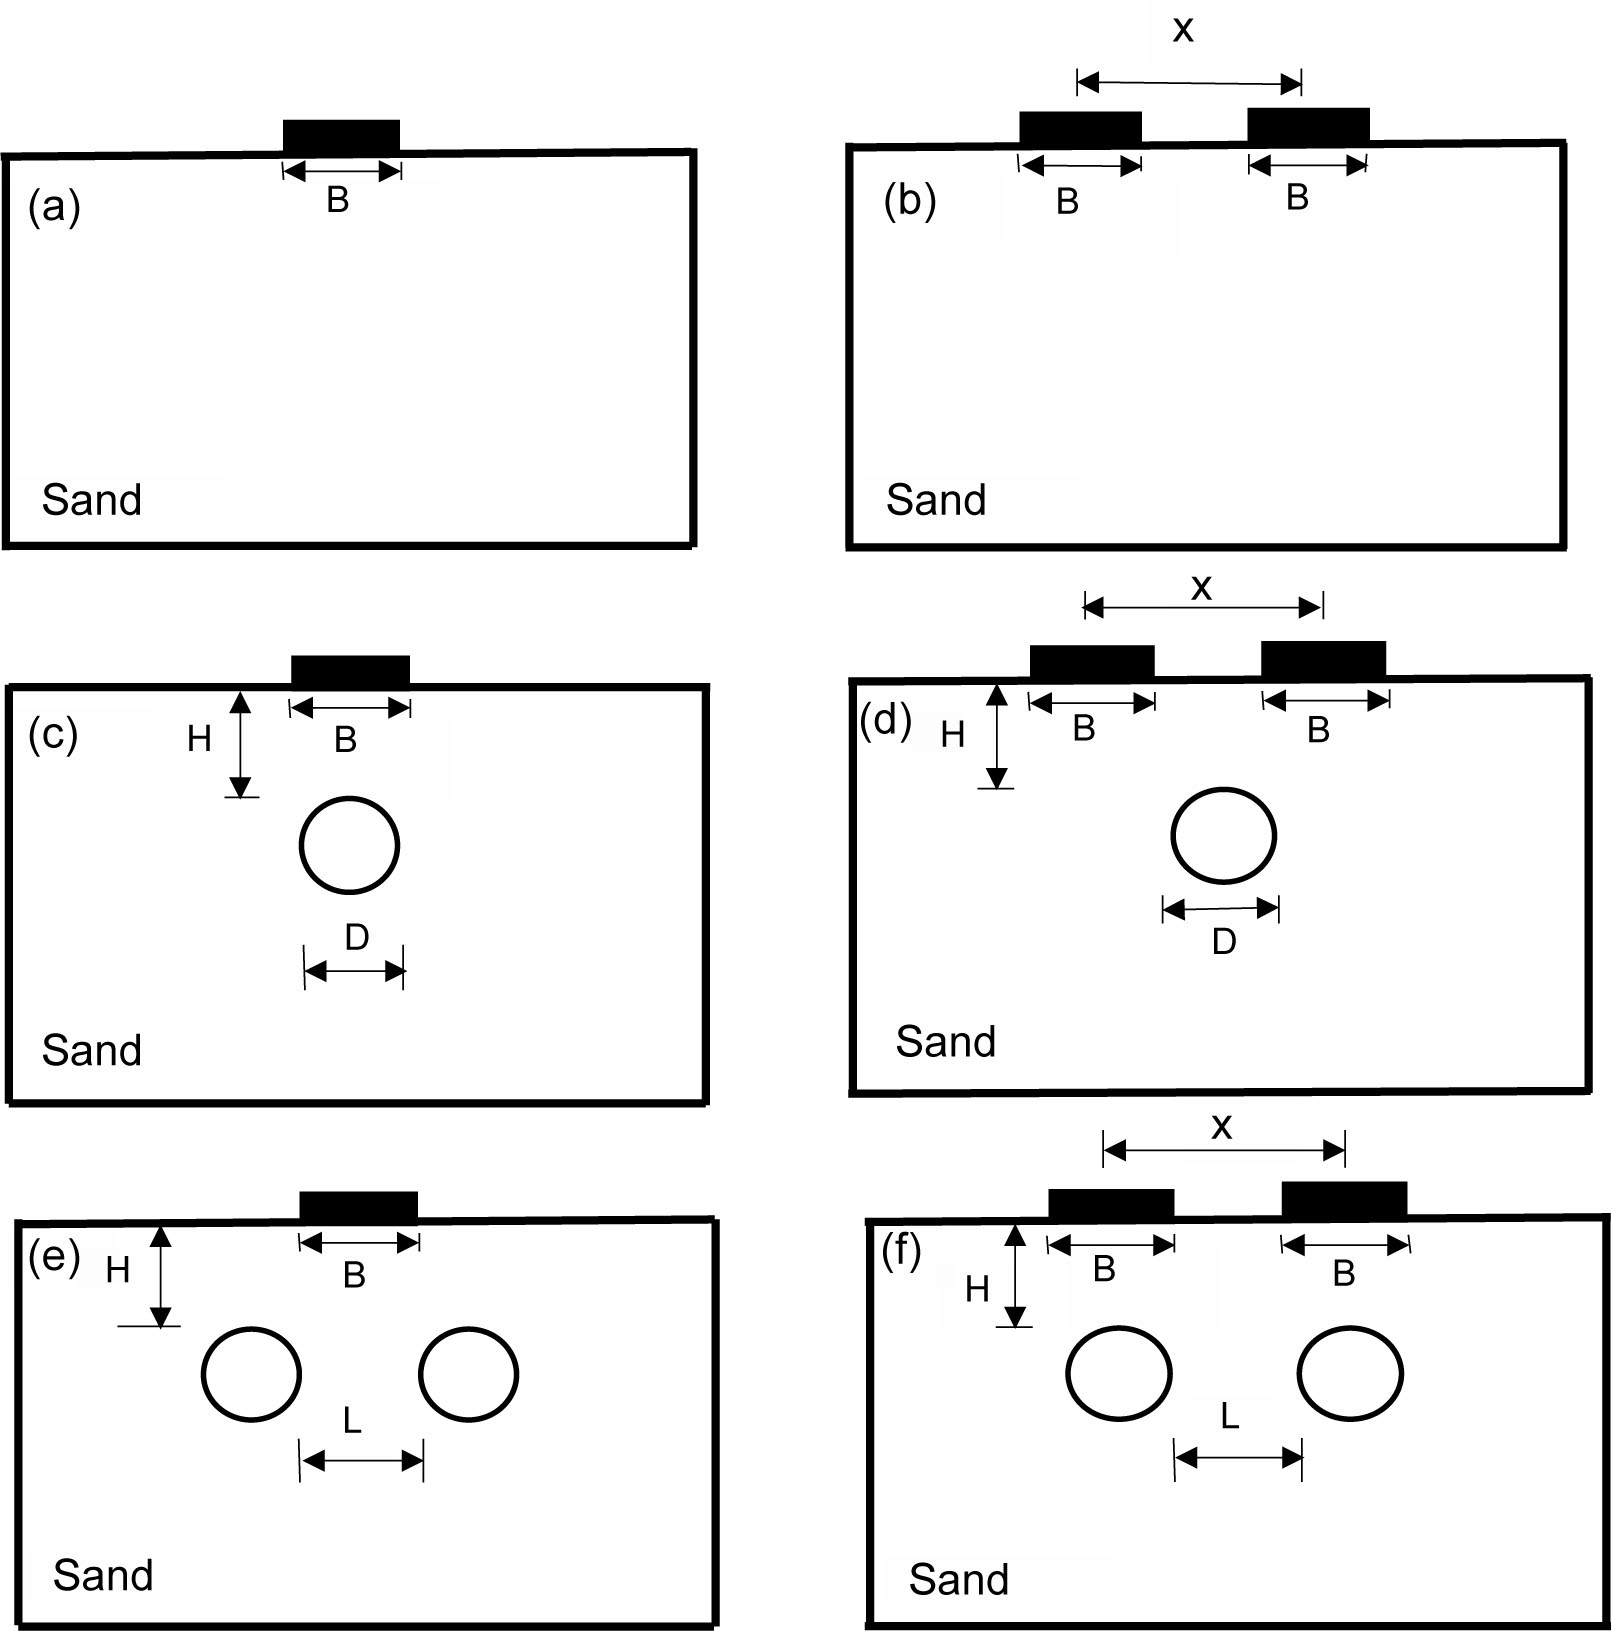
Figure 2
Models used in this study: (a) isolated footing; (b) two adjacent strip footings; (c) isolated footing with cavity; (d) two adjacent strip footings with cavity; (e) isolated footing with two cavities; (f) two adjacent strip footings with two cavities
Table 2
Model tests program.
| Test series | x/B | H/B | L/B |
|---|---|---|---|
| Without cavity | 1.0, 1.5, 2.0, 2.5, 3.0, 4.0, 5.0 | / | / |
| With Cavity | 1.0, 1.5, 2.0, 2.5, 3.0, 4.0, 5.0 | 0.5, 1.0, 1.5, 2.0, 2.5, 3.0 | / |
| with two cavities | 1.0, 1.5, 2.0, 2.5, 3.0, 4.0, 5.0 | 0.5, 1.0, 1.5, 2.0, 2.5, 3.0 | 0.5, 1.0, 1.5, 2.0, 3.0, 4.0, 5.0 |
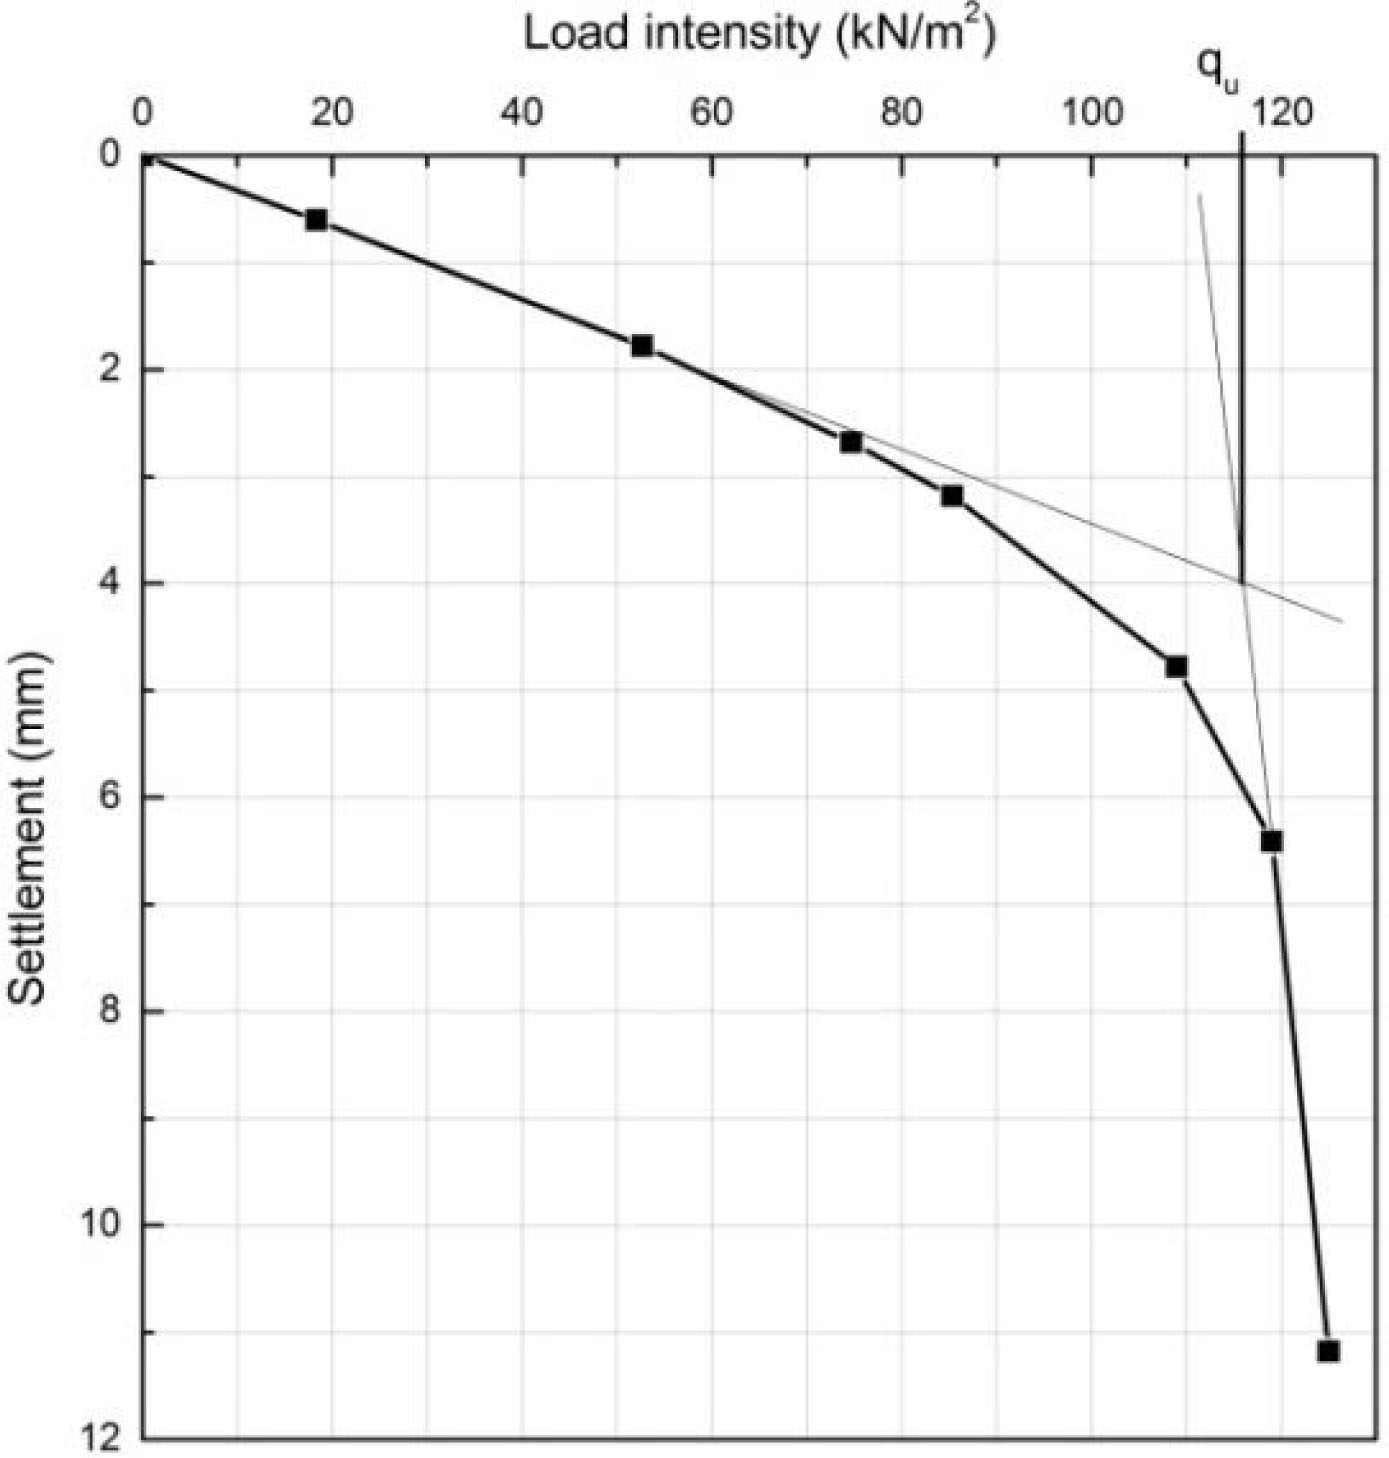
Figure 3
Interpretation of ultimate bearing capacity (qu) by Tangent Intersection Method.
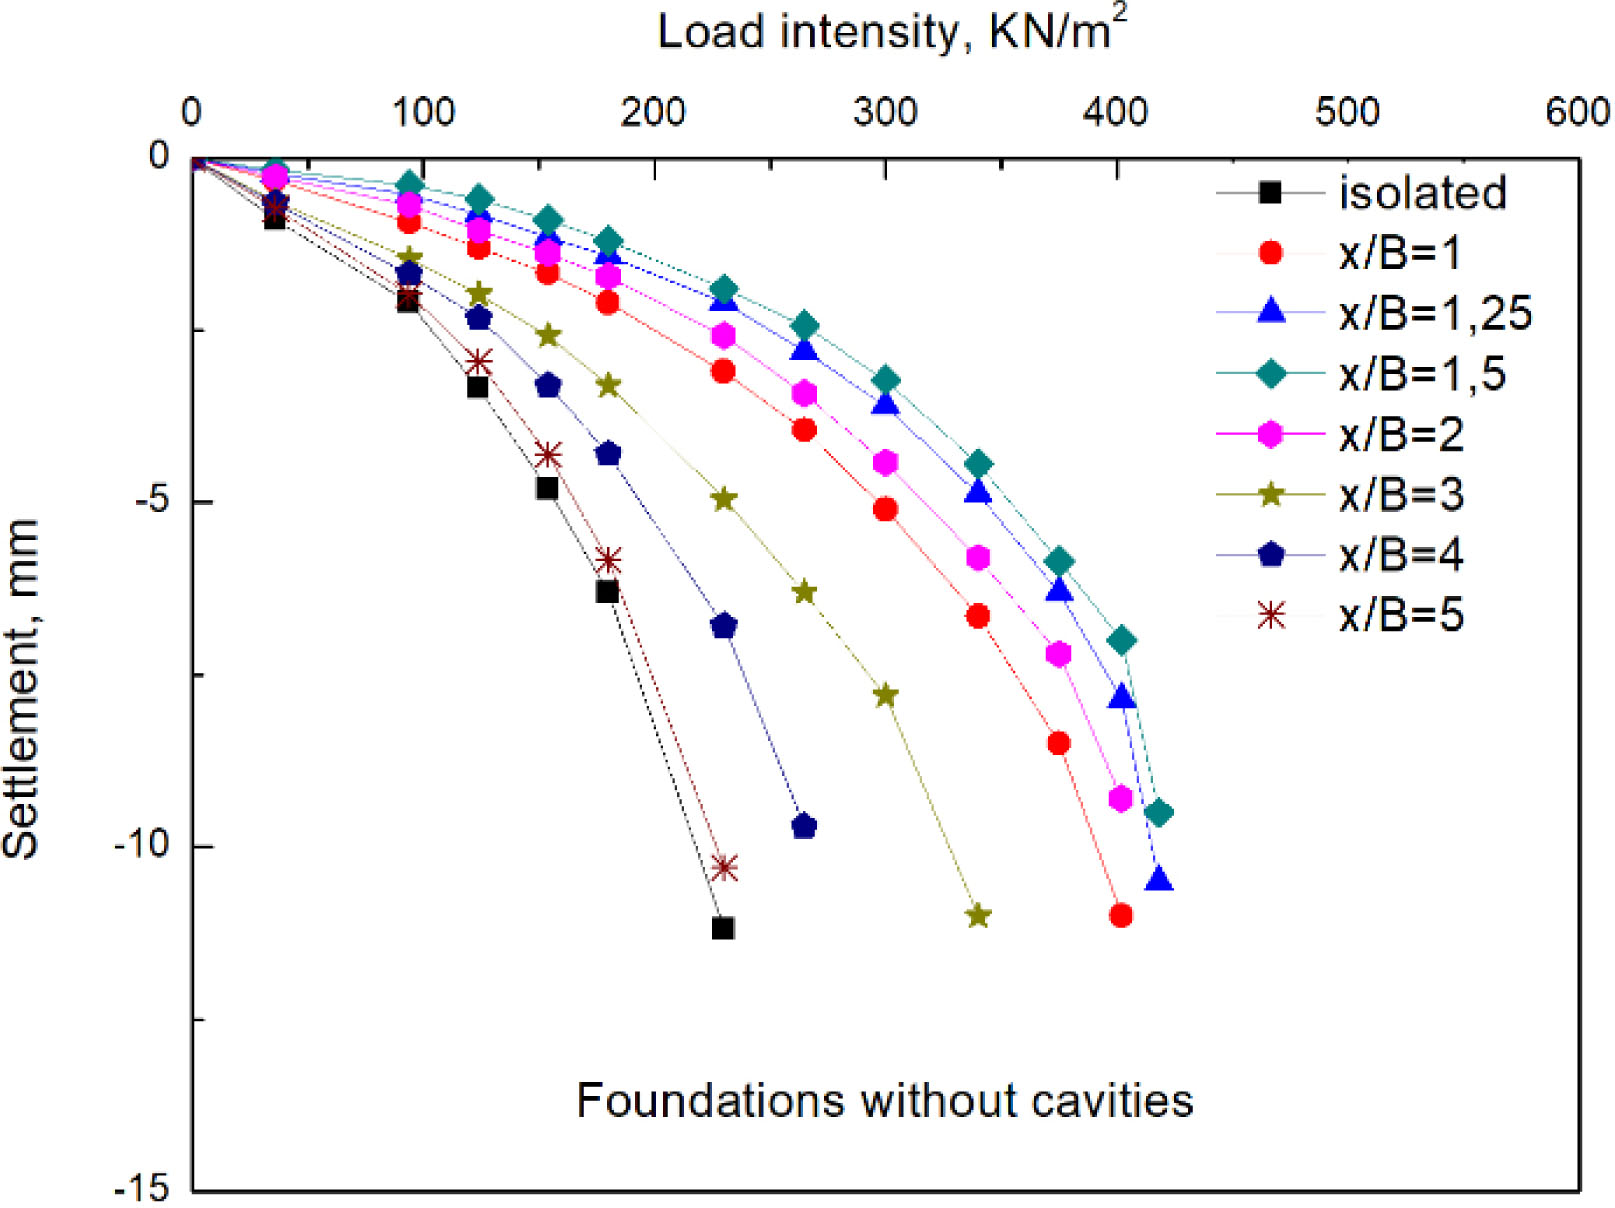
Figure 4
Load-settlement curve for cases of isolated footing and two strip footings; both cases rest on the surface of a sand layer without cavities.
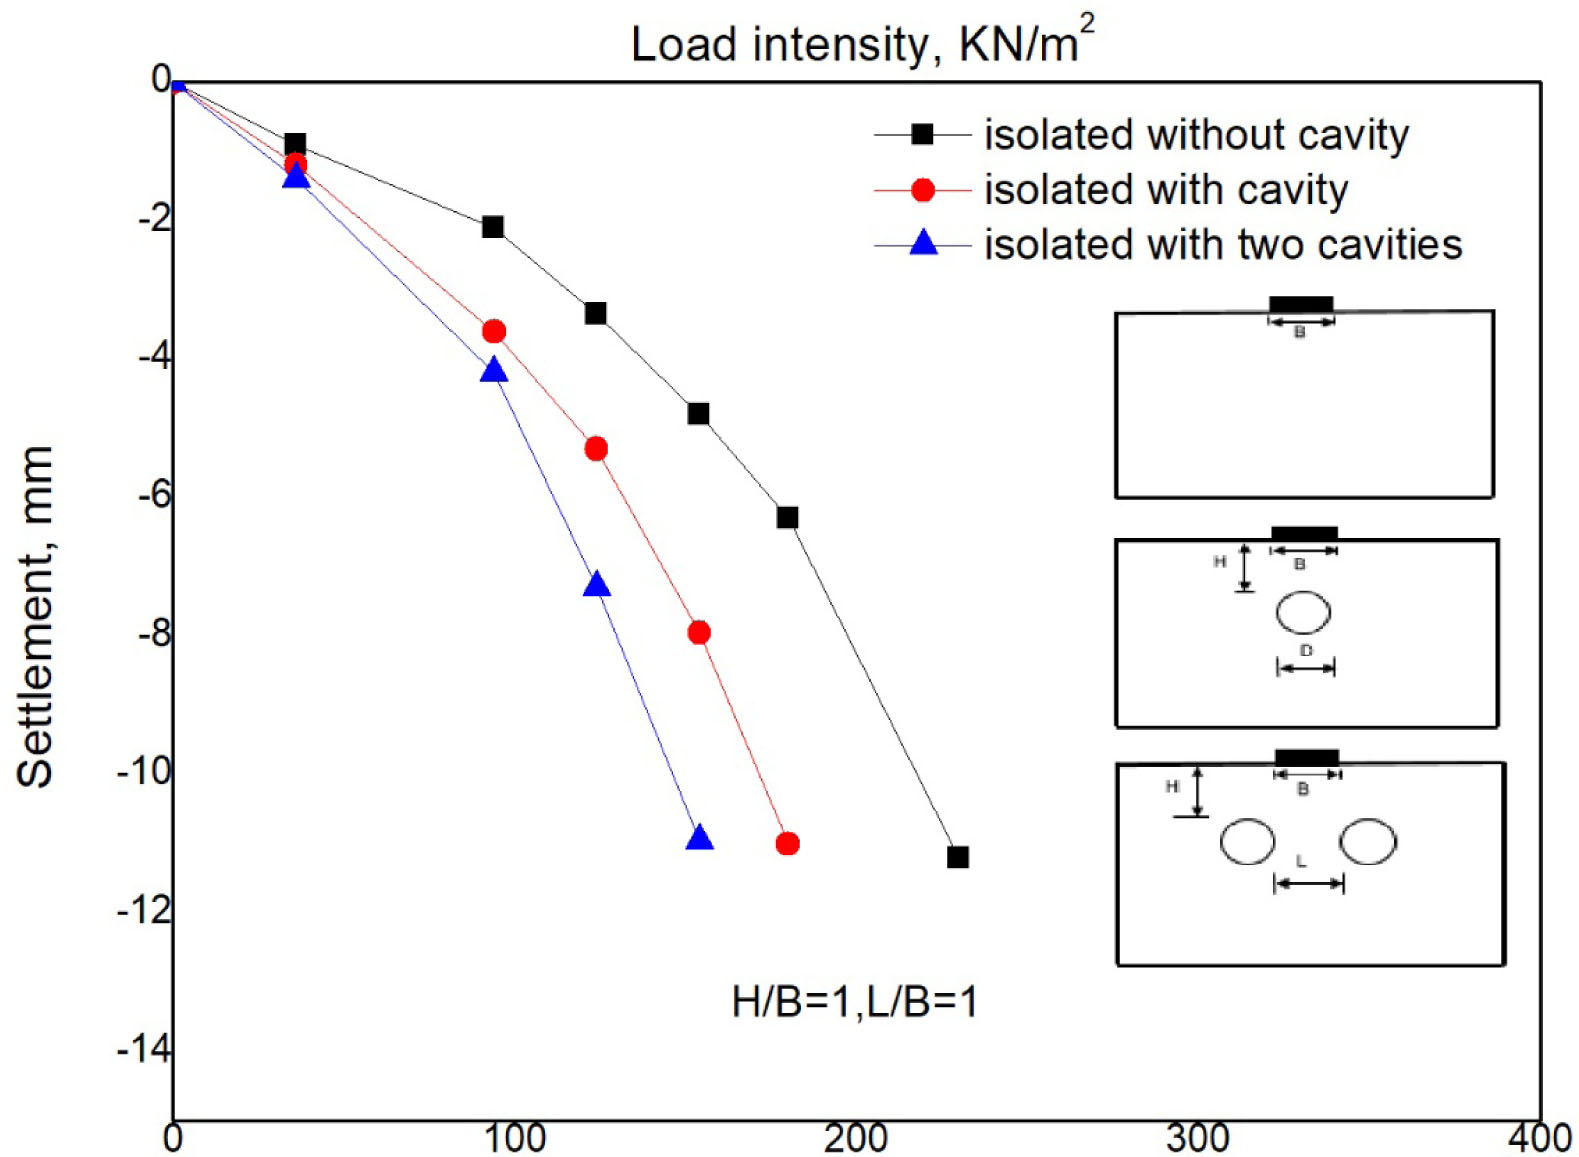
Figure 5
Load-settlement curve of isolated footing without cavity, isolated footing with cavity (H/B = 1), and isolated footing with two cavities (H/B = 1 and L/B = 1).
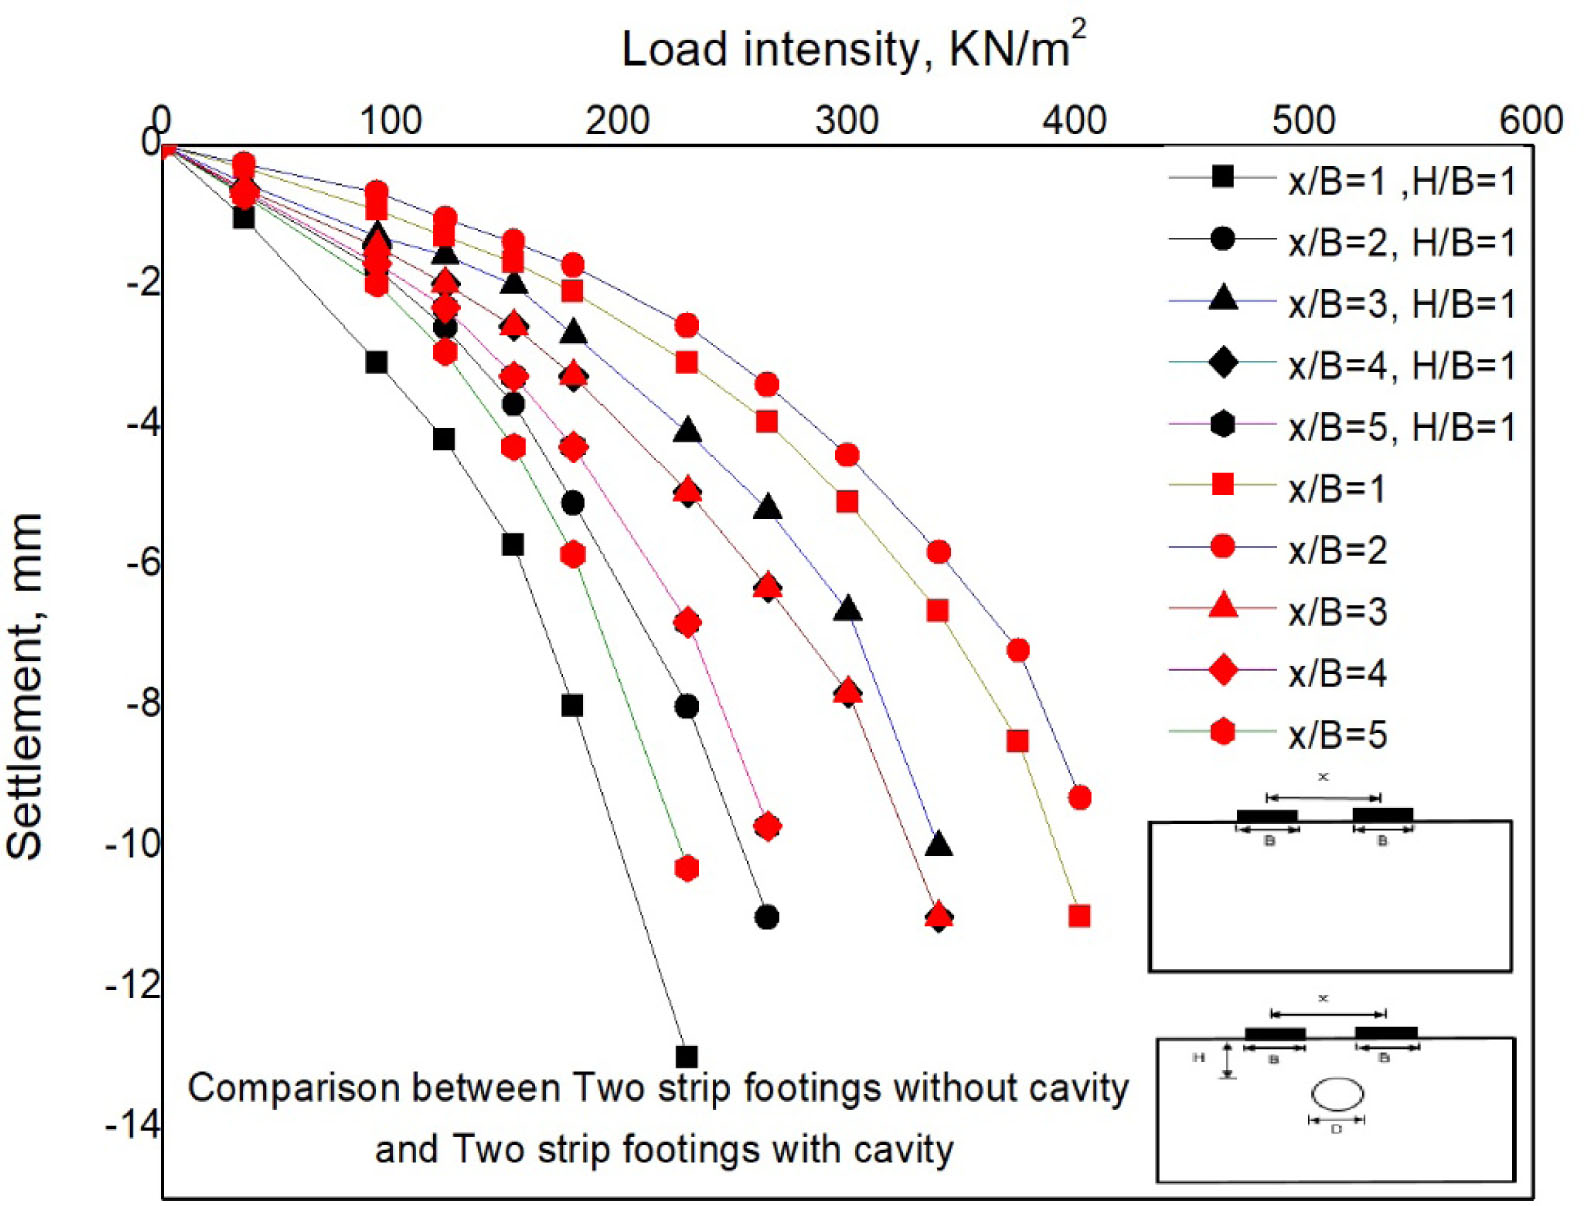
Figure 6
Load-settlement curve of adjacent footings without cavity and case of adjacent footings with cavity (H/B = 1).
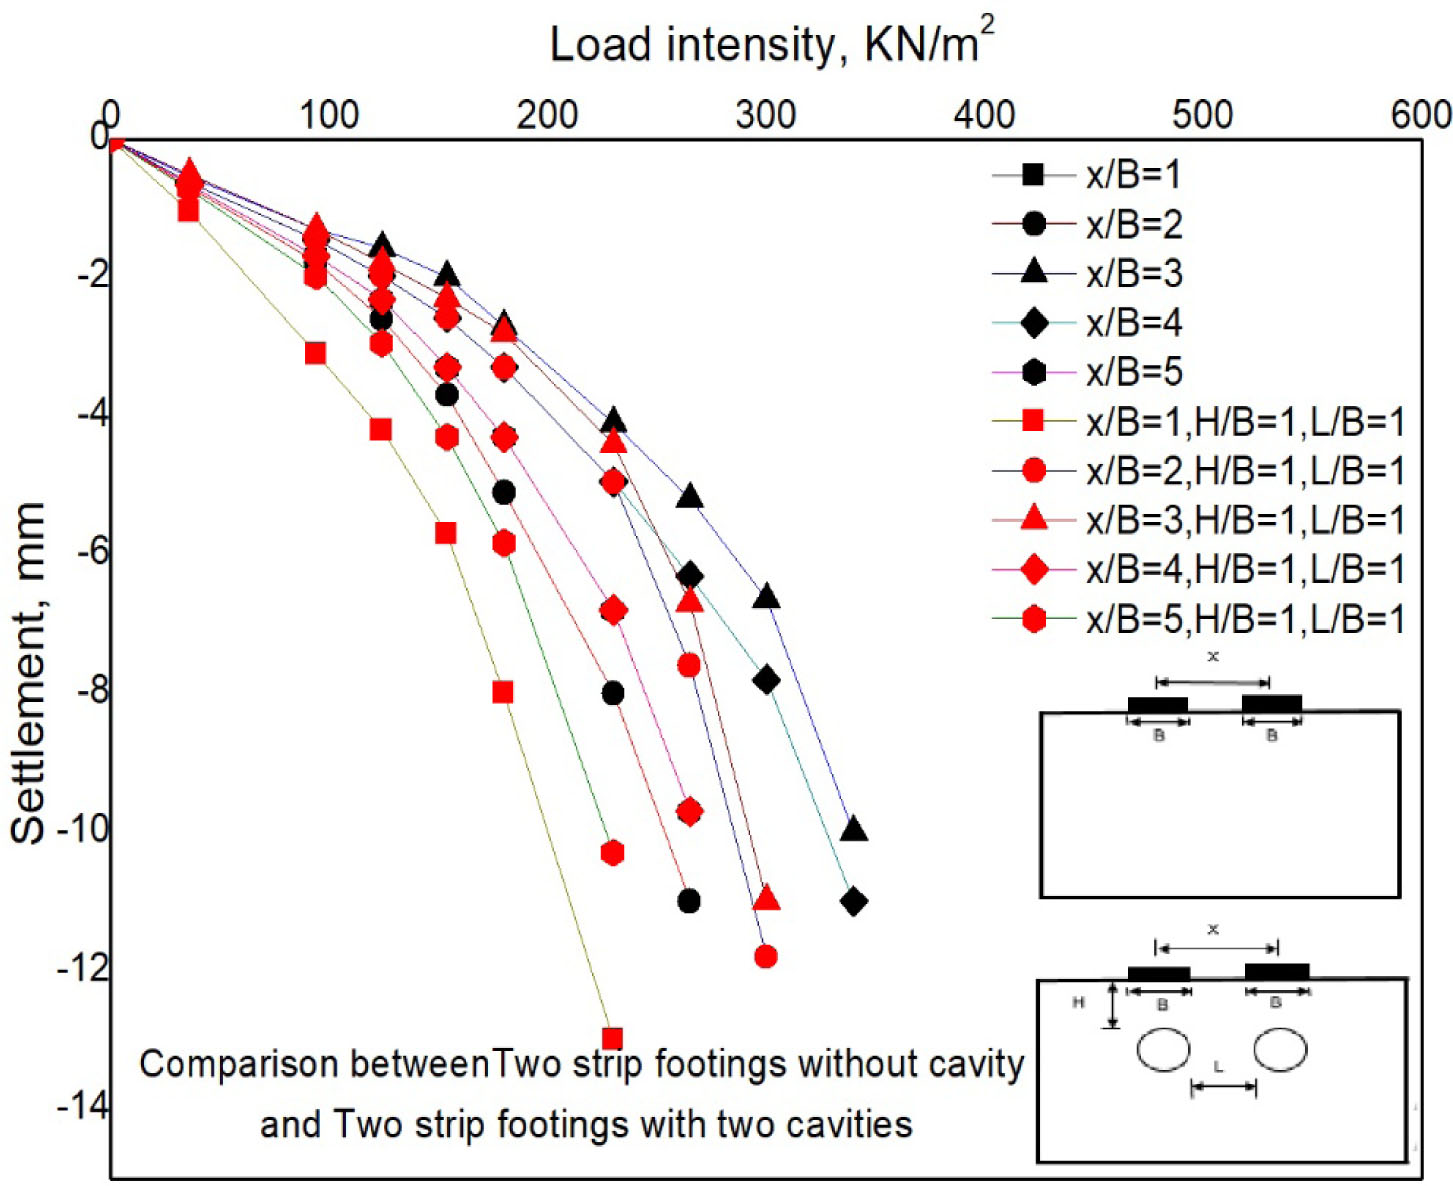
Figure 7
Load-settlement curve of adjacent footings without cavity and case of adjacent footings with two cavities (H/B = 1 and L/B = 1).
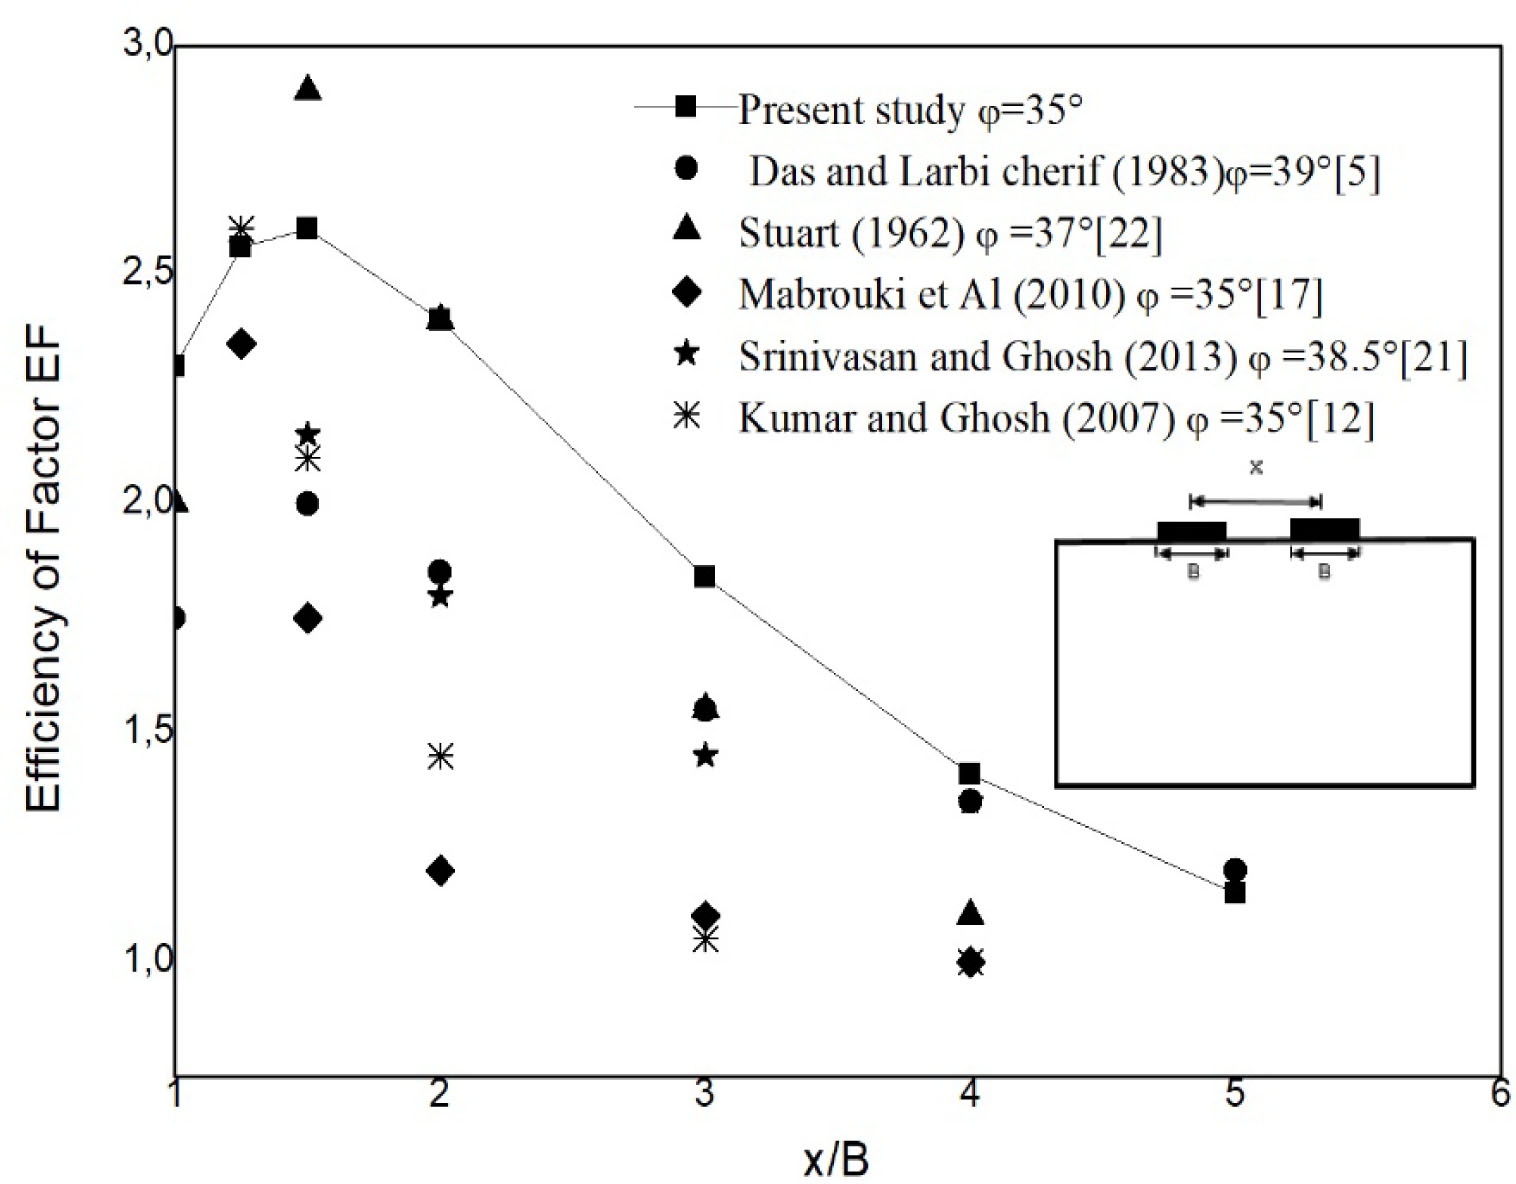
Figure 8
Comparison of EF values of strip footing without cavities with values reported in literature.
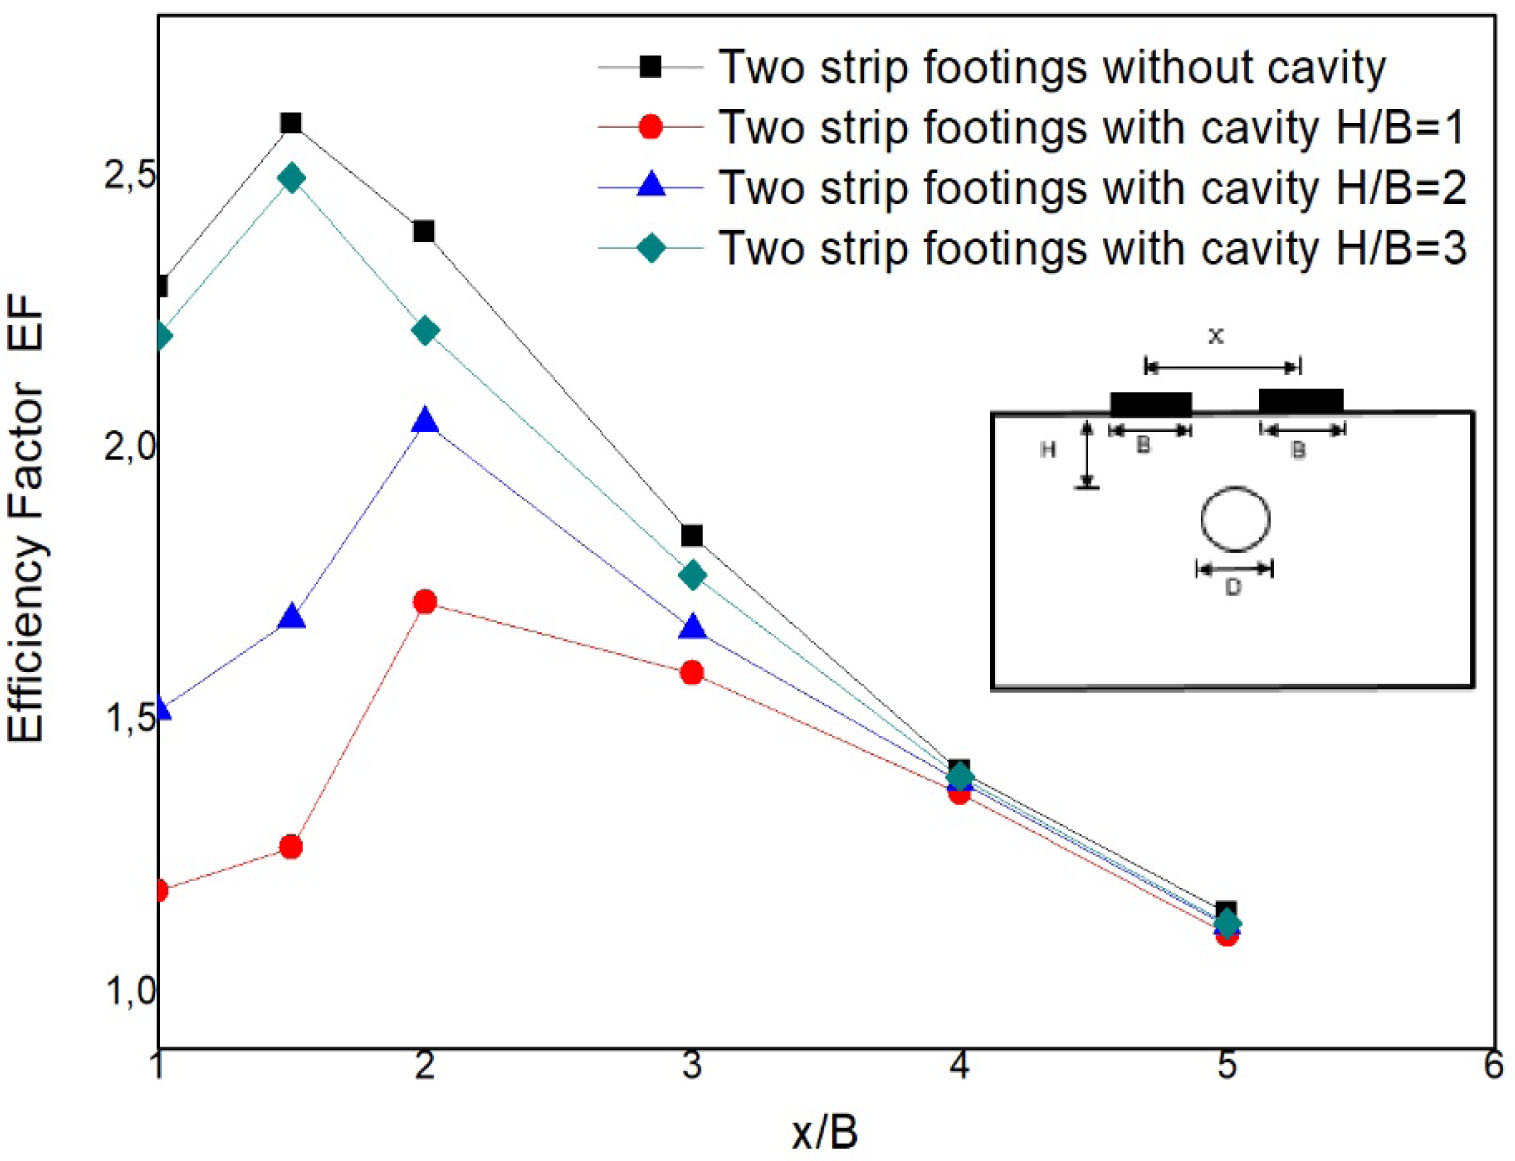
Figure 9
Variation of EF as a function of x/B in the following cases: two strip footings without cavity and with cavity (H/B = 1; H/B = 2 and H/B = 3).
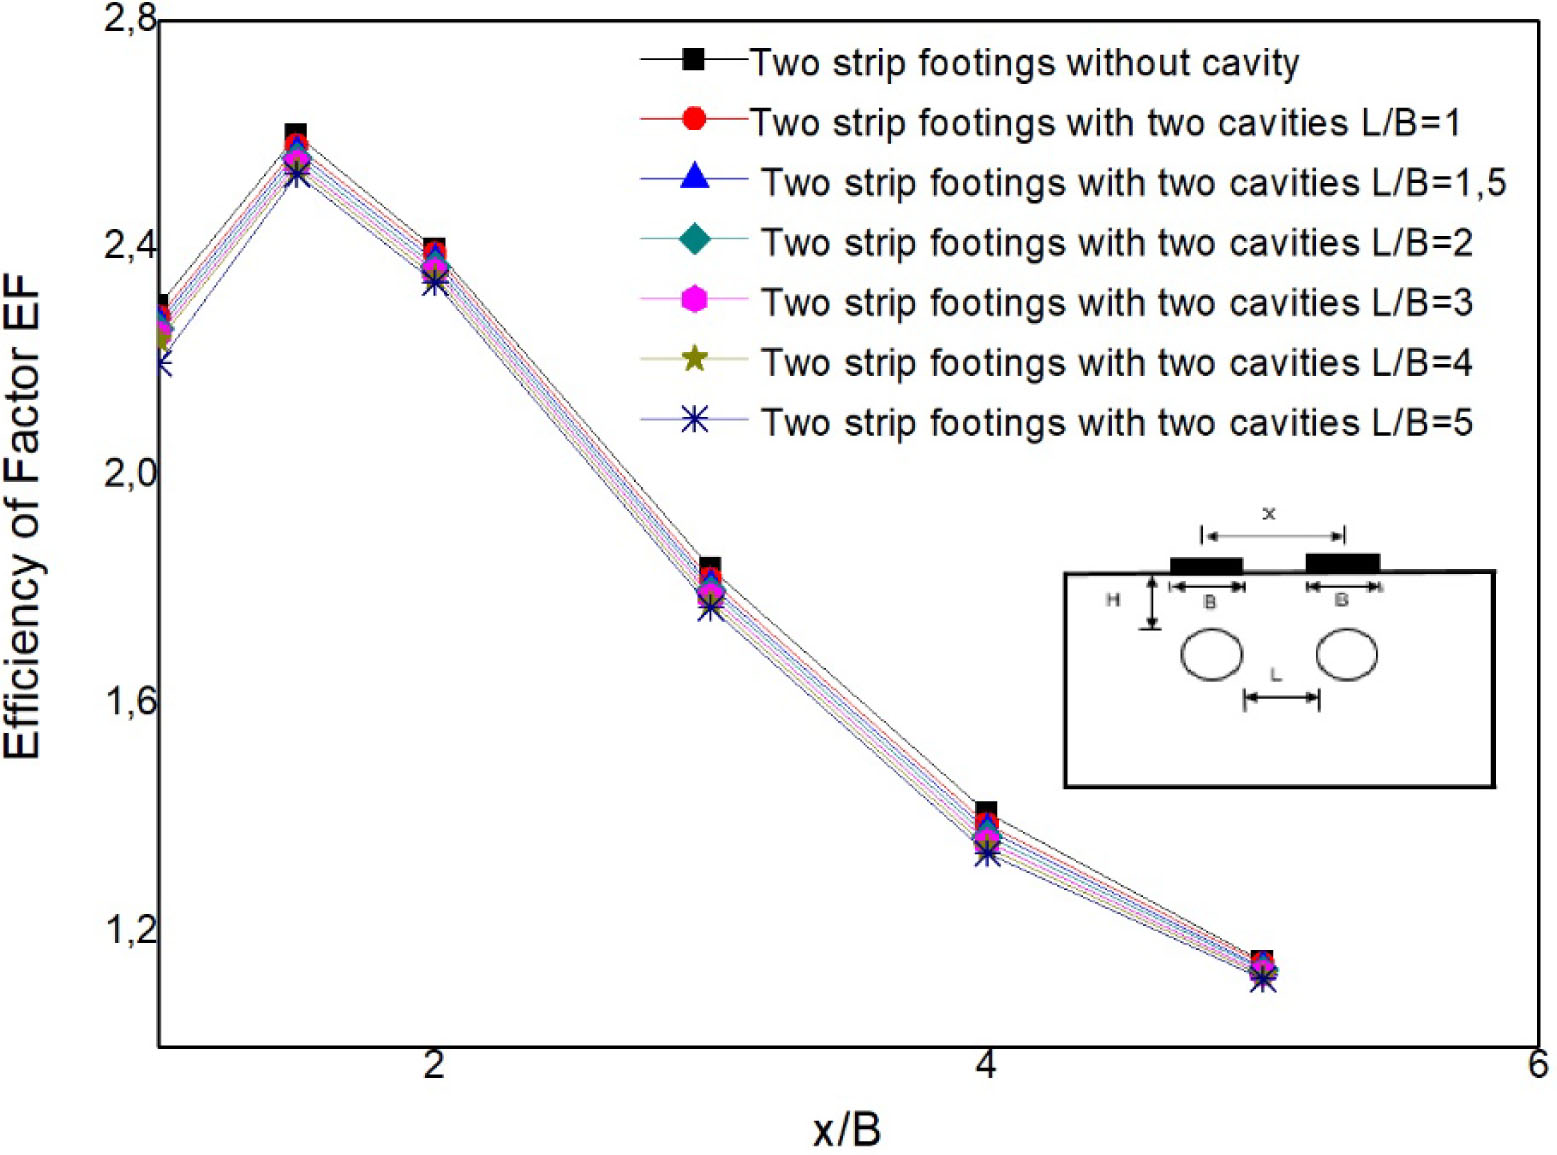
Figure 10
Variation of EF as a function of x/B in the following cases: two strip footings without cavities and with cavity (H/B = 3); (L/B = 1.0, L/B = 1.5, L/B = 2.0, L/B = 3.0, L/B = 4.0, and L/B = 5.0)
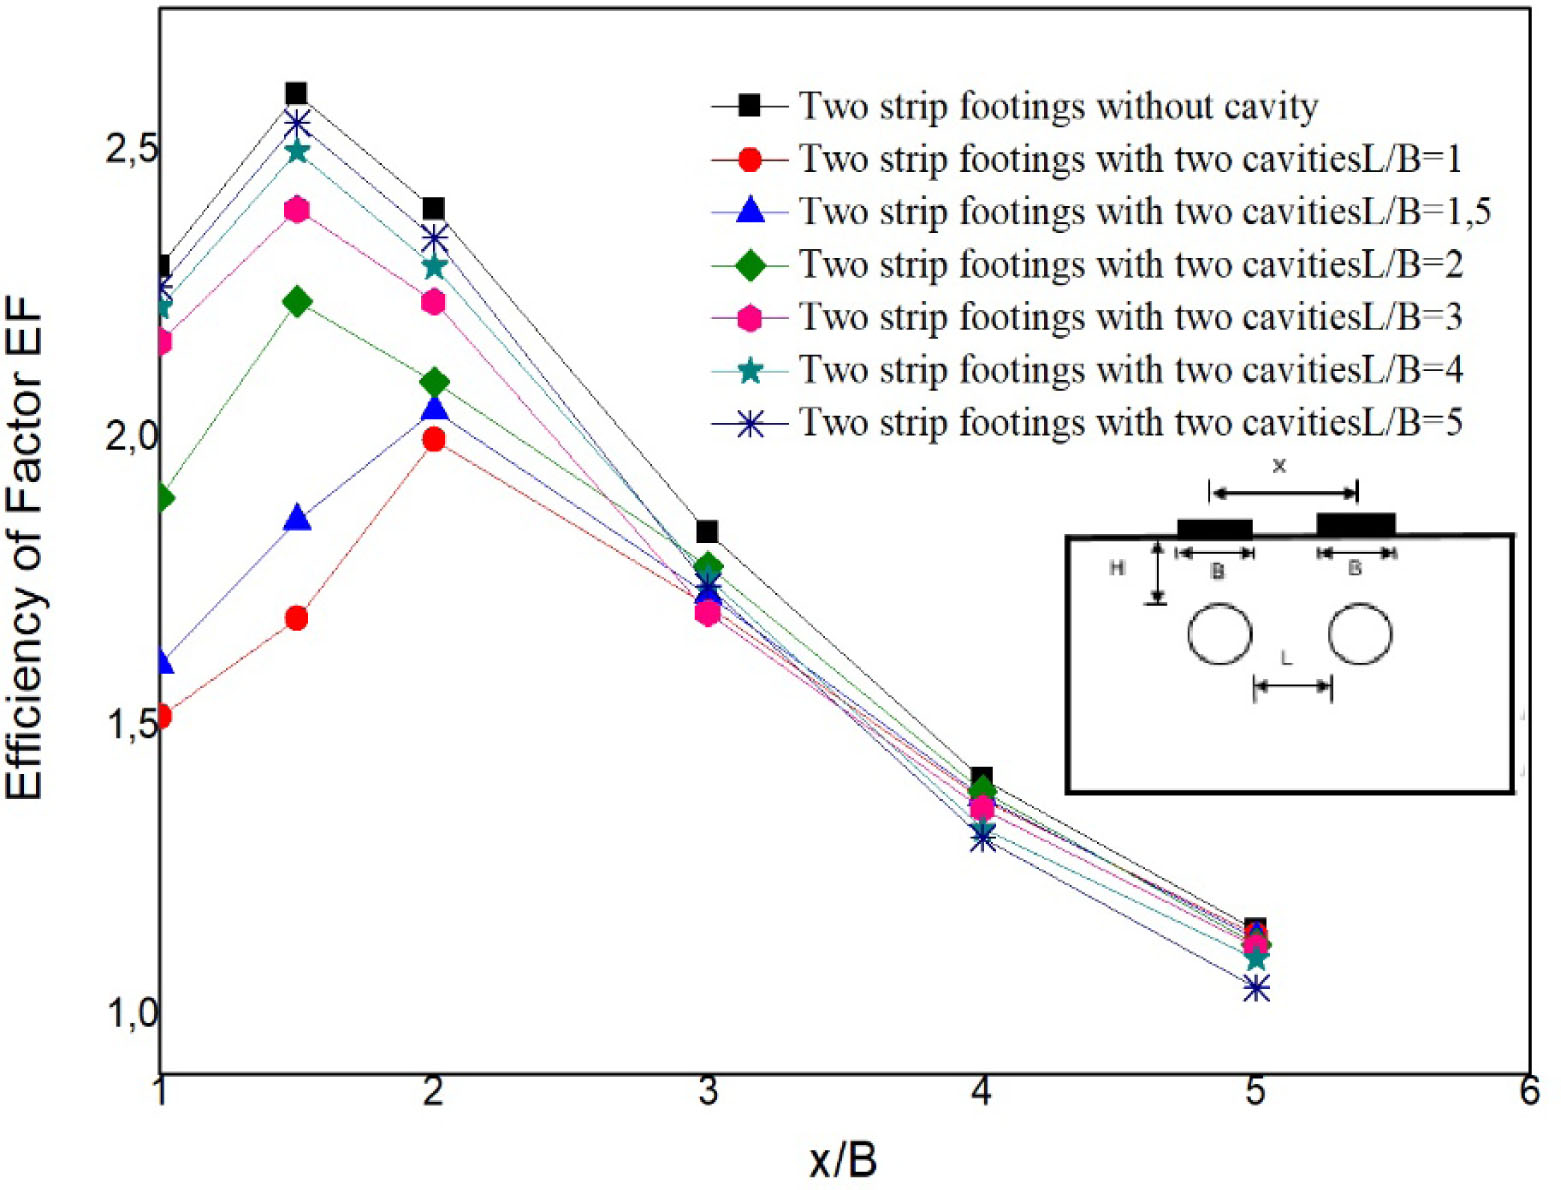
Figure 11
Variation of EF as a function of x/B in the following cases: two strip footings without cavity and with cavity (H/B = 2); (L/B = 1.0, L/B = 1.5, L/B = 2.0, L/B = 3.0, L/B = 4.0, L/B = 5.0).
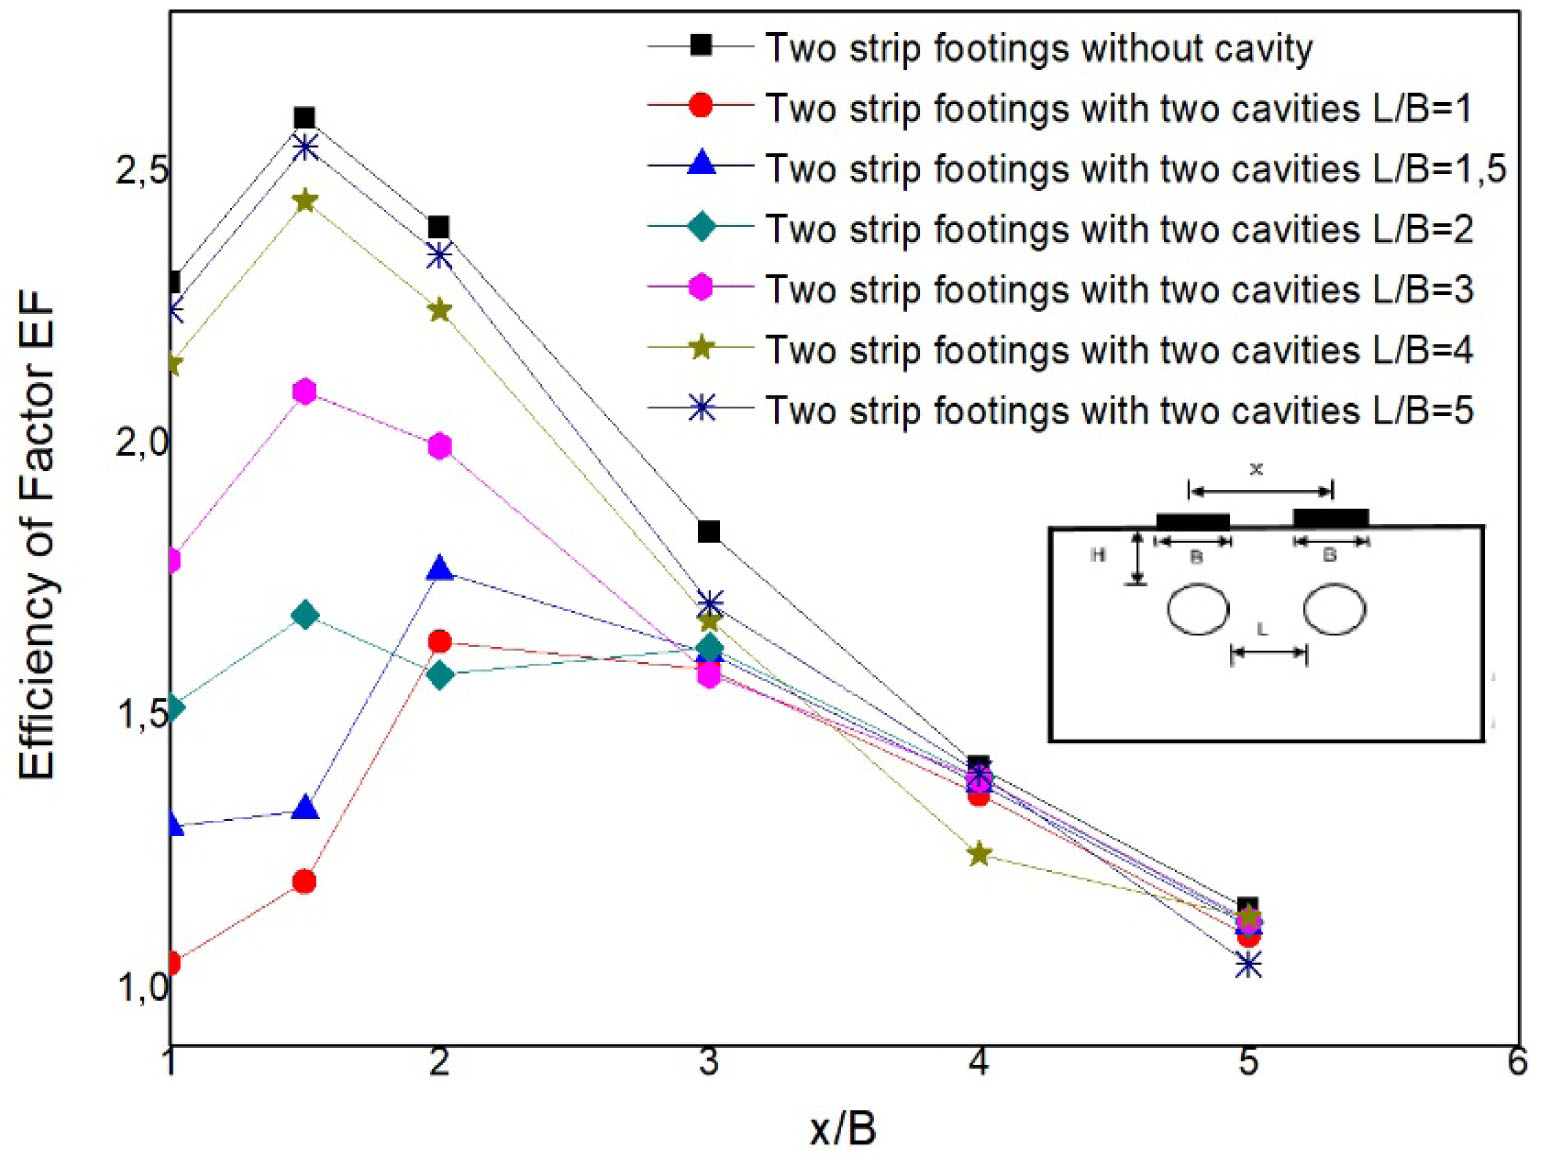
Figure 12
Variation of EF as a function of x/B in the following cases: two strip footings without cavity and with cavity (H/B = 1); (L/B = 1.0, L/B = 1.5, L/B = 2.0, L/B = 3.0, L/B = 4.0, and L/B = 5.0).