
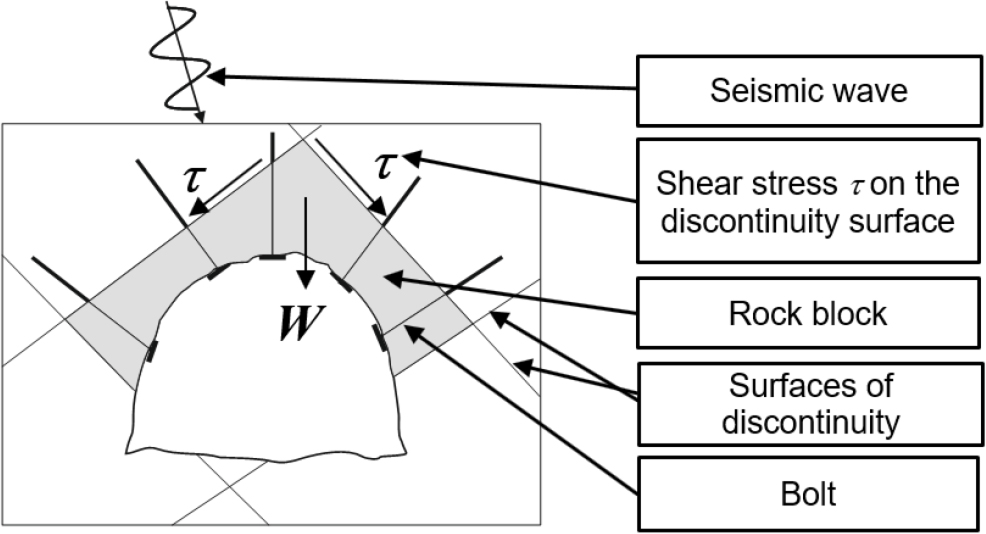
Figure 1
Diagram of a gallery working secured against the falling of a block with a weight W via roof bolting (Cała et al., 2001).
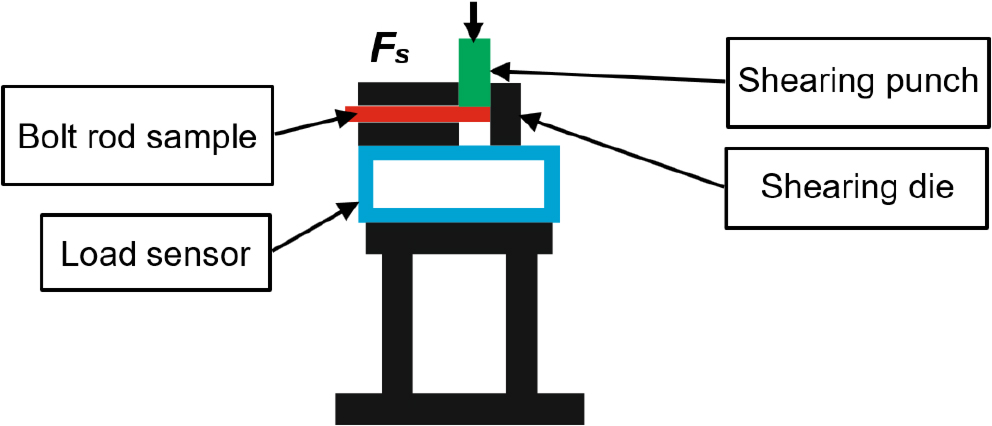
Figure 2
Test facility diagram for bolt rod single shear testing under static loading
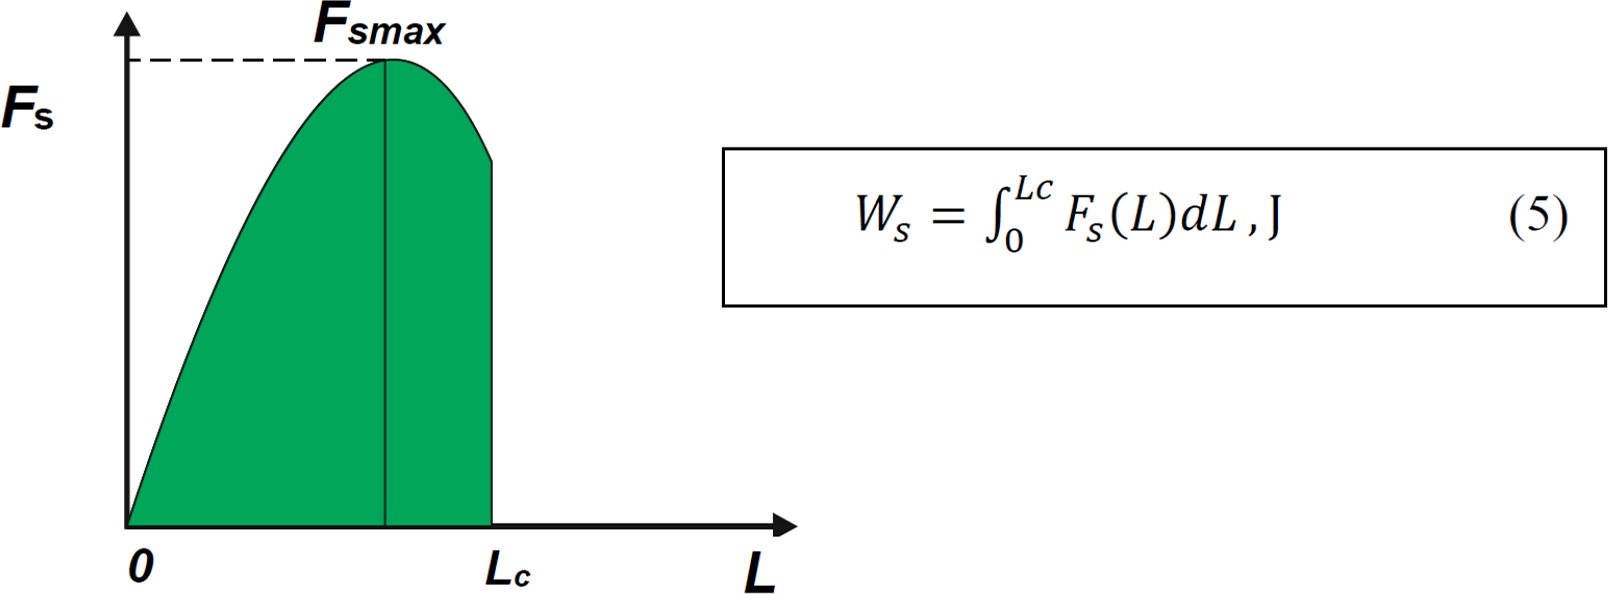
Figure 3
Typical shape of the course Fs = f(L) as well as the area under the curve corresponding to the bolt rod shear work Ws under static loading. Where: Lc – Displacement until the point of rod shearing, mm.
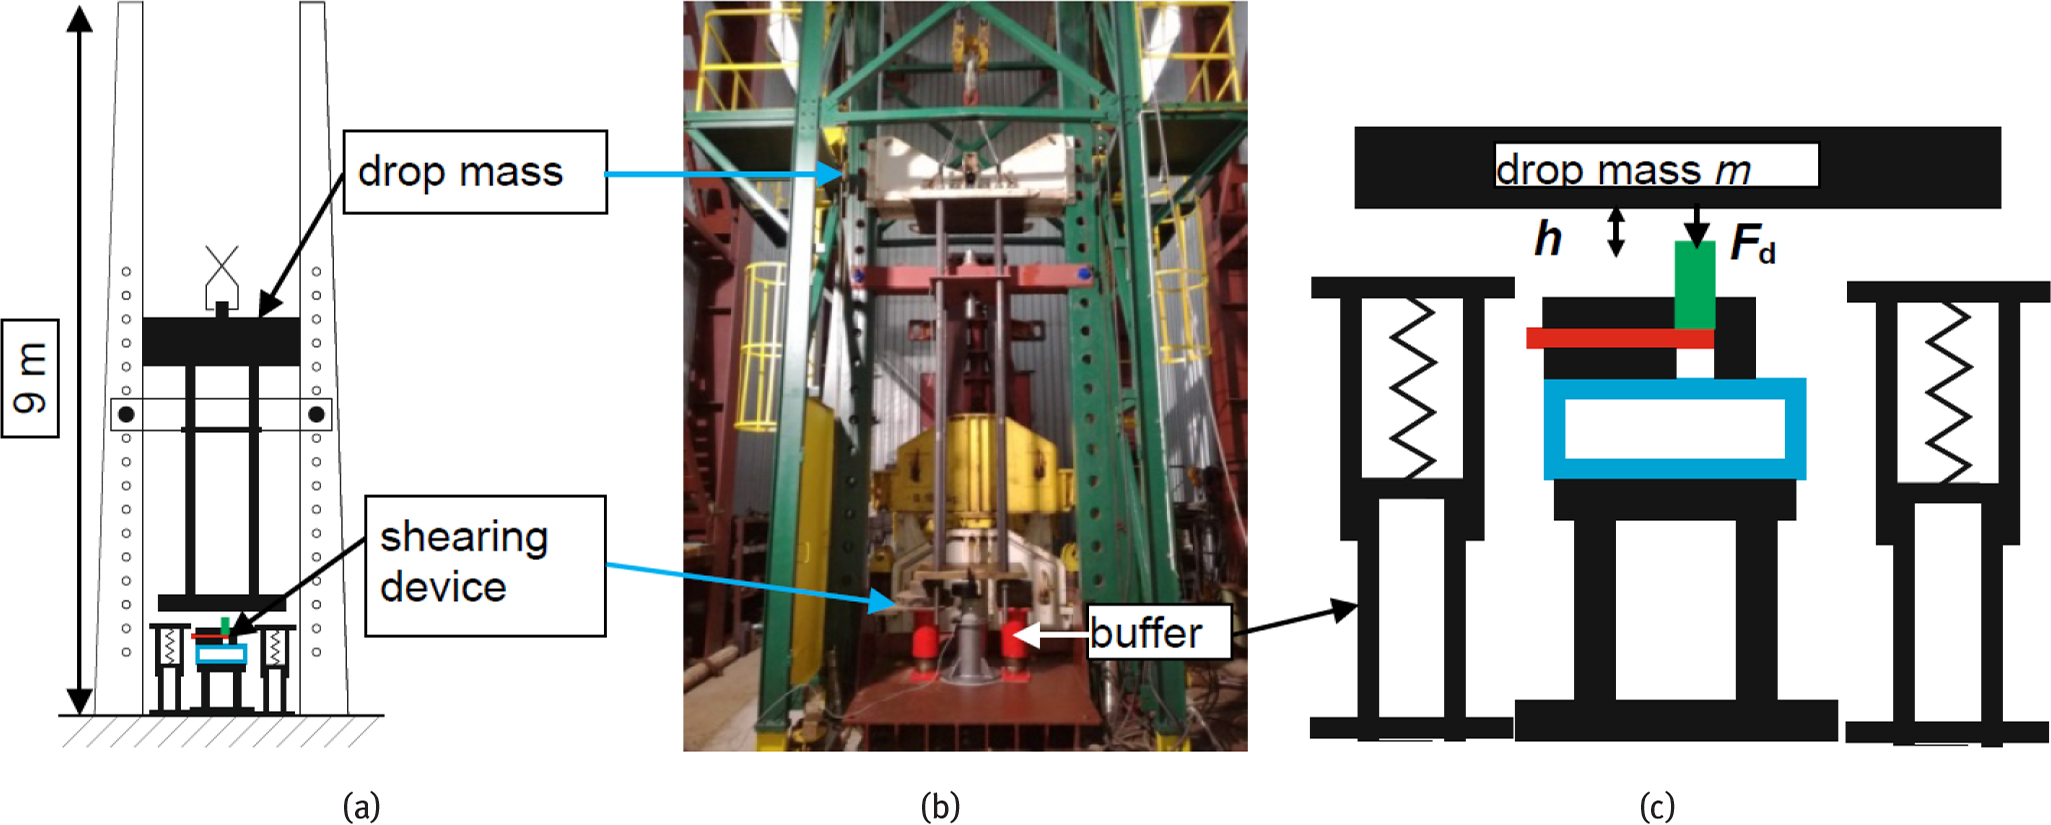
Figure 4
The test facility during single shear impact testing of bolt rods by means of a 2429 kg mass: (a) diagram; (b) view; (c) loading diagram during test.
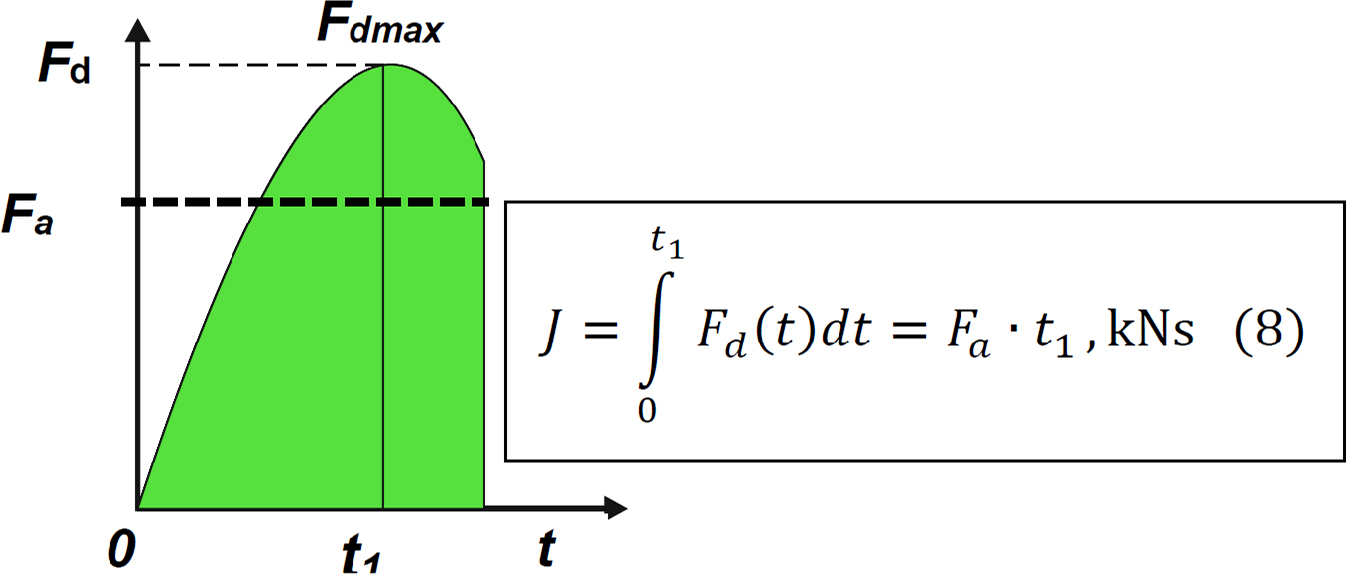
Figure 5
Typical shape of the course Fd = f(t) as well as the area under the curve corresponding to the impulse J of the force during bolt rod shearing. Where: t1 – time until the point of bolt rod shearing, s; Fa – average force during the test, kN.
Table 1
Basic rod dimensions and mechanical properties of steel.
| Bolt type | Grade of steel | Effective bolt rod diameter De, mm | Effective area Ae, mm2 | Ultimate tensile strength Rm, MPa | Elongation at rupture A5, % |
|---|---|---|---|---|---|
| AM18 | A500S | 17.6 | 243.3 | 721.5±16.8 | 18 |
| AM22 | A500sh | 21.6 | 366.4 | 762.3±4.3 | 23 |
| APP | AP600V | 19.7 | 304.8 | 681.3±2.9 | 24 |
| APB | AP770 | 22.1 | 383.6 | 830.4±7.3 | 19 |
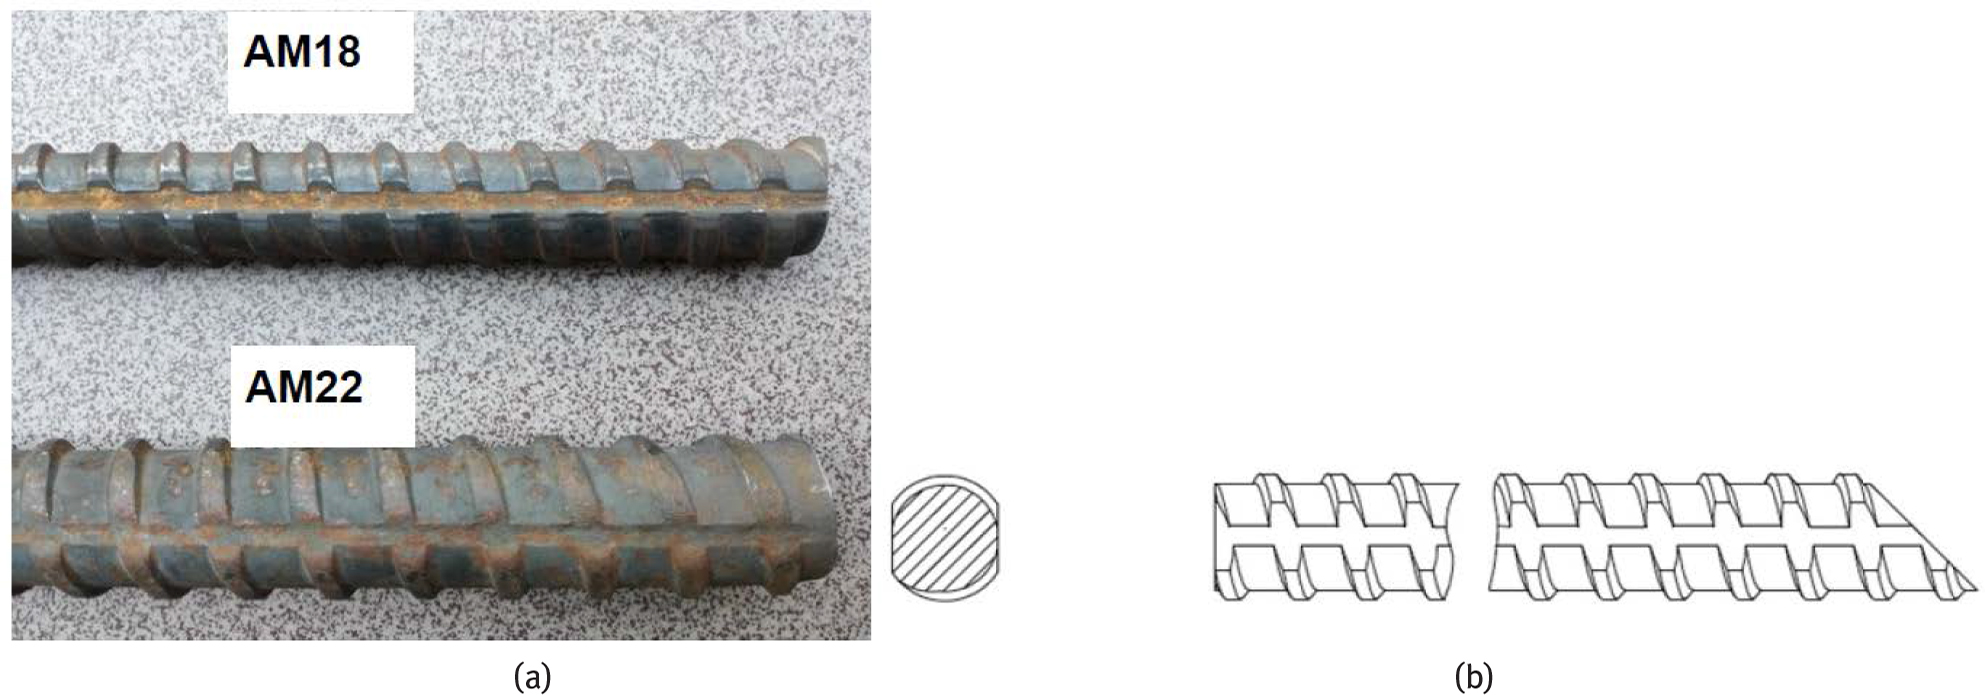
Figure 6
AM18 and AM22-type bolts: (a) and rod thread profile and cross section diagrams (b).
Table 2
Mechanical properties of AM18 and AM22 bolt rods under static shear loading.
| Bolt type | Maximum force Fsmax, kN | Shear strength ts, MPa | Shear displacement Lc, mm | Work Ws, kJ |
|---|---|---|---|---|
| AM18 | 131.9 ± 4.7 | 542.3 ± 19.3 | 8.6 ± 0.2 | 0.775 ± 0.061 |
| AM22 | 217.1 ± 6.7 | 592.5 ± 18.4 | 9.7 ± 0.6 | 1.221 ± 0.131 |
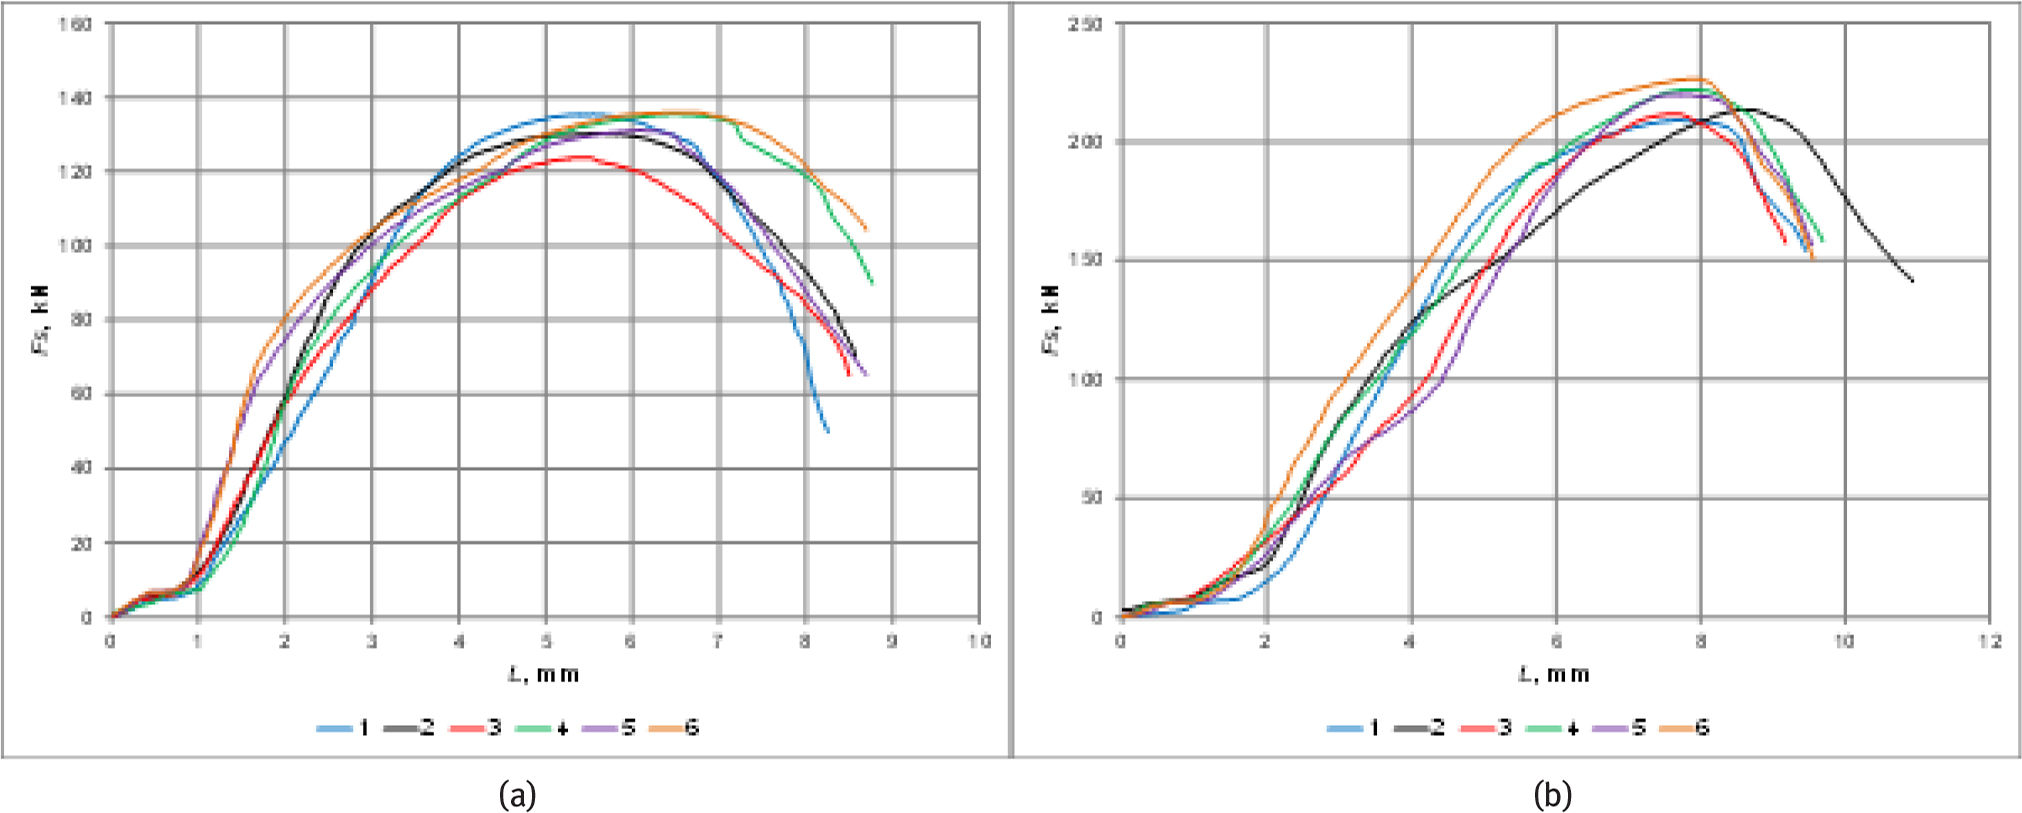
Figure 7
Load Fs curves as functions of shear displacement L of bolt rods: (a) AM18; (b) AM22.
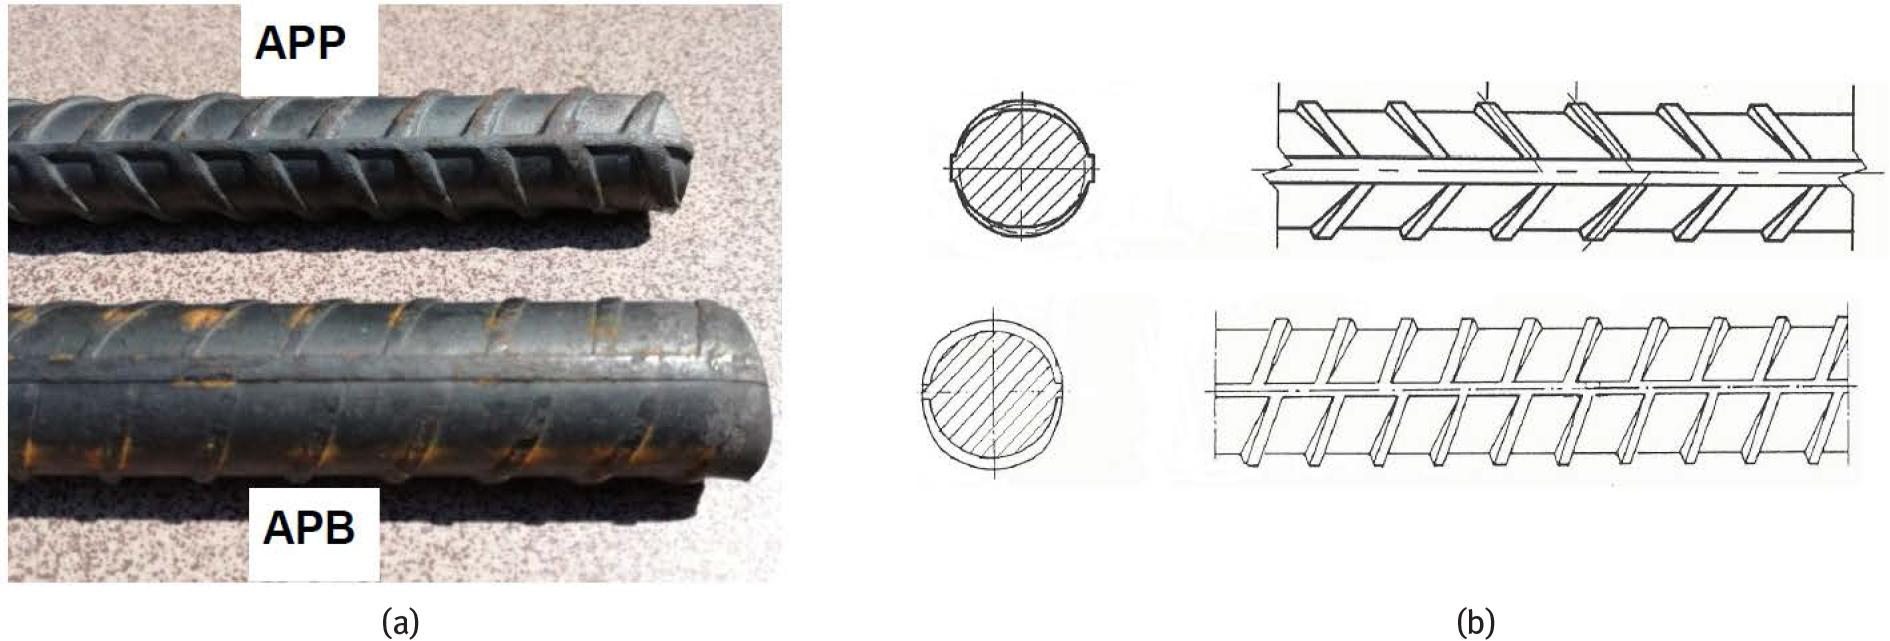
Figure 8
APP and APB-type bolt rods (a) and cross section diagrams (b).
Table 3
Mechanical properties of APP and APB bolt rods under static shear loading.
| Bolt type | Maximum force Fsmax, kN | Shear strength ts, MPa | Shear displacement Lc, mm | Work Ws, kJ |
|---|---|---|---|---|
| APP | 165.2 ± 2.7 | 541.9 ± 9.0 | 9.1 ± 0.4 | 0.971 ± 0.036 |
| APB | 235.1 ± 1.4 | 612.8 ± 3.7 | 8.5 ± 0.2 | 1.340 ± 0.053 |
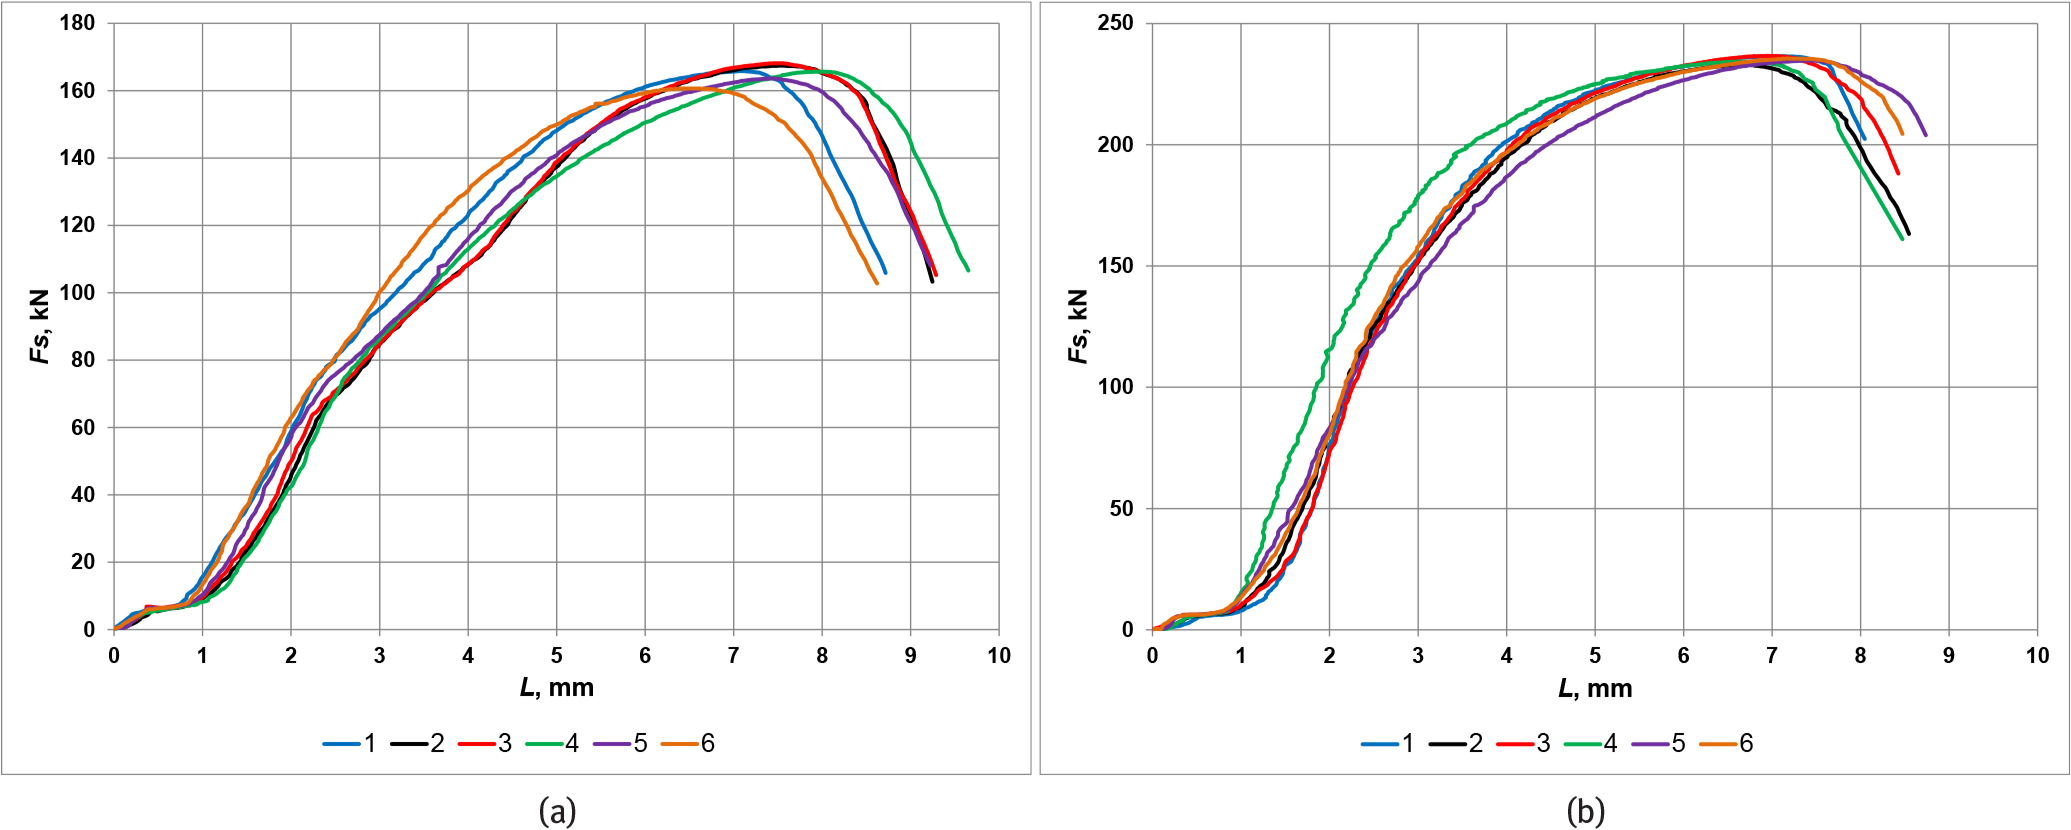
Figure 9
Load Fs curves as functions of shear displacement L of bolt rods: (a) APP; (b) APB.
Table 4
Mechanical properties of AM18 and AM22 bolt rods during single shearing under impact loading.
| Bolt type | Maximum force Fdmax, kN | Shear strength td, MPa | Work Wd, kJ |
|---|---|---|---|
| AM18 | 135.3 ± 4.0 | 556.0 ± 16.6 | 0.630 ± 0.032 |
| AM22 | 225.5 ± 7.0 | 615.6 ± 19.1 | 1.203 ± 0.064 |
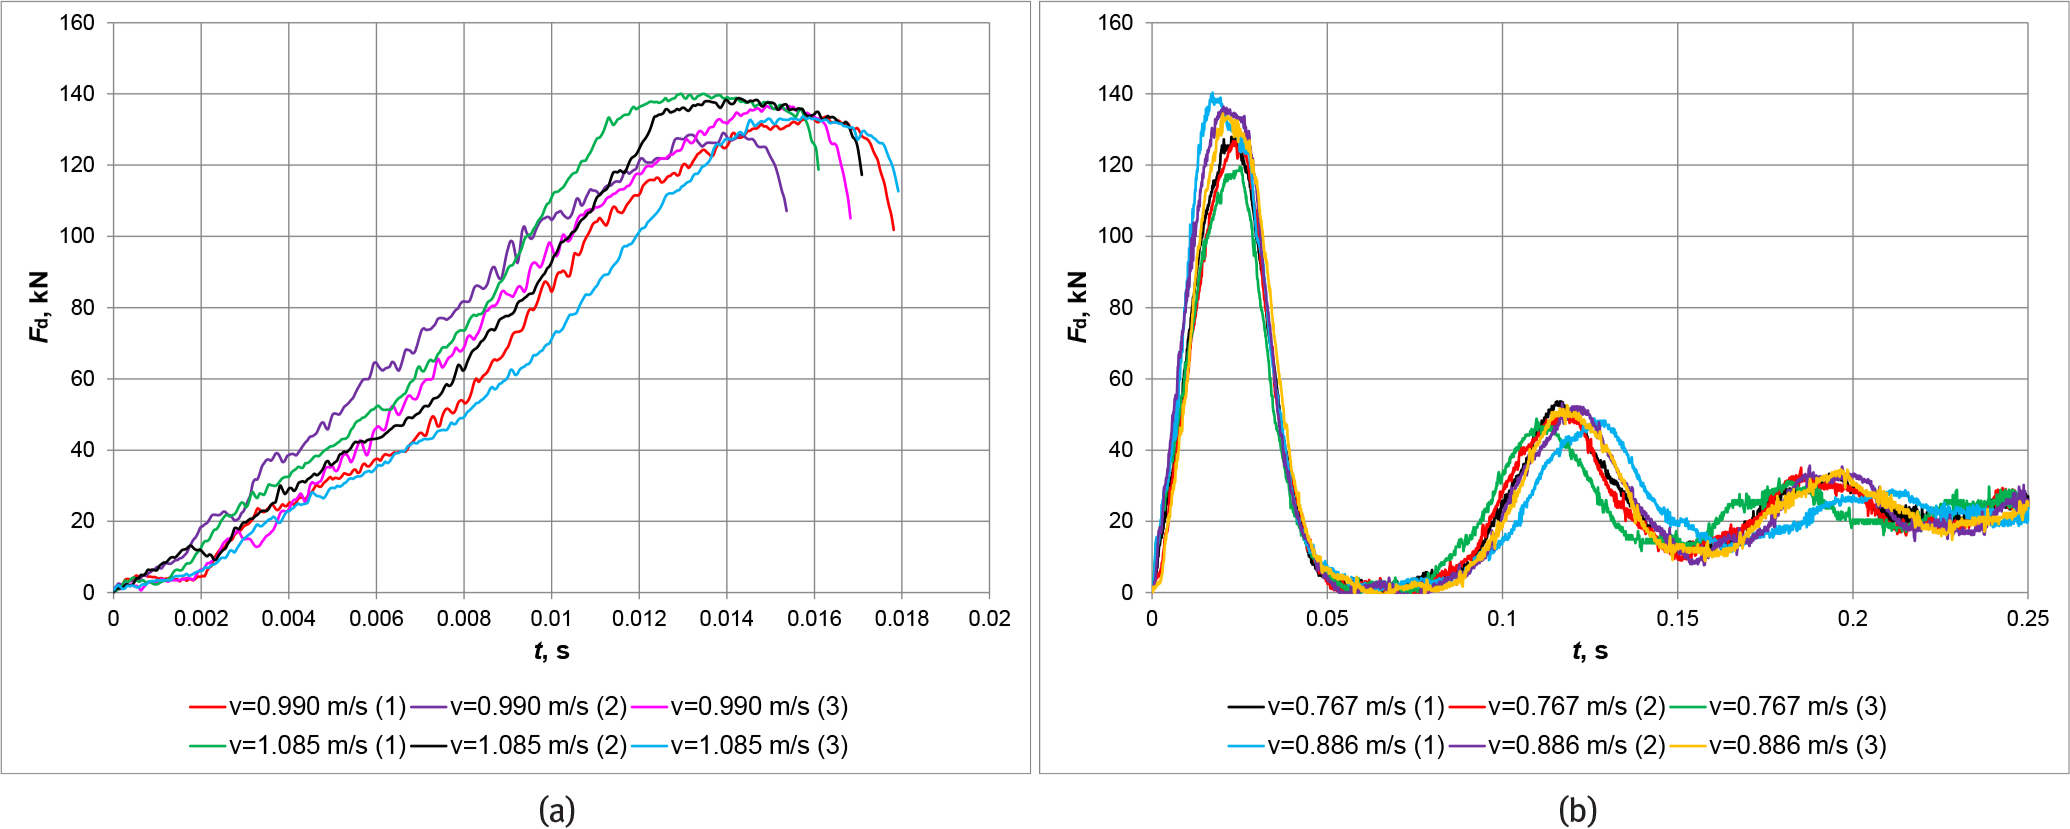
Figure 10
AM18 bolt rod load Fd curves as functions of time t: (a) the rod was shorn.; (b) the rod was not shorn.
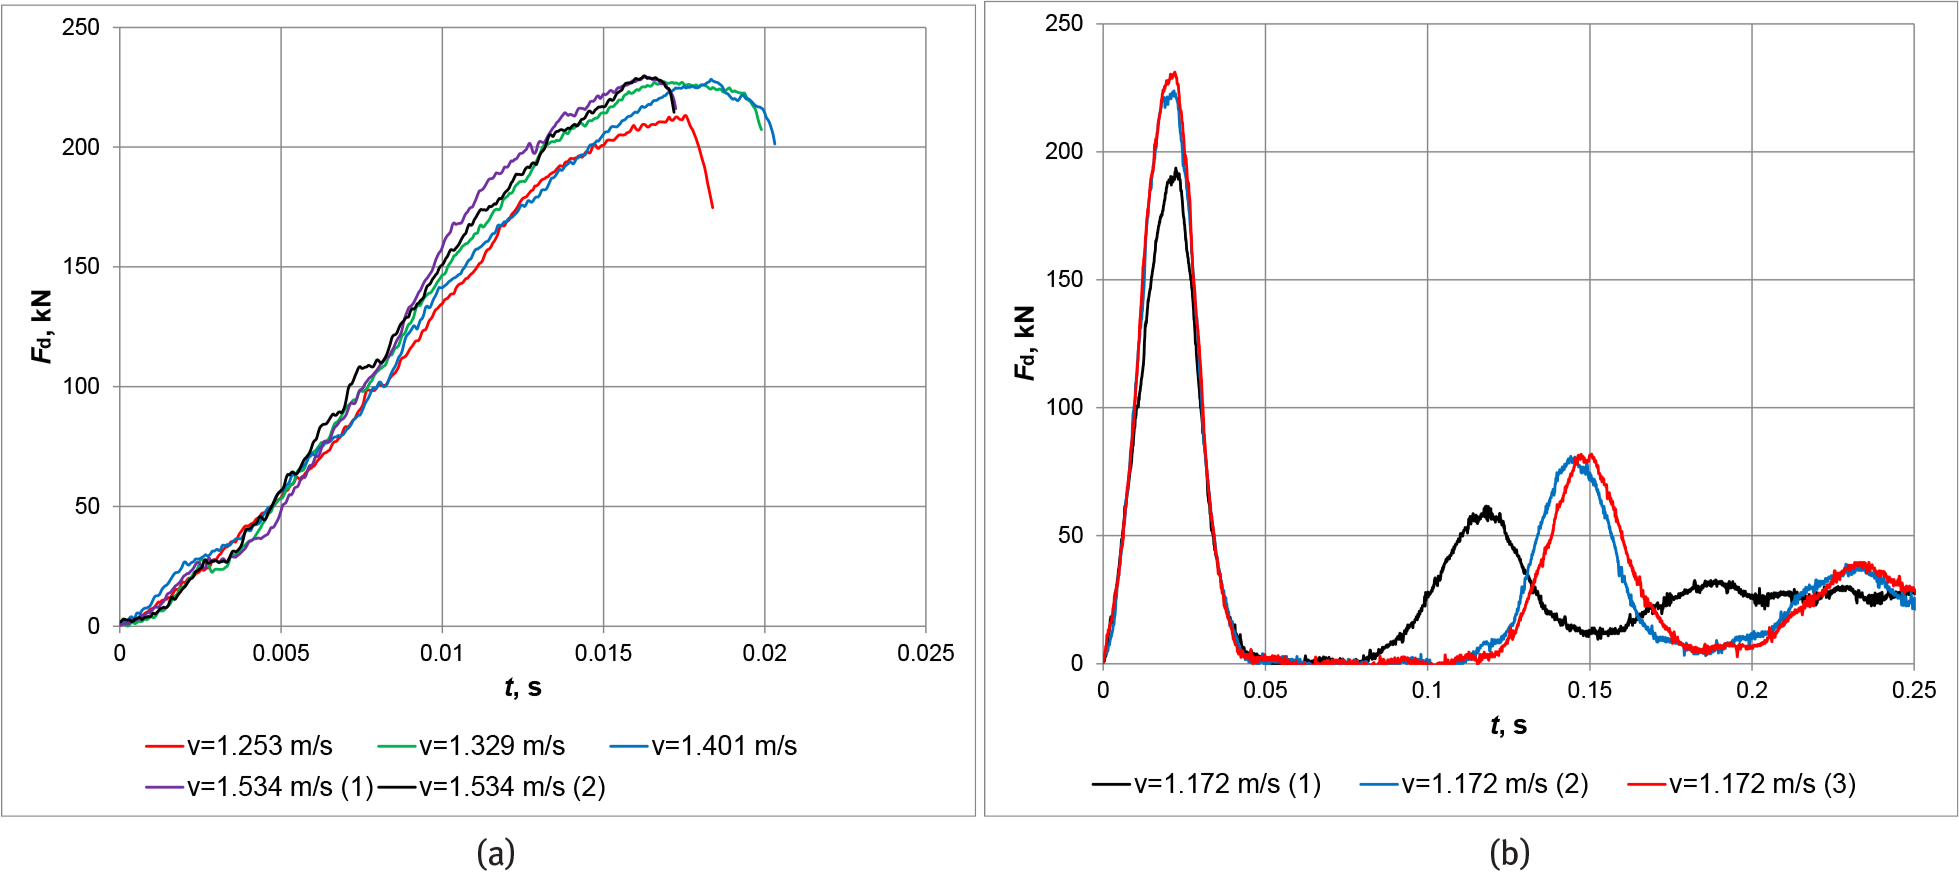
Figure 11
AM22 bolt rod load Fd curves as functions of time t: (a) the rod was shorn.; (b) the rod was not shorn.
Table 5
Mechanical properties of APP and APB bolt rods during single shearing under impact loading.
| Bolt type | Maximum force Fdmax, kN | Shear strength td, MPa | Work Wd, kJ |
|---|---|---|---|
| APP | 174.2 ± 2.5 | 571.6 ± 8.3 | 0.945 ± 0.033 |
| APB | 252.0 ± 3.6 | 656.9 ± 9.5 | 1.269 ± 0.062 |
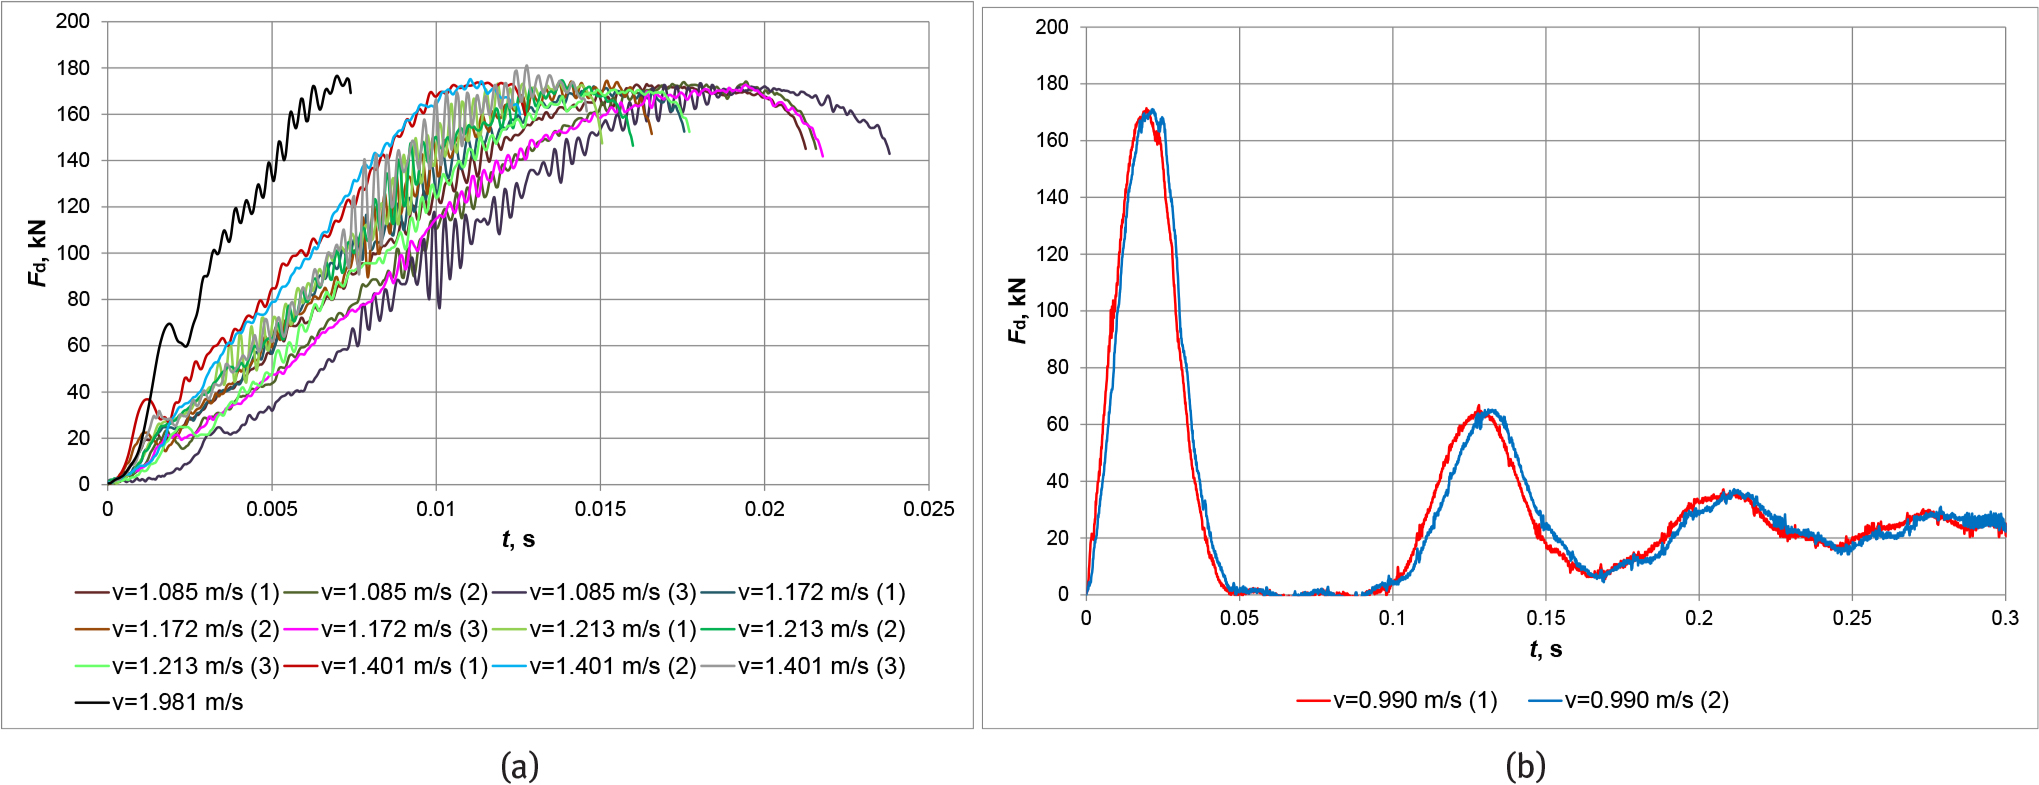
Figure 12
APP bolt rod load Fd curves as functions of time t: (a) the rod was shorn; (b) the rod was not shorn.
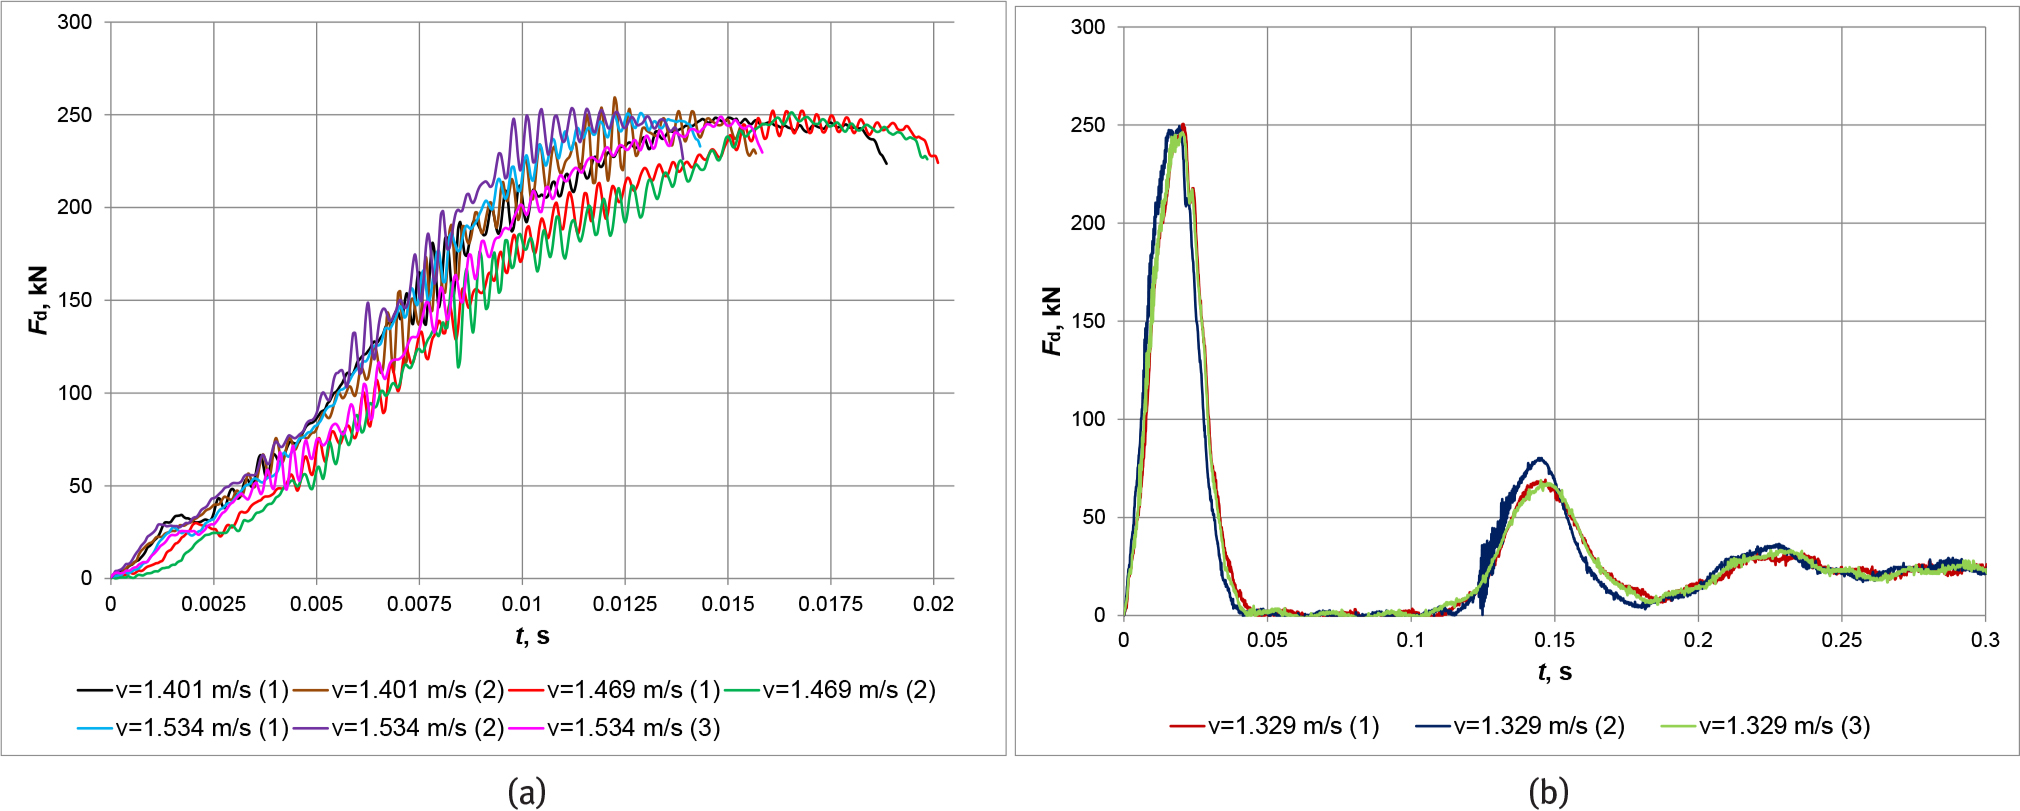
Figure 13
APB bolt rod load Fd curves as functions of time t: (a) the rod was shorn; (b) the rod was not shorn.
Table 6
Comparison of bolt rod mechanical properties under static and dynamic loading (part 1).
| Bolt type | Grade of steel | Fmax, kN | Rm, MPa | Fsmax, kN | ts, MPa | Ws, kJ | ts/Rm | Fdmax, kN | td, MPa | Wd, kJ | td/Rm |
|---|---|---|---|---|---|---|---|---|---|---|---|
| AM18 | A500S | 175.5 ± 4.1 | 721.5 ± 16.8 | 131.9 ± 4.7 | 542.3 ± 19.3 | 0.775 ± 0.061 | 0.752 | 135.3 ± 4.0 | 556.0 ± 16.6 | 0.630 ± 0.032 | 0.771 |
| AM22 | A500sh | 279.3 ± 1.6 | 762.3 ± 4.3 | 217.1 ± 6.7 | 592.5 ± 18.4 | 1.221 ± 0.131 | 0.777 | 225.5 ± 7.0 | 615.6 ± 19.1 | 1.203 ± 0.064 | 0.808 |
| APP | AP600V | 207.7 ± 0.9 | 681.3 ± 2.9 | 165.2 ± 2.7 | 541.9 ± 9.0 | 0.971 ± 0.036 | 0.795 | 174.2 ± 2.5 | 571.6 ± 8.3 | 0.945 ± 0.033 | 0.839 |
| APB | AP770 | 318.6 ± 2.8 | 830.4 ± 7.3 | 235.1 ± 1.4 | 612.8 ± 3.7 | 1.340 ± 0.053 | 0.738 | 250.8 ± 1.9 | 656.9 ± 9.5 | 1.269 ± 0.062 | 0.791 |
Table 7
Comparison of bolt rod mechanical properties under static and dynamic loading (part 2).
| Bolt type | Fdmax/Fsmax, % | td/ts, % | Ed/Es, % |
|---|---|---|---|
| AM18 | 102.6 | 102.5 | 81.3 |
| AM22 | 103.9 | 103.9 | 98.5 |
| APP | 105.4 | 105.5 | 97.3 |
| APB | 106.7 | 107.2 | 94.7 |
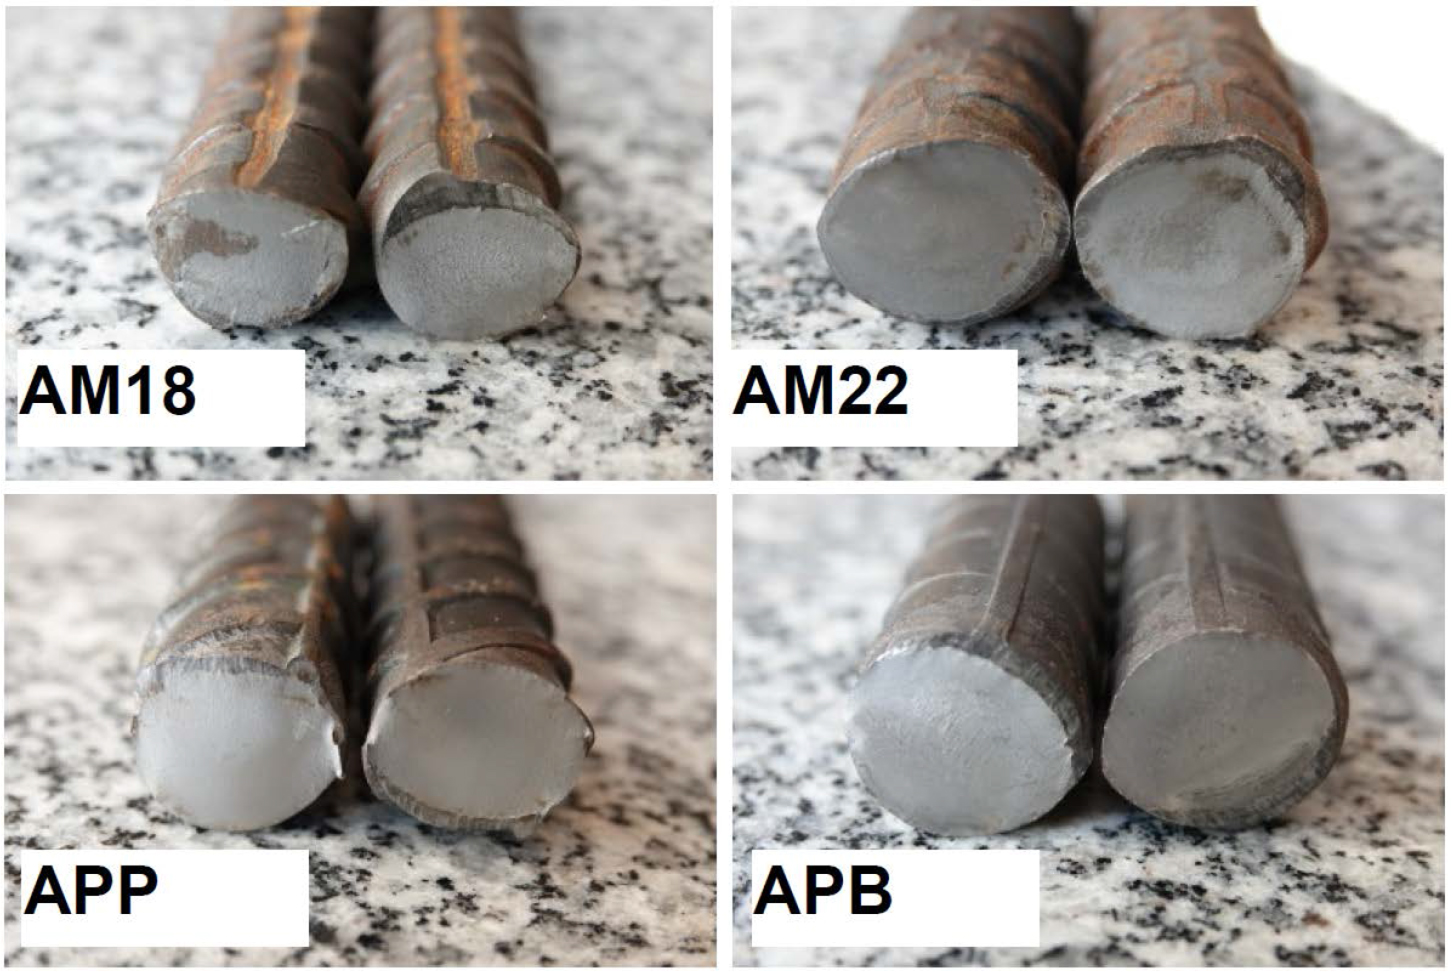
Figure 14
Samples view after single shear testing under impact loading.
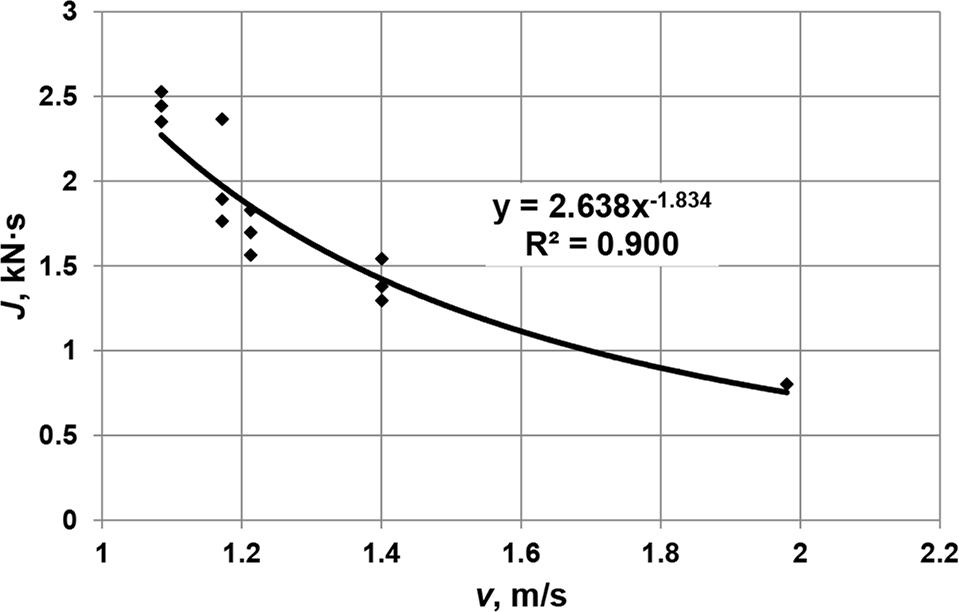
Figure 15
Chart of the relationship J = f(v) obtained during APP bolt testing.
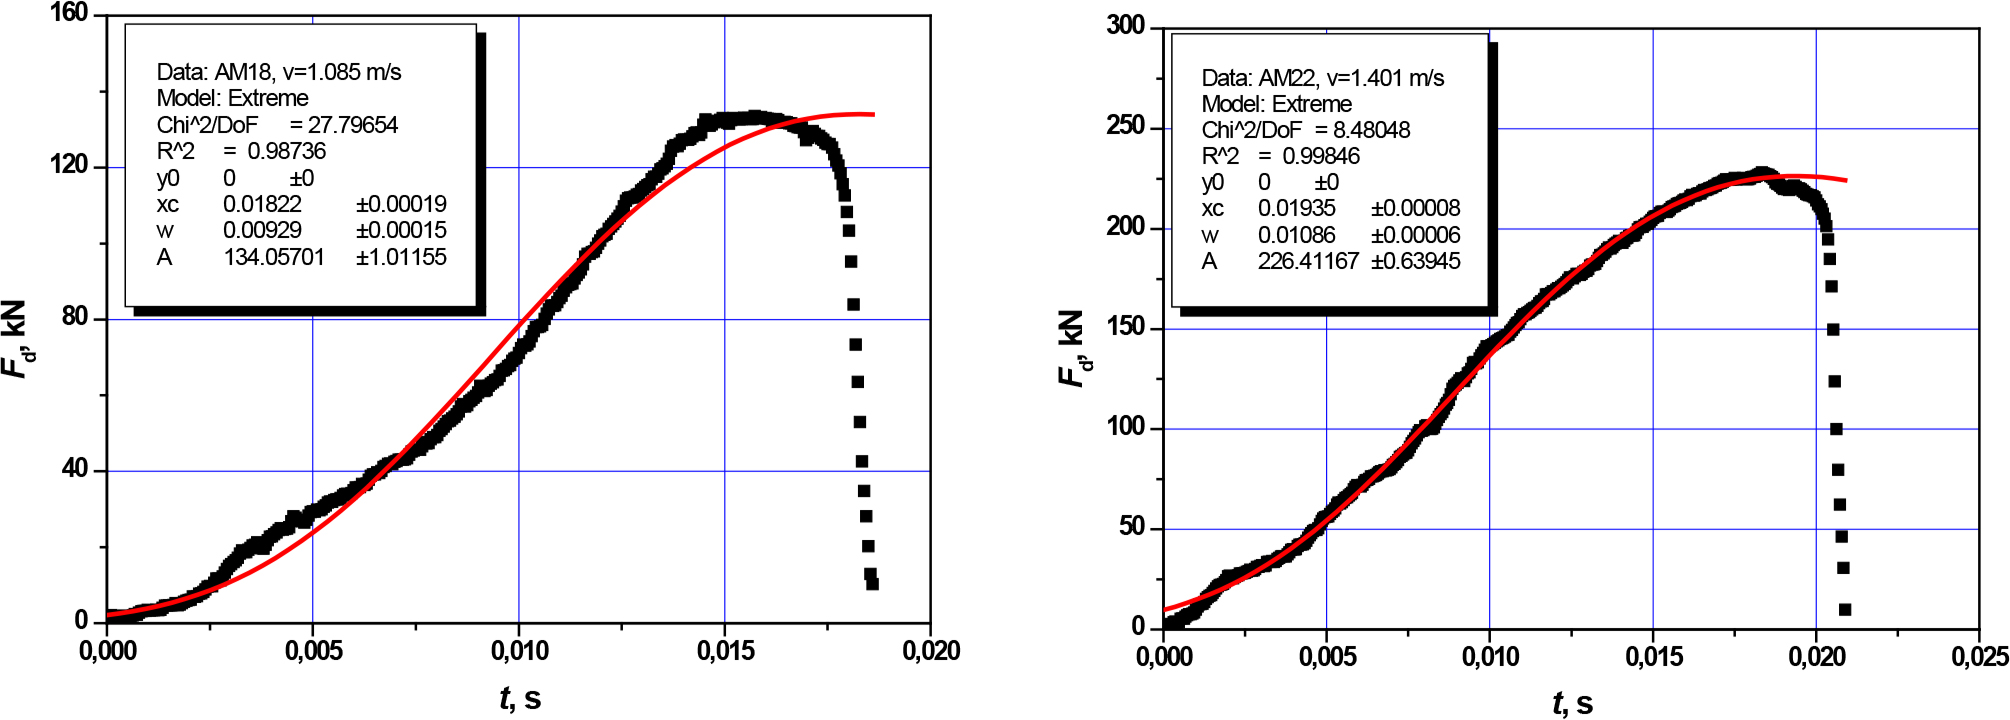
Figure 16
Estimated AM18 and AM22 bolt rod shearing functions during single shear testing under impact loading.
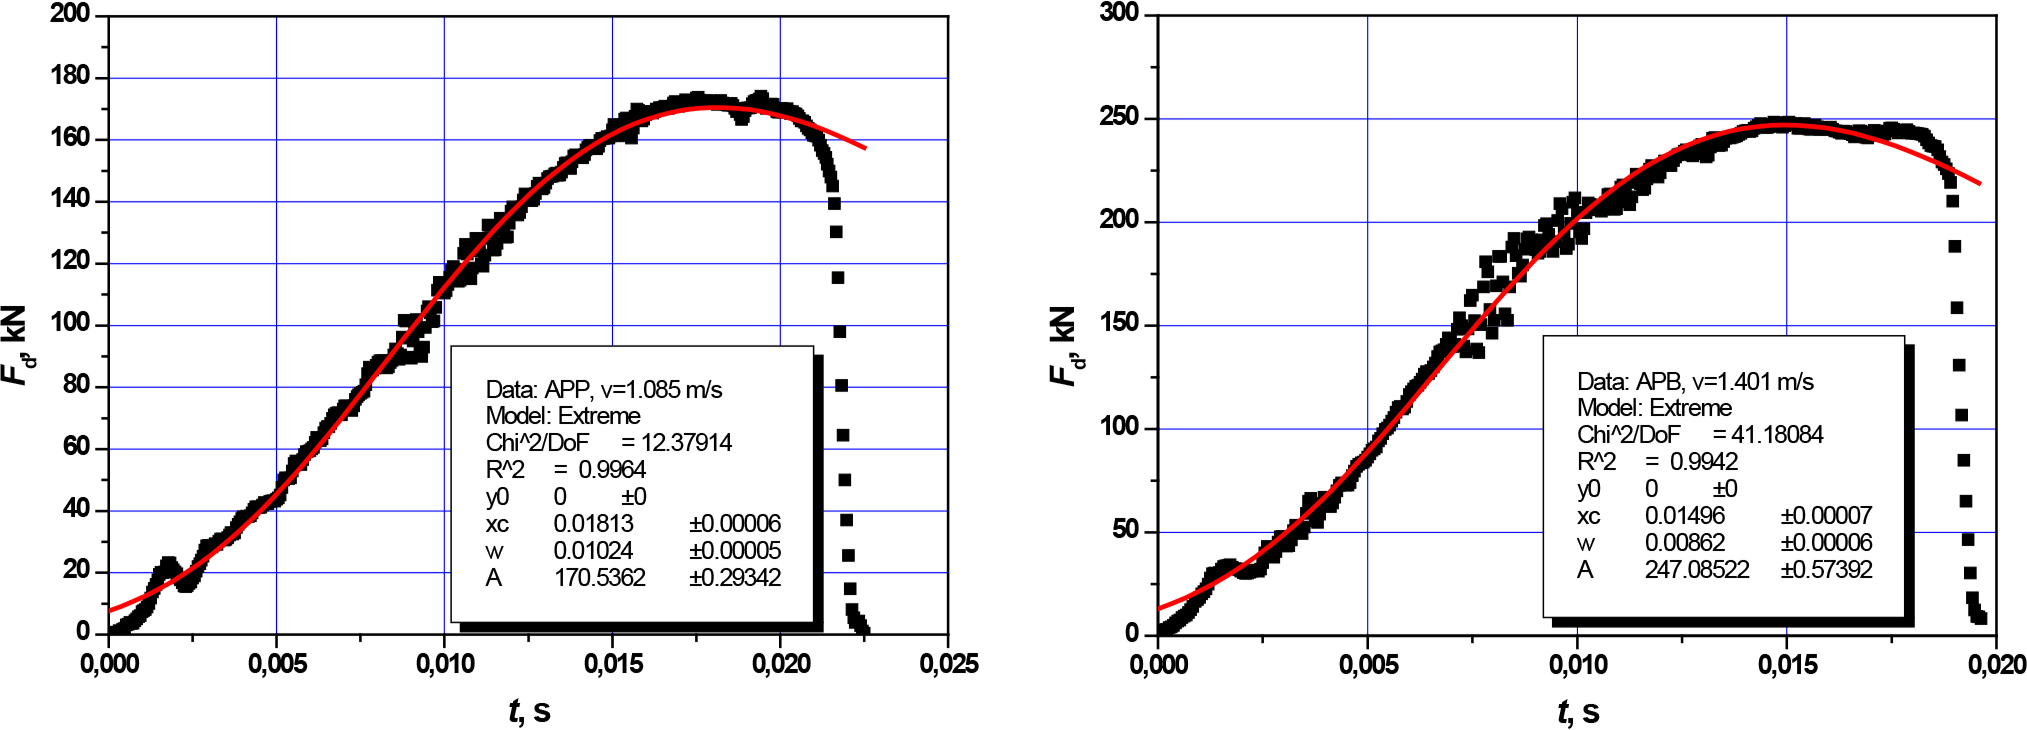
Figure 17
Estimated APP and APB bolt rod shearing functions during single shear testing under impact loading.