

Figure 1
Profiles of crushing plates: a) flat, b) triangular, c) rounded, d) trapezoidal
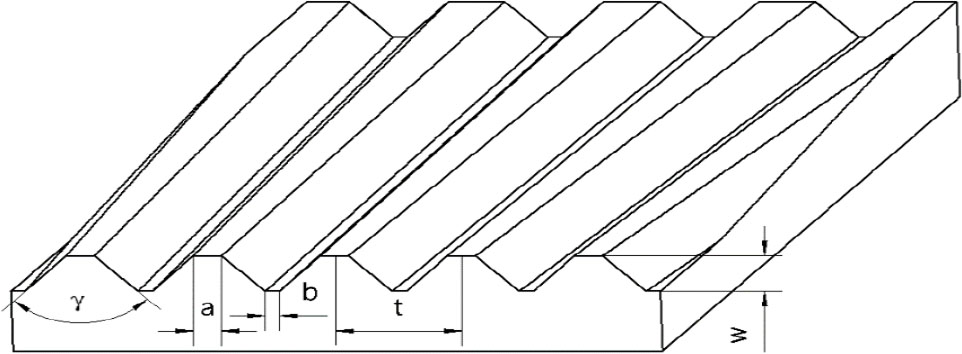
Figure 2
Crushing plate profile dimensions: t - pitch, distance between teeth, w - teeth height, a - crushing surface width, γ - teeth walls inclination angle, b - width of the bottom of teeth
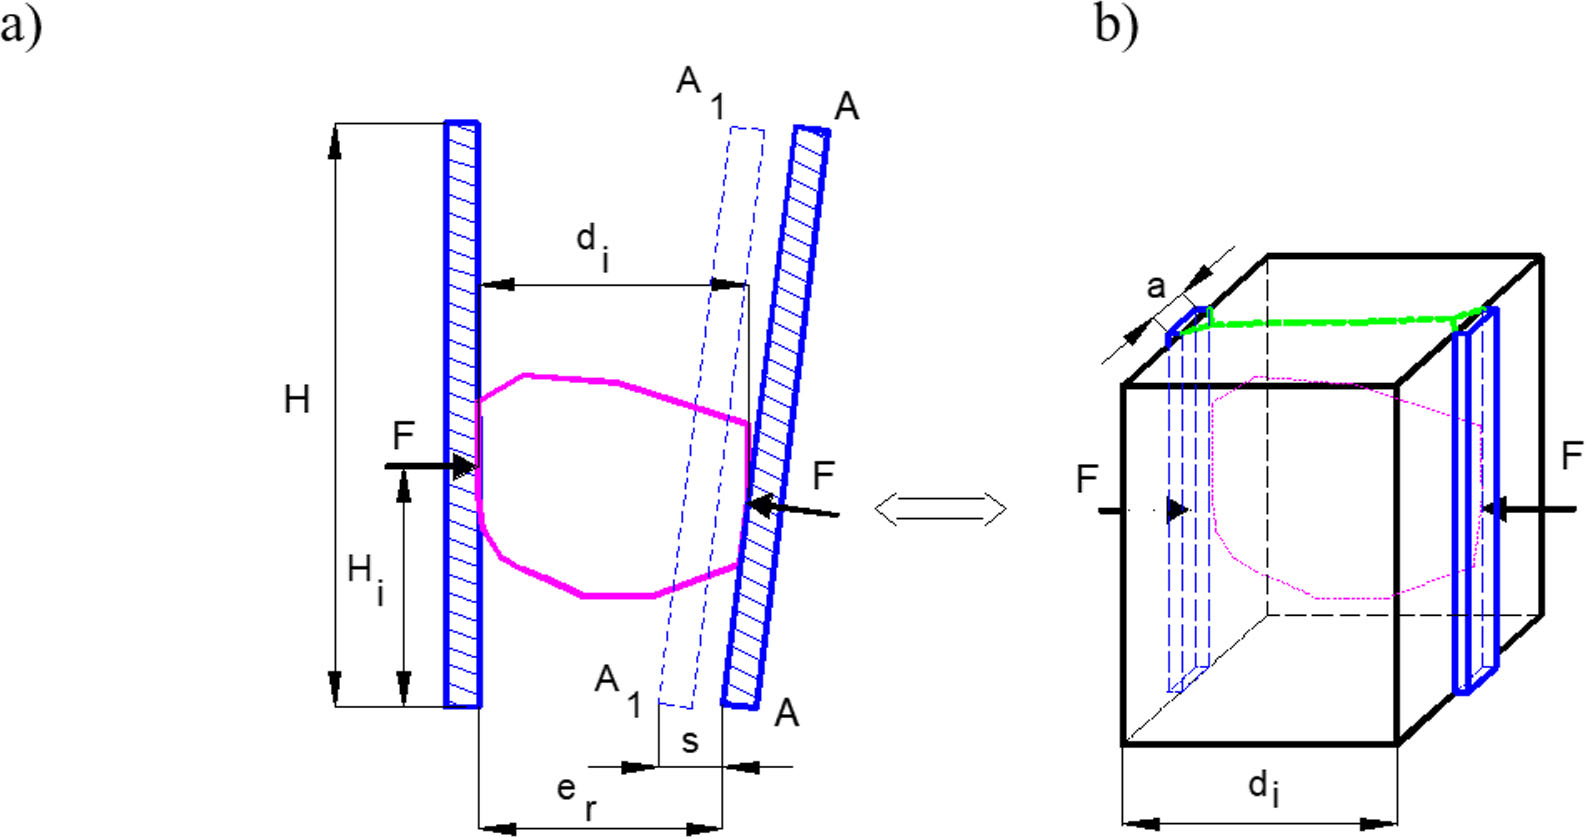
Figure 3
The crushing process in the space of the jaw crusher a) compression in jaw crusher, b) elementary case of the crushing modeling – compressing the rock block between flat stamps
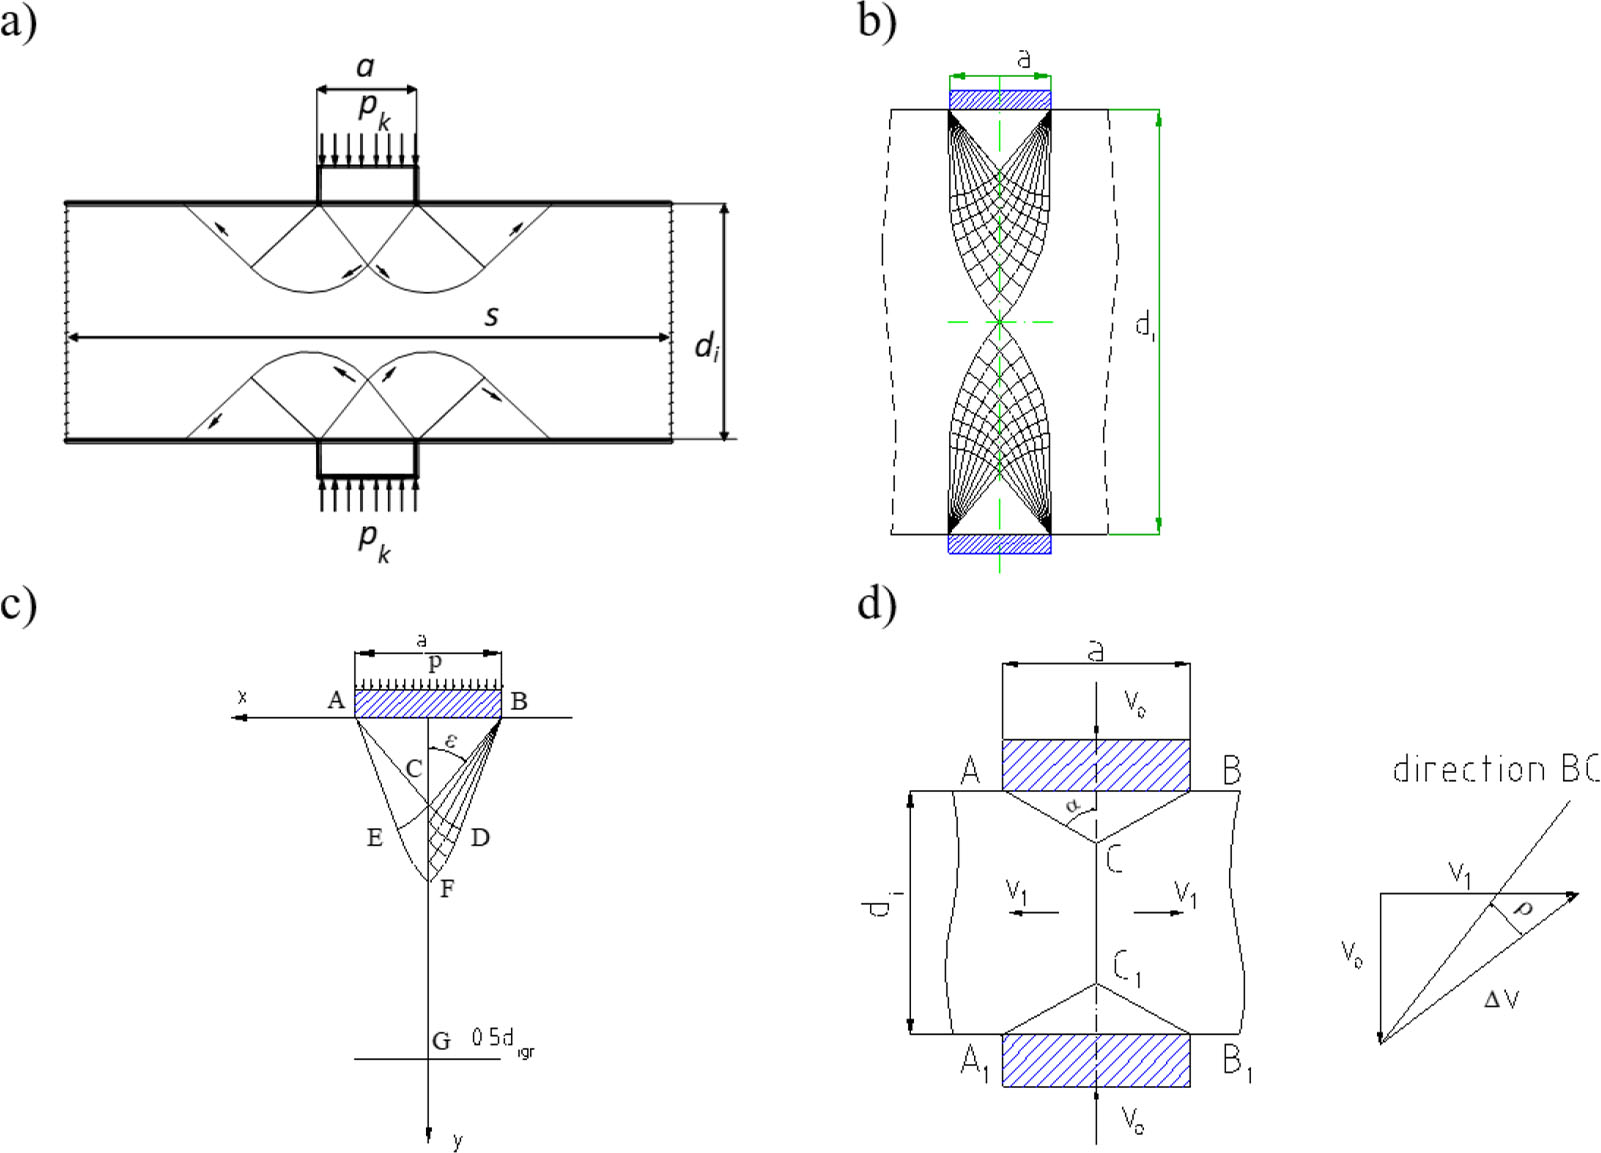
Figure 4
Local and global failure mechanism: a) Prandtl failure mechanism (Prandtl[33]), b) global failure mechanism (method of characteristics) for di/a = 12.22 and ρ = 15°, c) solution for the modified Coulomb condition, the method of characteristics grid for ρ = 10°, Sc/Sr = 5, d) determination of the upper limit: block compressed by flat stamps (modified condition)
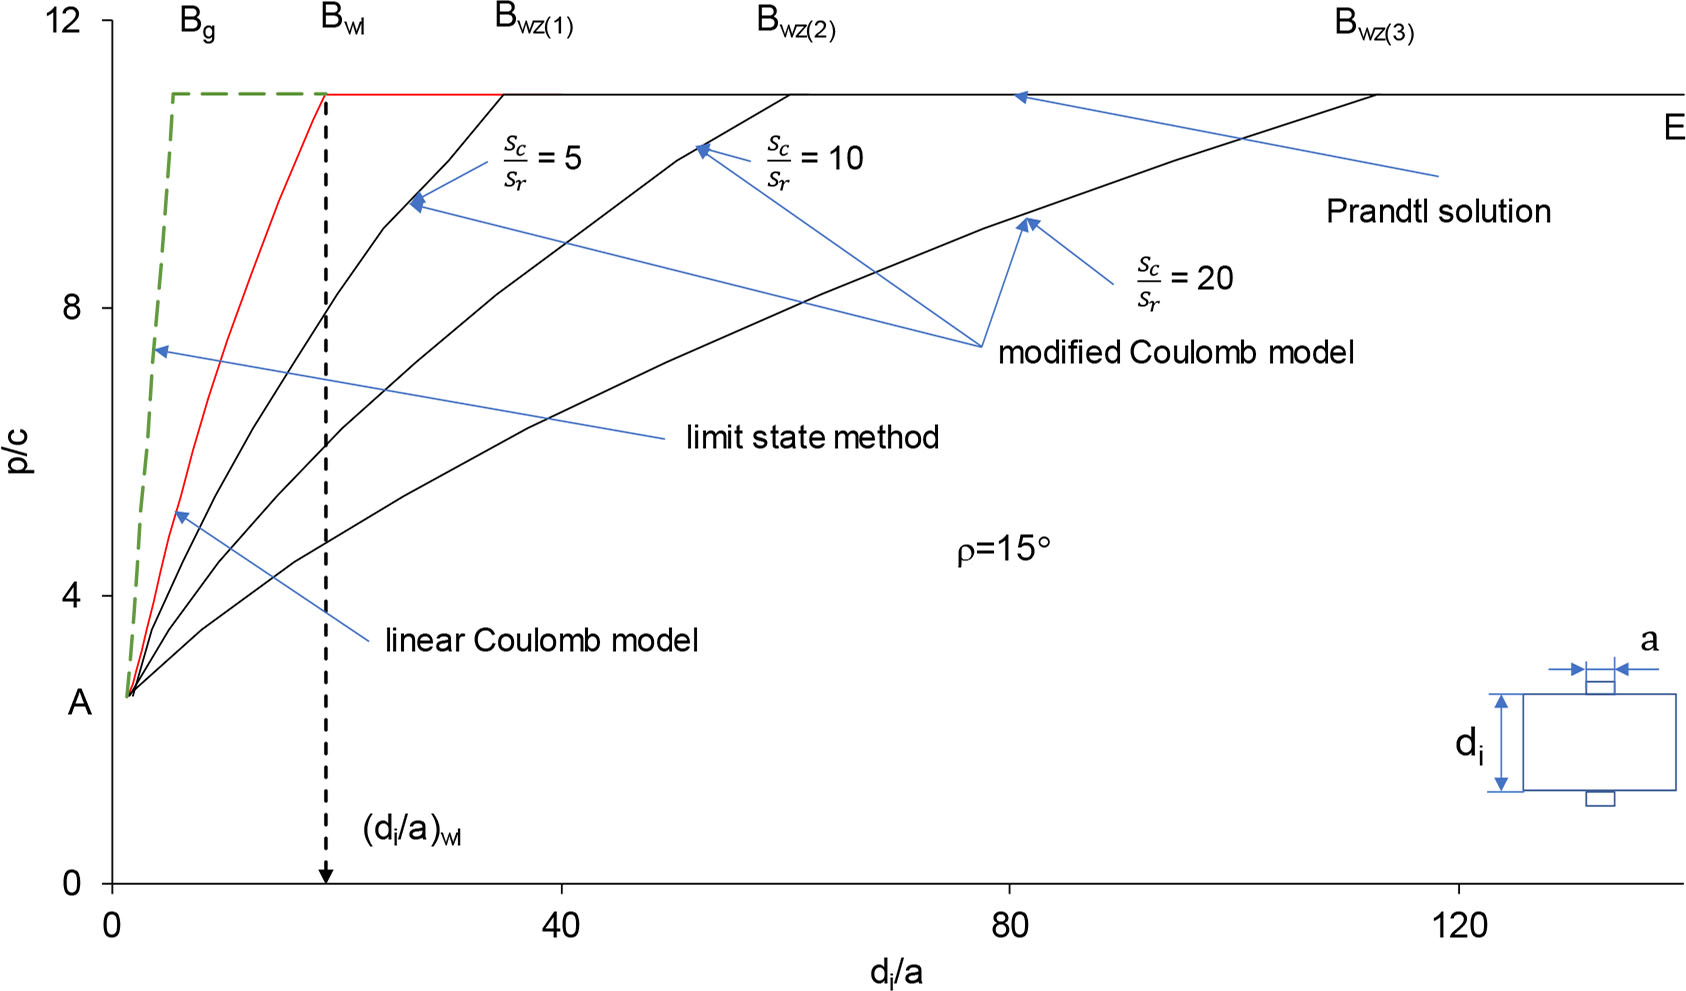
Figure 5
Limit load p/c as a function of di/a
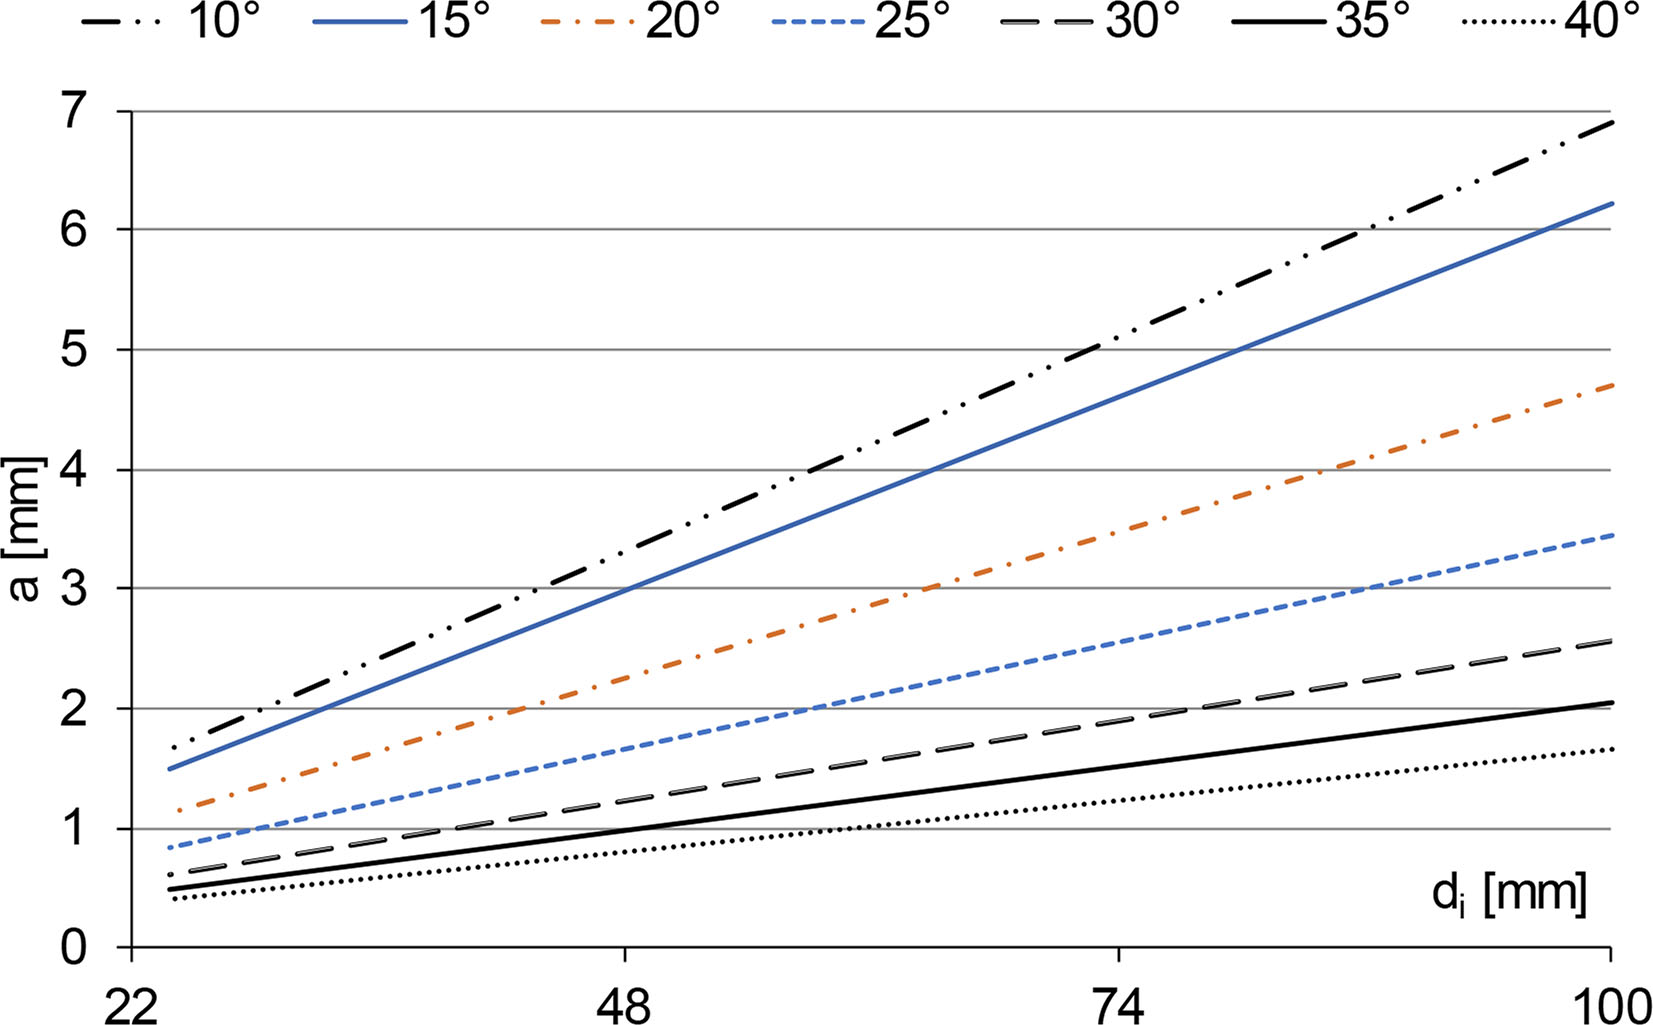
Figure 6
Determining the optimal dimensions of a stamp width for different internal friction angles ρ using the method of characteristics and the linear Coulomb condition for the laboratory crusher
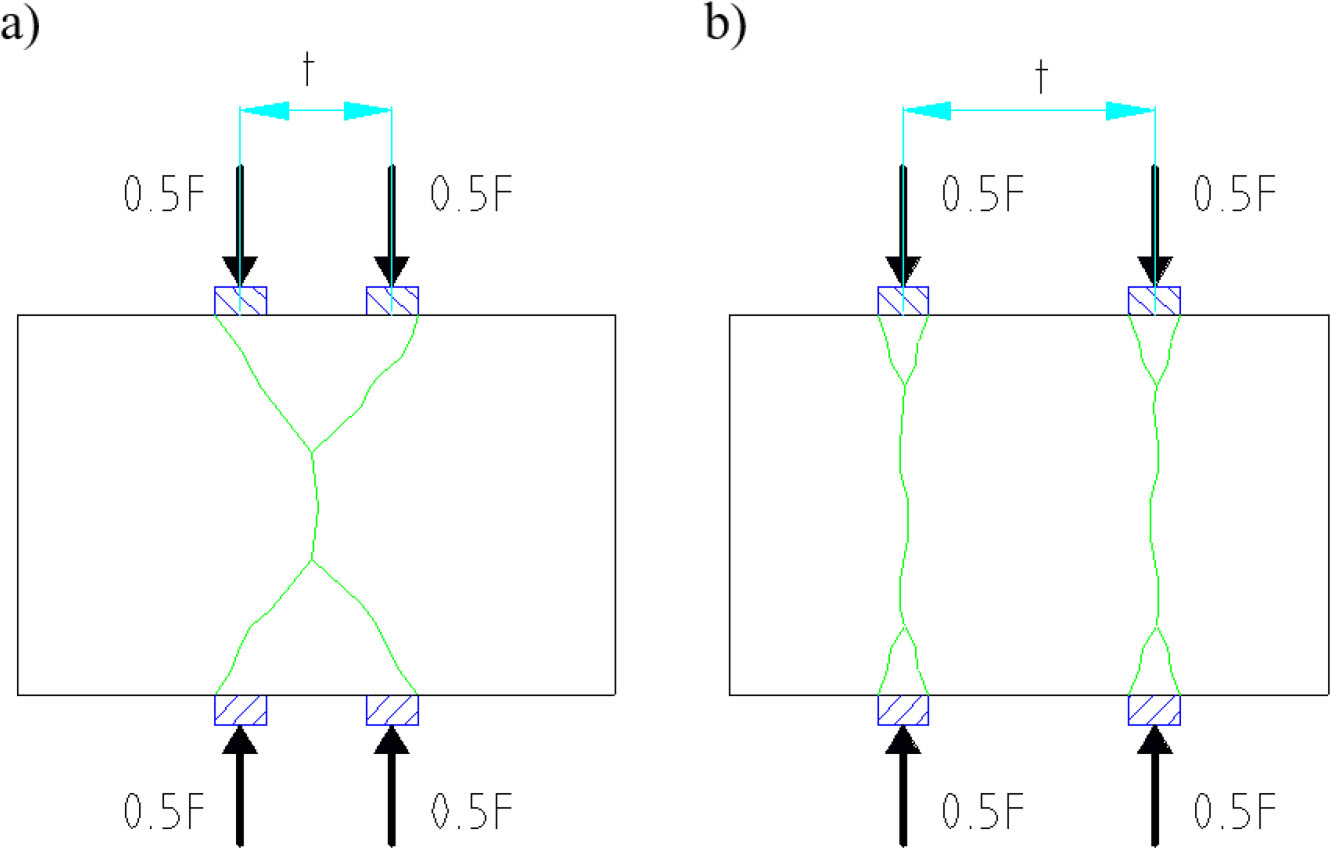
Figure 7
Failure mechanism for coaxially arranged stamps for various pitch length

Figure 8
Crushing of “Mucharz” sandstone by a group of four flat coaxially arranged stamps. Sample failure mechanisms for different t/h ratios: a) 0.08; b) 0.23; c) 0.38; d) 0.45; e) 0.72; f) 0.94
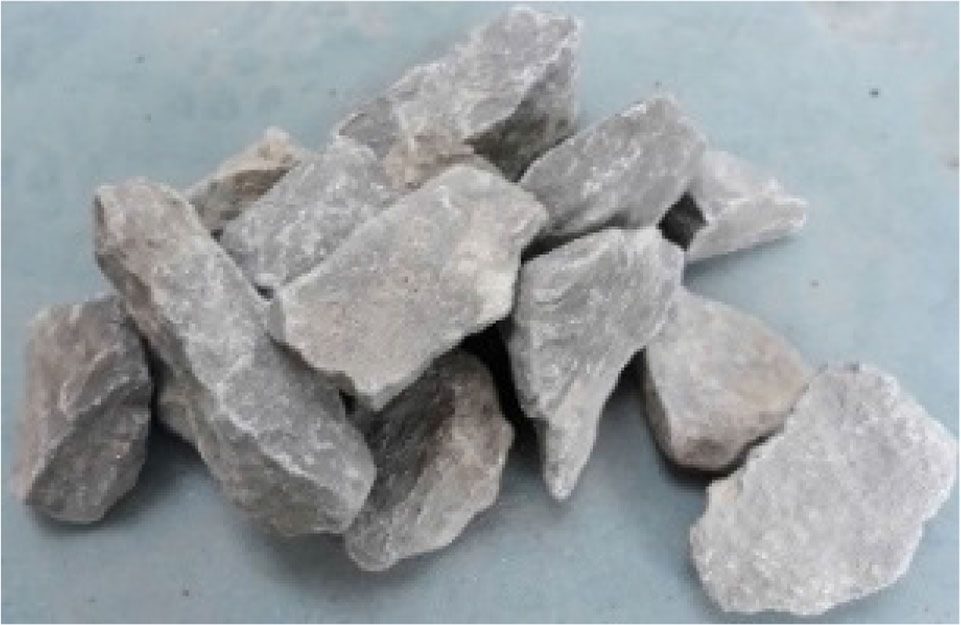
Figure 9
An example of the specimen prepared for laboratory tests
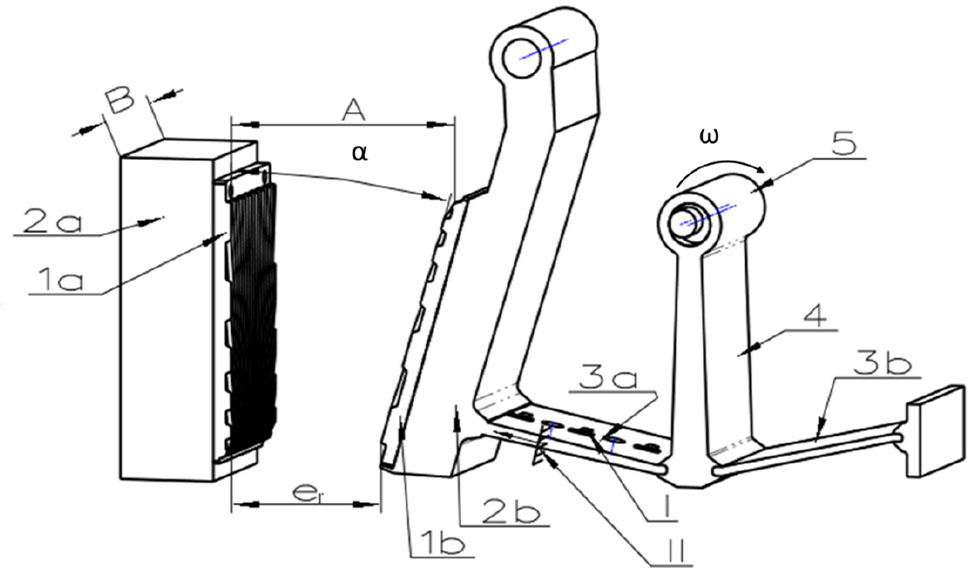
Figure 10
Scheme of the model jaw crusher: 1a, 1b – crushing plates, 2a – fixed jaw, 2b – moving jaw, 3a, 3b front end rear toggle, 4 – pitman, 5 – eccentric shaft, a, b – width and length of the inlet slot, I – force measurement system, II – moving jaw displacement measurement system
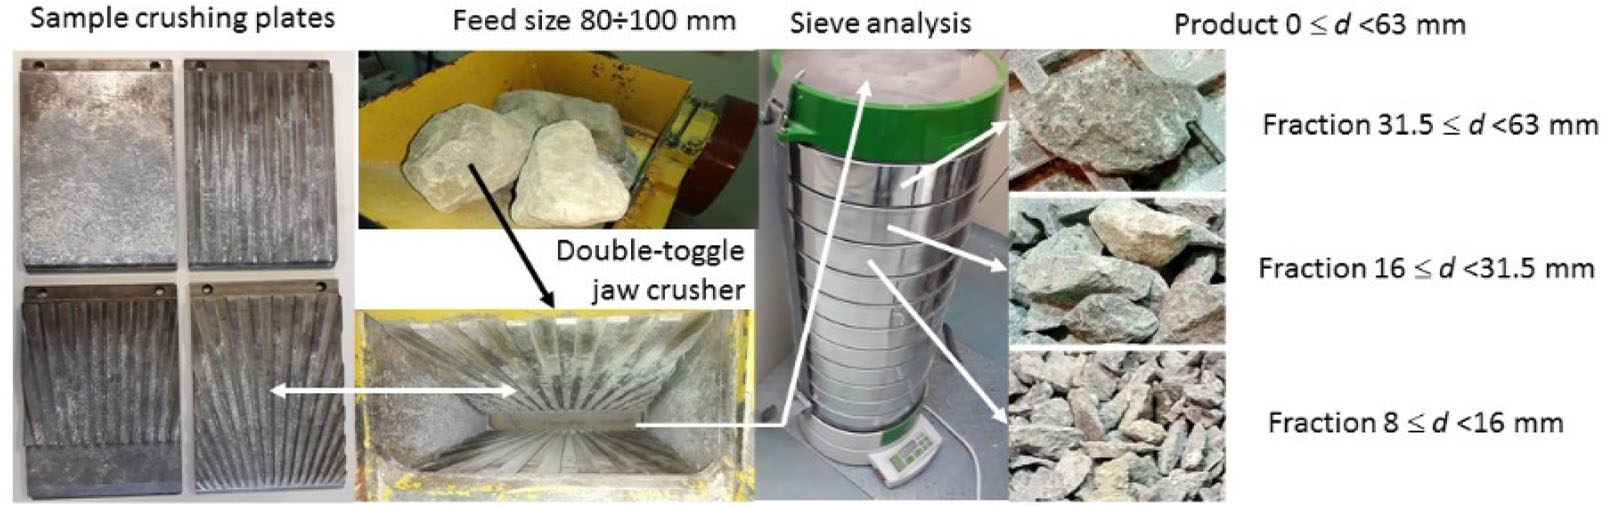
Figure 11
Diagram of crushing process – feed size, crusher’s working chamber, sample crushing plates, sample product fractions (fraction 8–16, 16–31.5, 31.5–63 mm)
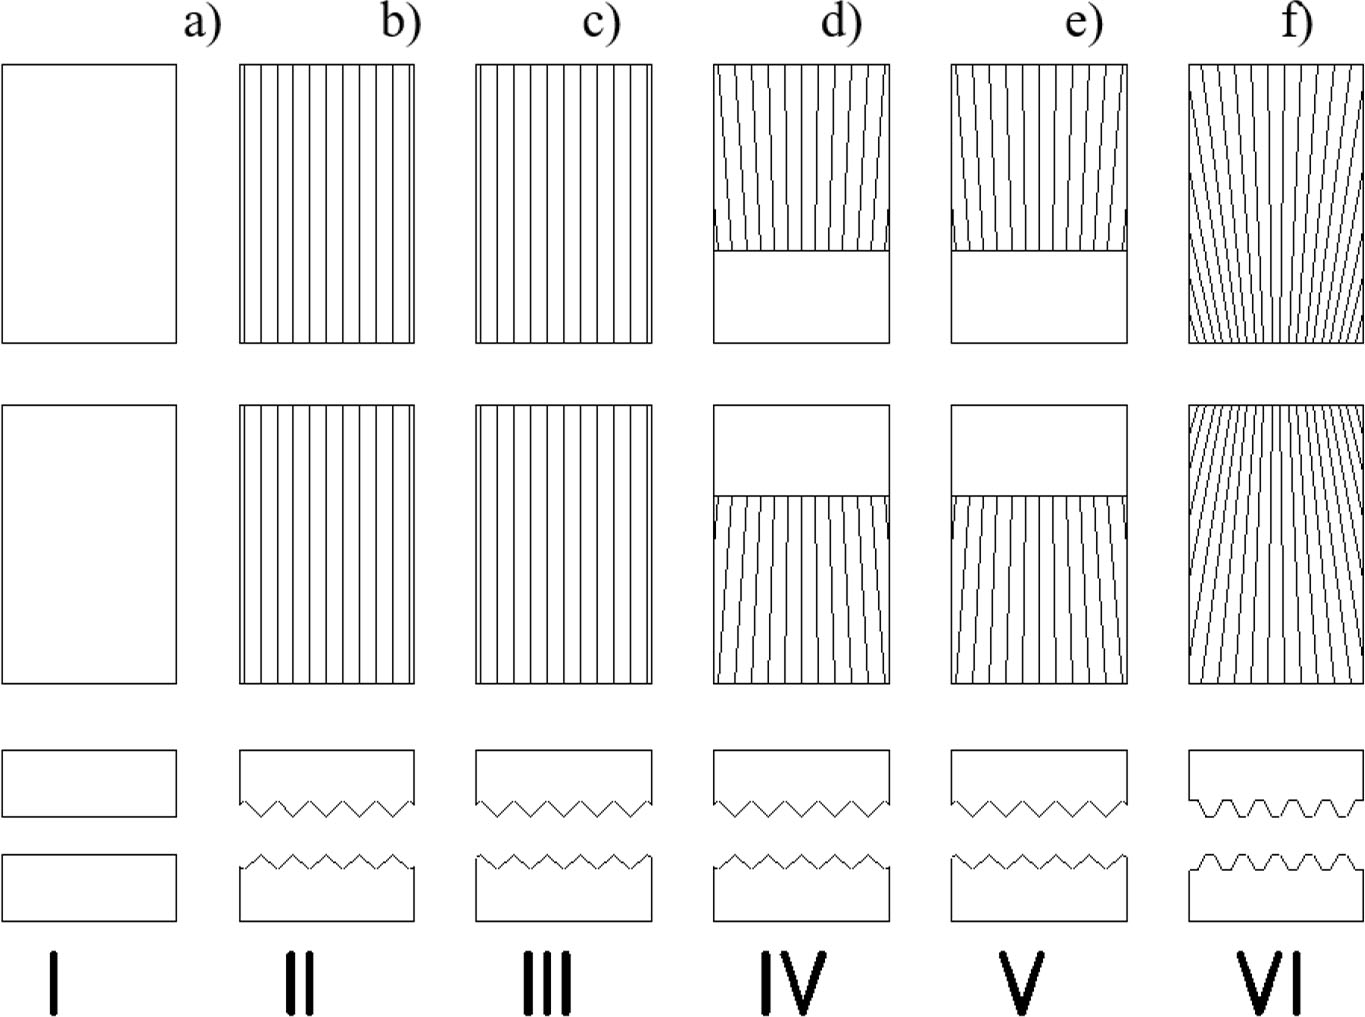
Figure 12
Plates used in the laboratory tests: a) flat, b, c) triangular profile, d, e) variable pitch and height of the teeth, f) variable width and pitch of the teeth (Fig. 6)
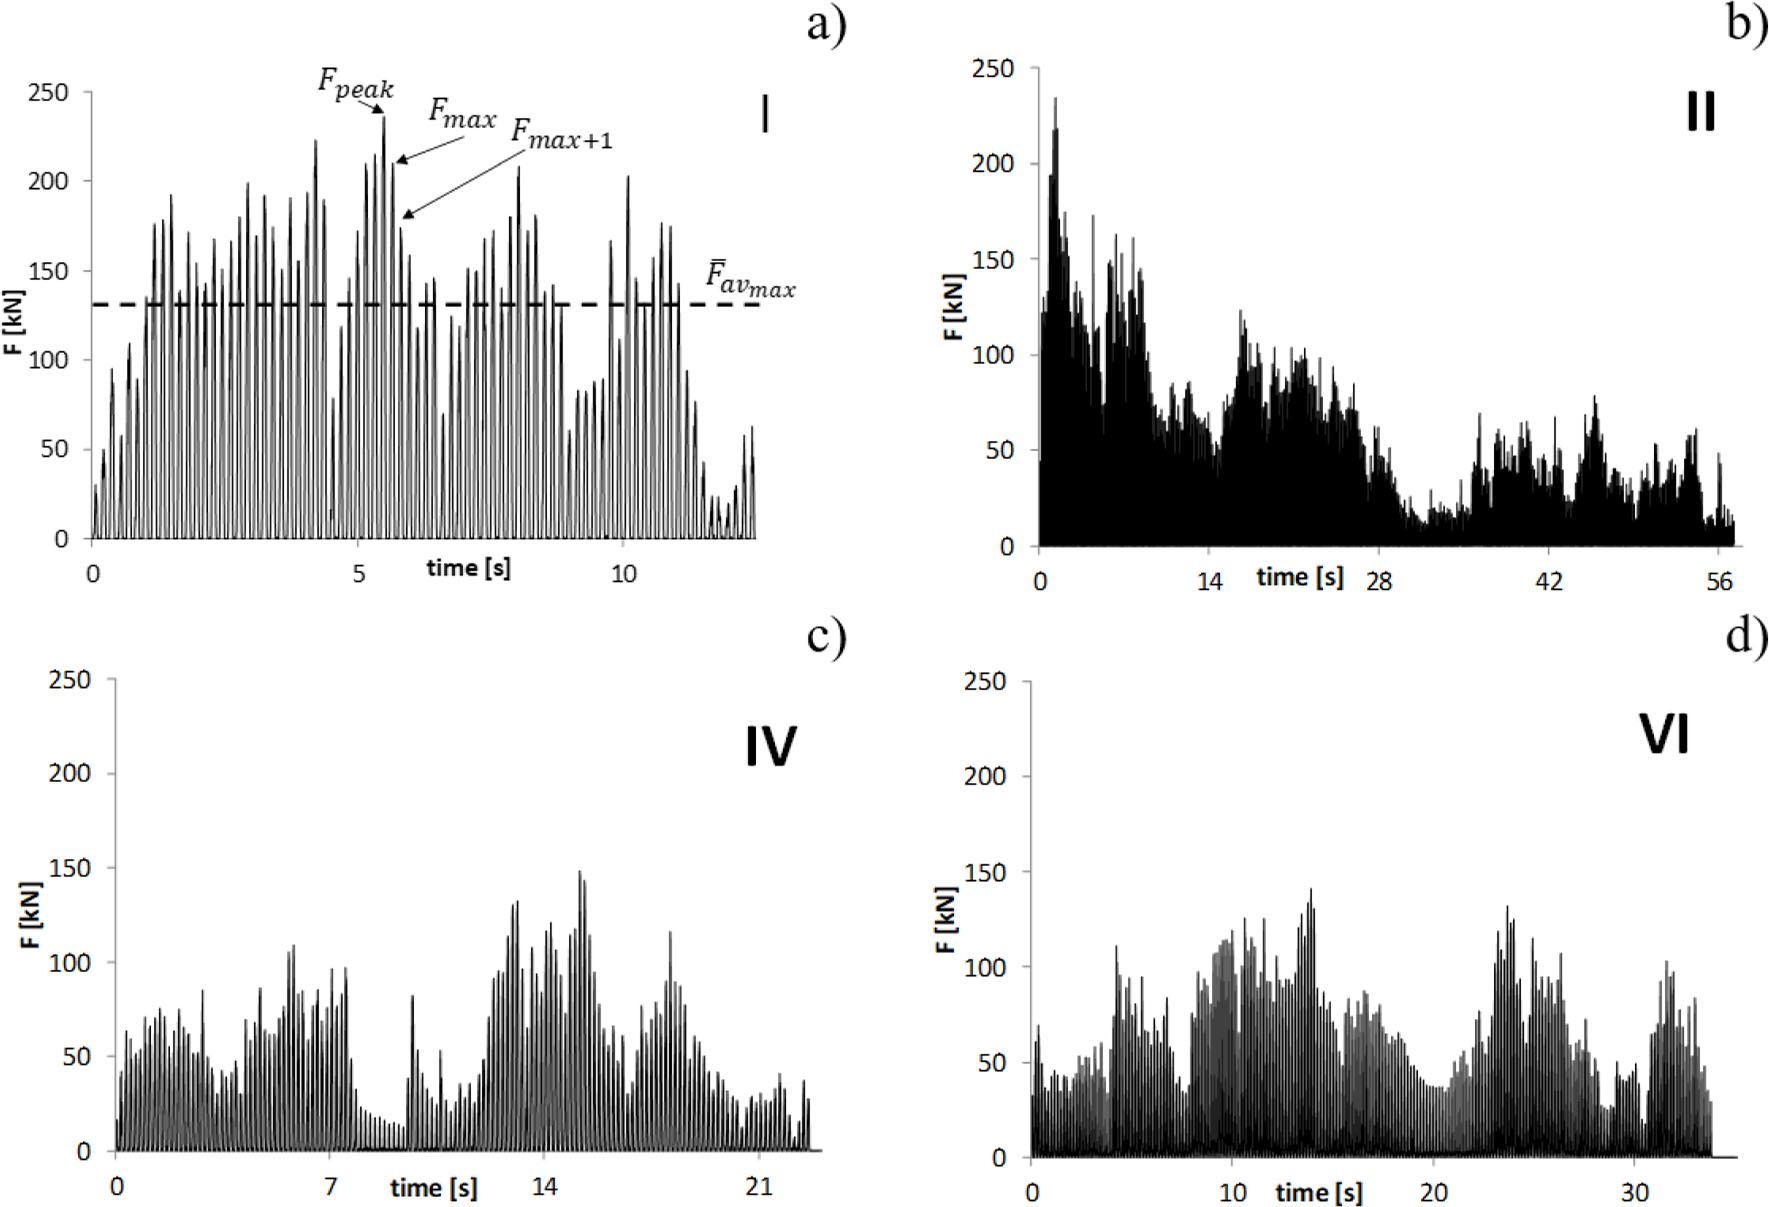
Figure 13
Diagrams of force F in toggle plate as a function of time for the entire attempt: a) flat plates-set I, b) triangular profile plates and coaxial arrangement of teeth – set II, c) variable pitch, height and coaxial arrangement of teeth – set IV, d) variable width, pitch and coaxial set of teeth – set VI
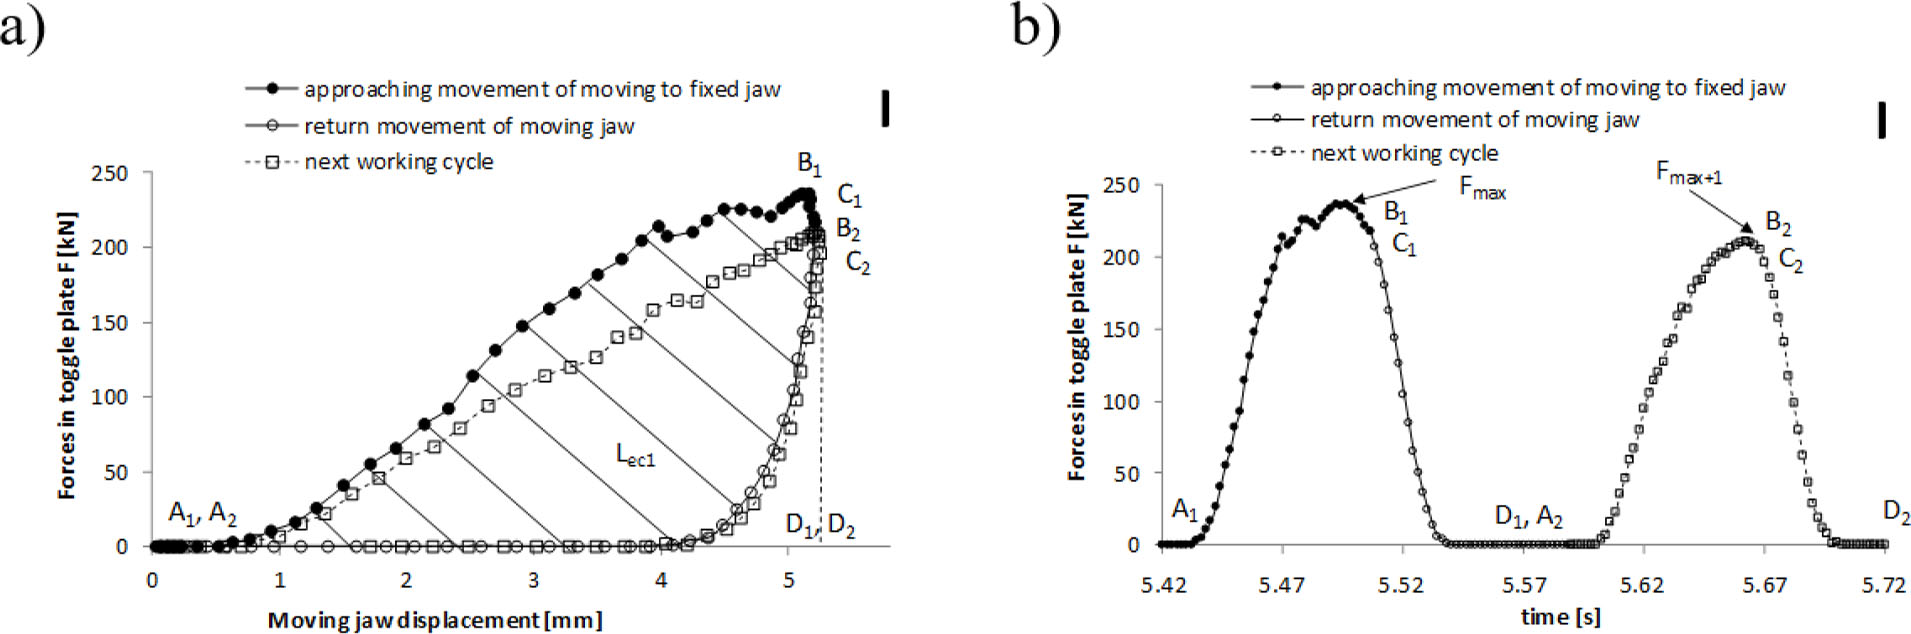
Figure 14
The two exemplary operation cycles of sandstone crushing by flat plates a) force vs. displacement diagram b) force vs. time diagram
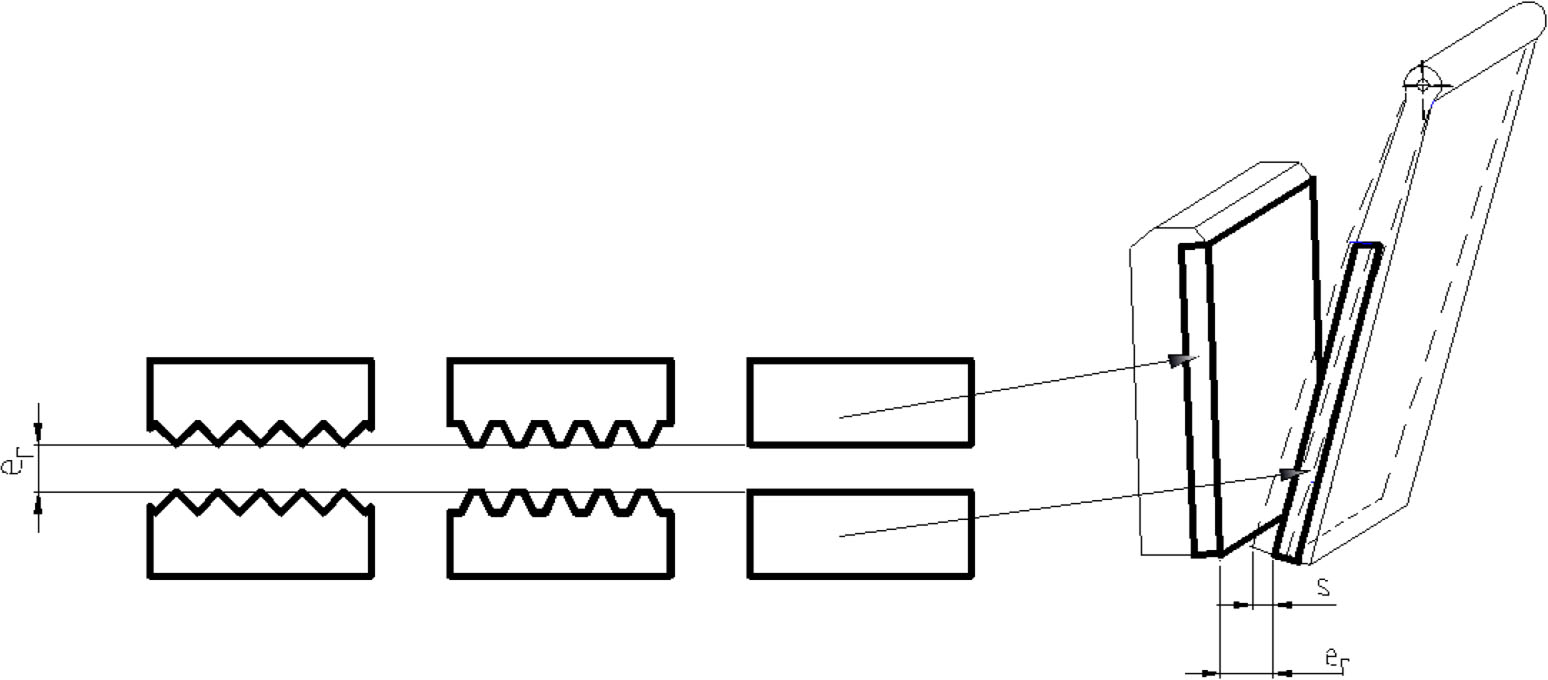
Figure 15
Scheme of measurement of the outlet slot er for different plate sets, s - moving jaw displacement (throw)
Table 1
Changes in crushing parameter values as a function of feed mass. Maximum crushing force, specific energy, technical performance and crushing time. Crushing of sandstone “Mucharz” between the flat plates
| Feed size | Mass | Specific energy | Maximum crushing force | Technical performance | Crushing time | Number of samples |
|---|---|---|---|---|---|---|
| D | m | Ls | Fpeak | Wt | tc | i |
| [mm] | [kg] | [kJ/kg] | [kN] | [t/h] | [s] | [-] |
| 90 | 2.01 | 2.71 | 202.14 | 1.71 | 4.23 | 12 |
| 90 | 3.44 | 2.83 | 221.81 | 1.79 | 6.93 | 11 |
| 90 | 3.92 | 2.9 | 231.93 | 1.84 | 7.69 | 11 |
| 90 | 4.78 | 3.02 | 261.98 | 1.93 | 8.9 | 12 |
| 90 | 6.2 | 3.1 | 269.94 | 2.07 | 10.8 | 11 |
| 90 | 7.37 | 3.07 | 262.80 | 2.13 | 12.44 | 12 |
| 90 | 10.2 | 3.12 | 265.43 | 2.14 | 17.13 | 11 |
| 90 | 20.5 | 3.11 | 267.32 | 2.12 | 34.81 | 11 |
Table 2
Product particle size distribution for 6 sets of crushing plates
| Set | I | II | III | IV | V | VI |
|---|---|---|---|---|---|---|
| Fraction d [mm] | Residue on sieves, share of grain fraction fn [%] | |||||
| 31.5 < d | 1.13 | 0.81 | 3.35 | 4.75 | 6.11 | 3.13 |
| 16 < d ≤ 31.5 | 39.92 | 49.15 | 49.35 | 56.82 | 51.58 | 56.69 |
| 8 < d ≤ 16 | 29.92 | 22.46 | 21.98 | 20.12 | 22.66 | 17.21 |
| 4 < d ≤ 8 | 11.64 | 10.94 | 10.85 | 7.58 | 7.77 | 9.75 |
| 2 < d ≤ 4 | 5.14 | 5.23 | 4.00 | 3.37 | 3.27 | 4.01 |
| 1 < d ≤ 2 | 3.68 | 3.44 | 2.97 | 2.16 | 2.25 | 2.65 |
| 0.5 < d ≤ 1 | 2.35 | 1.91 | 2.21 | 1.27 | 1.71 | 1.57 |
| 0.25 < d ≤ 0.5 | 1.99 | 1.62 | 1.51 | 1.04 | 1.34 | 1.40 |
| 0.125 < d ≤ 0.25 | 2.18 | 1.61 | 1.62 | 0.99 | 1.39 | 1.44 |
| 0.063 < d ≤ 0.125 | 2.05 | 1.67 | 0.54 | 1.06 | 1.38 | 1.43 |
| d ≤ 0.063 | 0.66 | 1.17 | 1.62 | 0.84 | 0.54 | 0.73 |
Table 3
Product grain size, degree of fineness
| Set | I | II | III | IV | V | VI |
|---|---|---|---|---|---|---|
| d80% | 12.19 | 12.88 | 13.83 | 13.85 | 13.87 | 13.62 |
| n80% | 7.38 | 6.99 | 6.51 | 6.50 | 6.49 | 6.61 |
Table 4
Crushing forces, crushing energy and technical performance
| Crushing plates type | Maximum crushing force | Average maximum crushing force | Average crushing force | Specific energy | Technical performance |
|---|---|---|---|---|---|
| Fpeak | Fav | Ls | Wt | ||
| [kN] | [kN] | [kN] | [kJ/kg] | [t/h] | |
| I | 262.80 | 138.76 | 45.72 | 3.07 | 2.13 |
| II | 234.39 | 64.84 | 16.69 | 3.71 | 0.38 |
| III | 229.89 | 62.74 | 17.01 | 3.59 | 0.40 |
| IV | 148.25 | 59.64 | 18.12 | 2.29 | 1.10 |
| V | 152.18 | 60.52 | 18.23 | 2.31 | 1.24 |
| VI | 127.03 | 60.24 | 18.70 | 2.14 | 0.82 |