
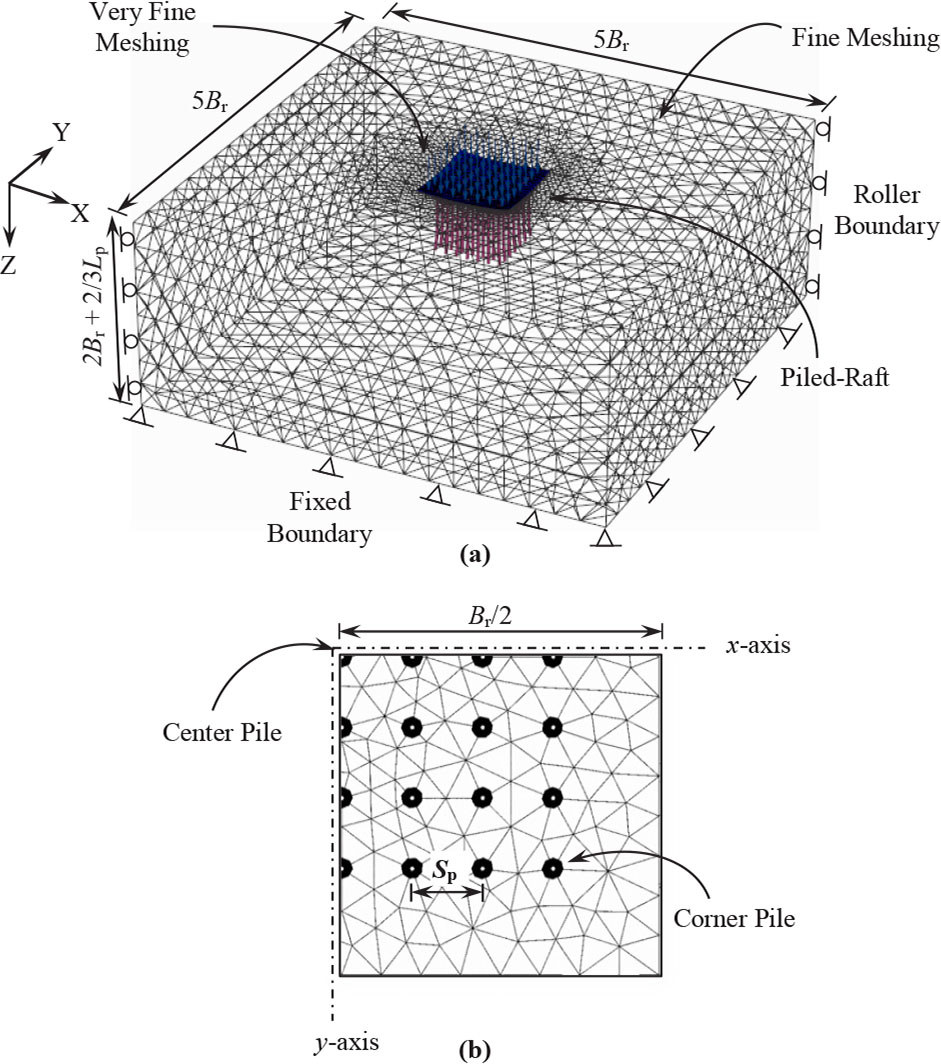
Figure 1
(a) Typical finite element mesh used in the parametric study. (b) Plan view (quarter of the piled raft)
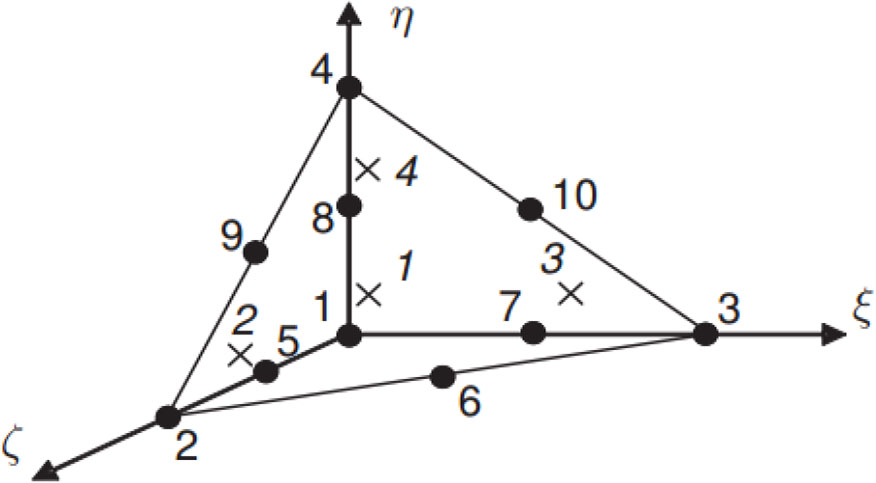
Figure 2
A 10-node tetrahedral element (Brinkgreve et al. 2015)
Table 1
Material properties used in the validation (Sinha and Hanna 2016)
| Material | Properties | Unit | Value |
|---|---|---|---|
| Soil | Young’s modulus, Es | MPa | 54 |
| Poisson’s ratio, νs | - | 0.15 | |
| Unit weight, γ | kPa | 19 | |
| Angle of internal friction, φ | ° | 20 | |
| Raft | Young’s modulus, Er | GPa | 34 |
| Pile | Young’s modulus, Ep | GPa | 25 |
| Poisson’s ratio, νp | - | 0.2 |
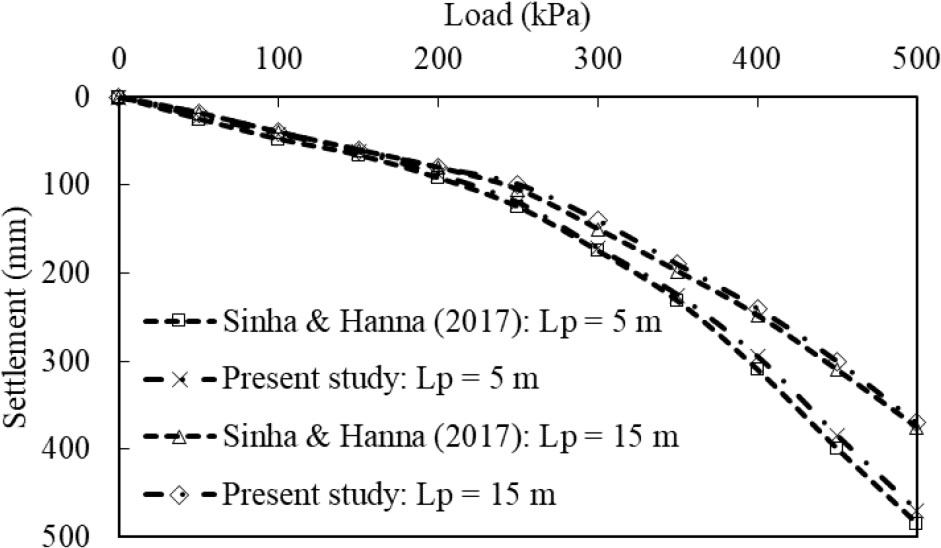
Figure 3
Comparison of load settlement behavior of the present study with the results of Sinha and Hanna (2016)
Table 2
Material properties used in the parametric analysis
| Material | Properties | Unit | Value |
|---|---|---|---|
| Soil | Unsaturated unit weight, γunsat | kN/m3 | 16 |
| Young’s modulus, Es | MPa | 25 (Soft clay) | |
| 82 (Stiff clay) | |||
| Poisson’s ratio, νs | - | 0.495 | |
| Angle of internal friction, φ | ° | 0 | |
| Undrained cohesion | kPa | 25 (Soft clay) | |
| 80 (Stiff clay) | |||
| Raft | Young’s modulus, Er | GPa | 25 |
| Poisson’s ratio, νr | - | 0.25 | |
| Pile | Young’s modulus, Ep | GPa | 25 |
| Poisson’s ratio, νp | - | 0.25 |
Table 3
Geometric configurations of pile-raft model for parametric analysis
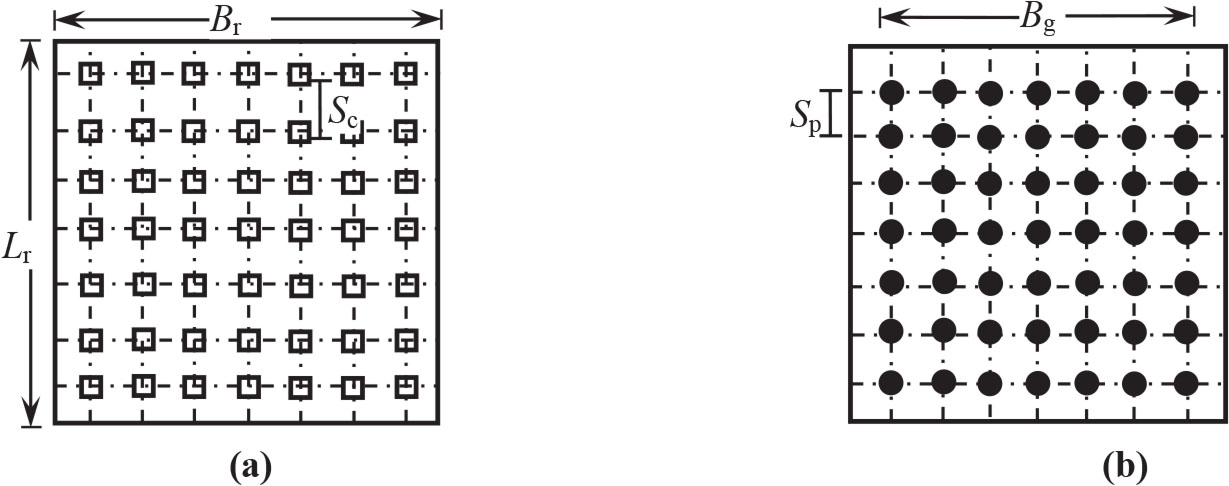
Figure 4
(a) Location of column and (b) top view of pile-raft configurations
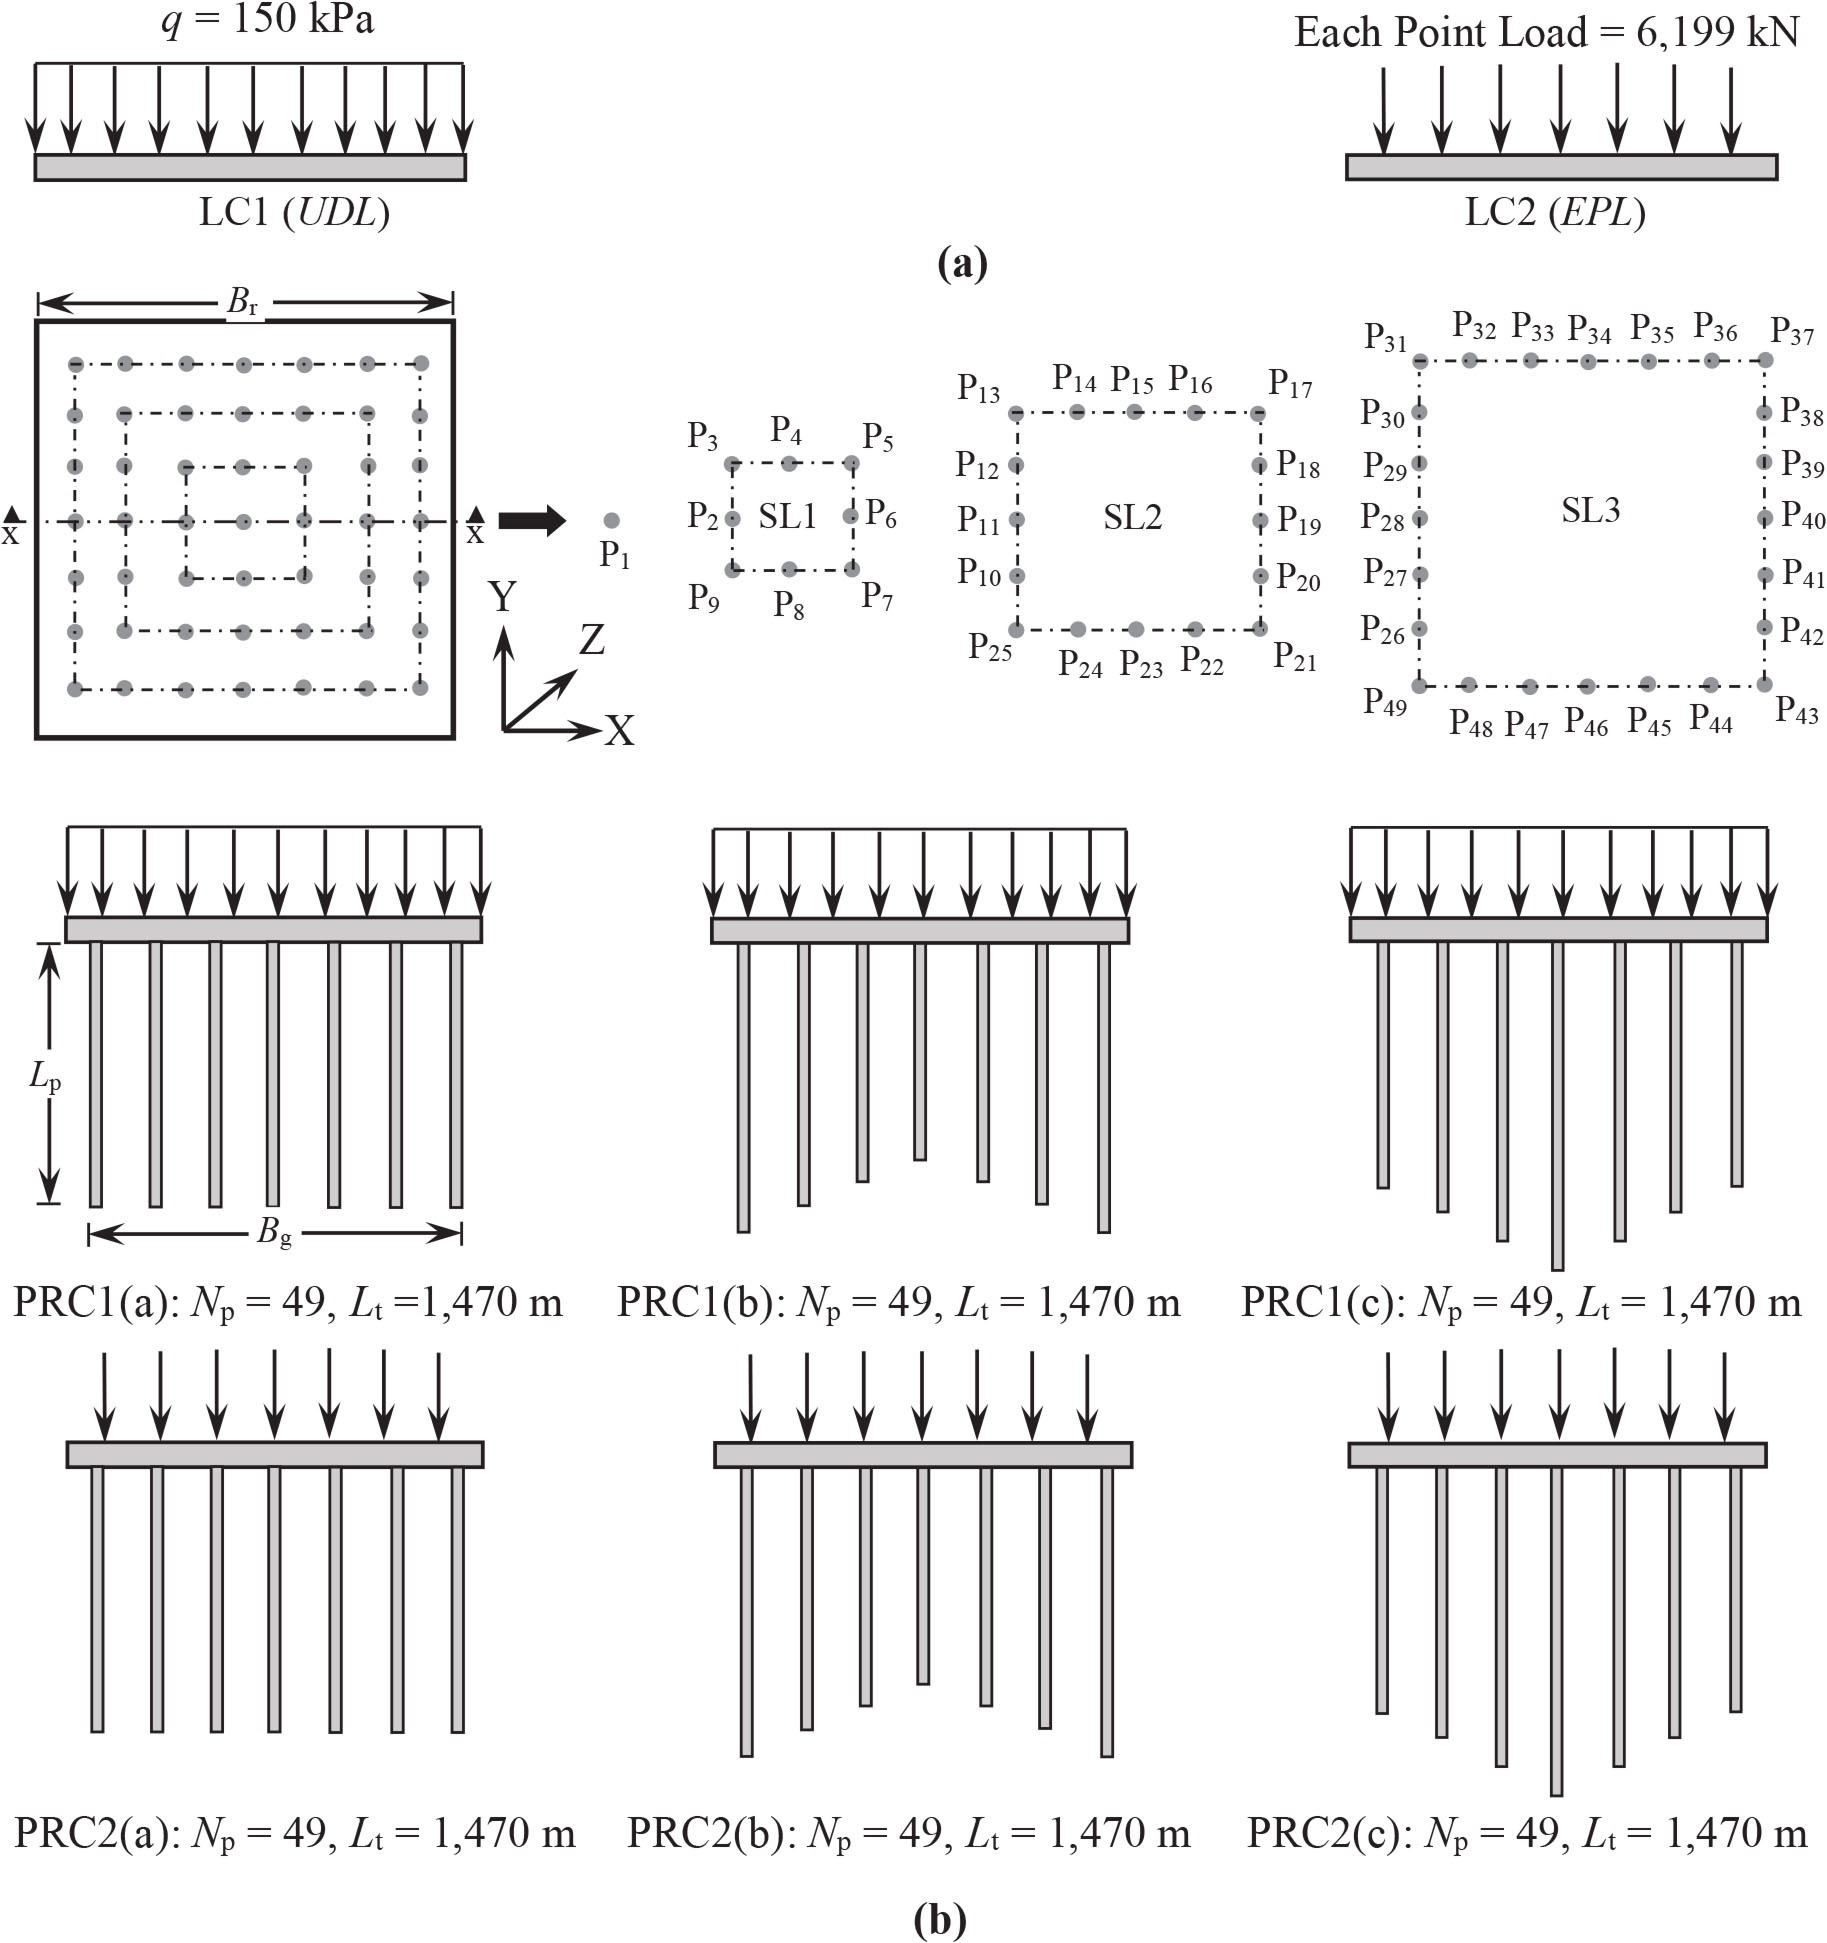
Figure 5
Different configurations used in the parametric study: (a) load configurations (LCs) and (b) pile-raft configurations (PRCs)
Table 4
Pile lengths used for different pile-raft configurations
| Name and no. of piles, Np | Pile length, Lp (m) | ||
|---|---|---|---|
| PRC with uniform pile lengths | PRC with “W”-shaped pile lengths | PRC with “V”-shaped pile lengths | |
| P1 (1 pile) | 30 | L1W = 24.46 | L1V = 37.19 |
| P2–P9 (8 piles) | L2–9W = 1.1 L1W = 26.91 | L2–9V = L1V/1.1 = 33.81 | |
| P10–P25 (16 piles) | L10–25W = 1.1 L2–9W = 29.60 | L10–25V = L2–9V/1.1 =30.74 | |
| P26–P49 (24 piles) | L26–49W = 1.1 L10–25W = 32.56 | L26–49V = L10–25V/1.1 =27.94 | |
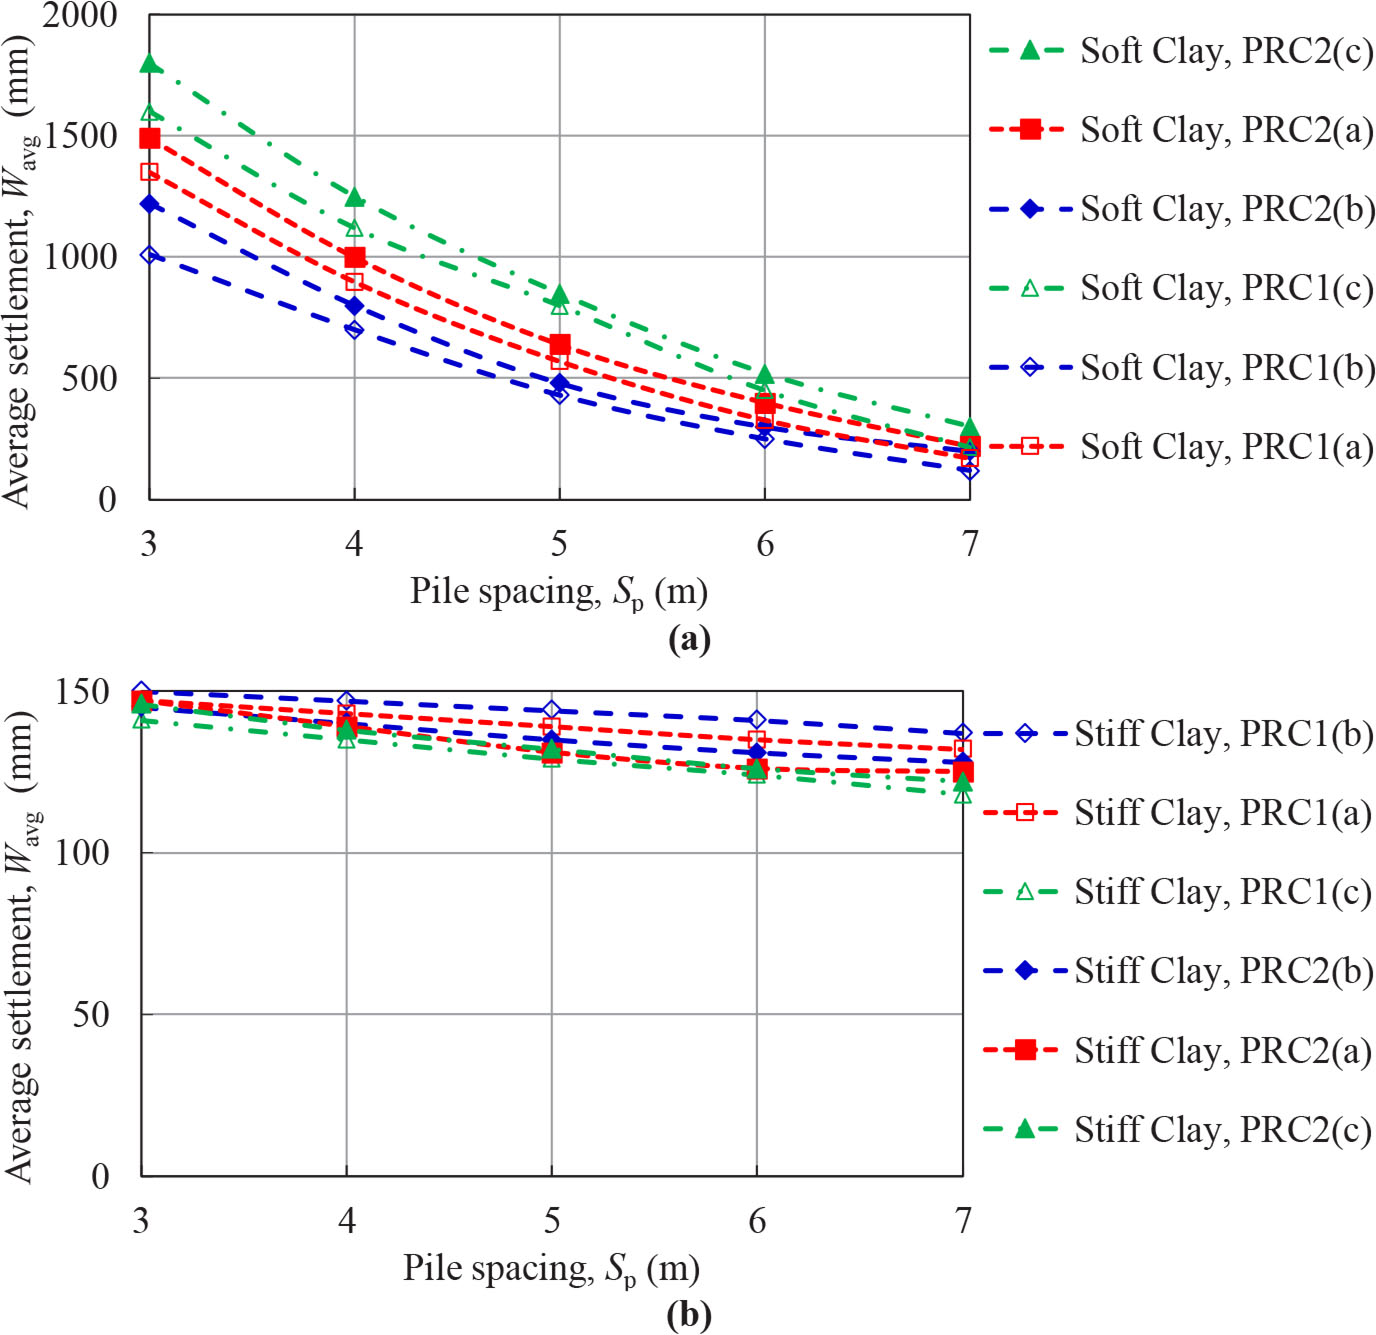
Figure 6
Effect of pile spacing on the average settlement for different pile-raft configurations: (a) soft clay and (b) stiff clay
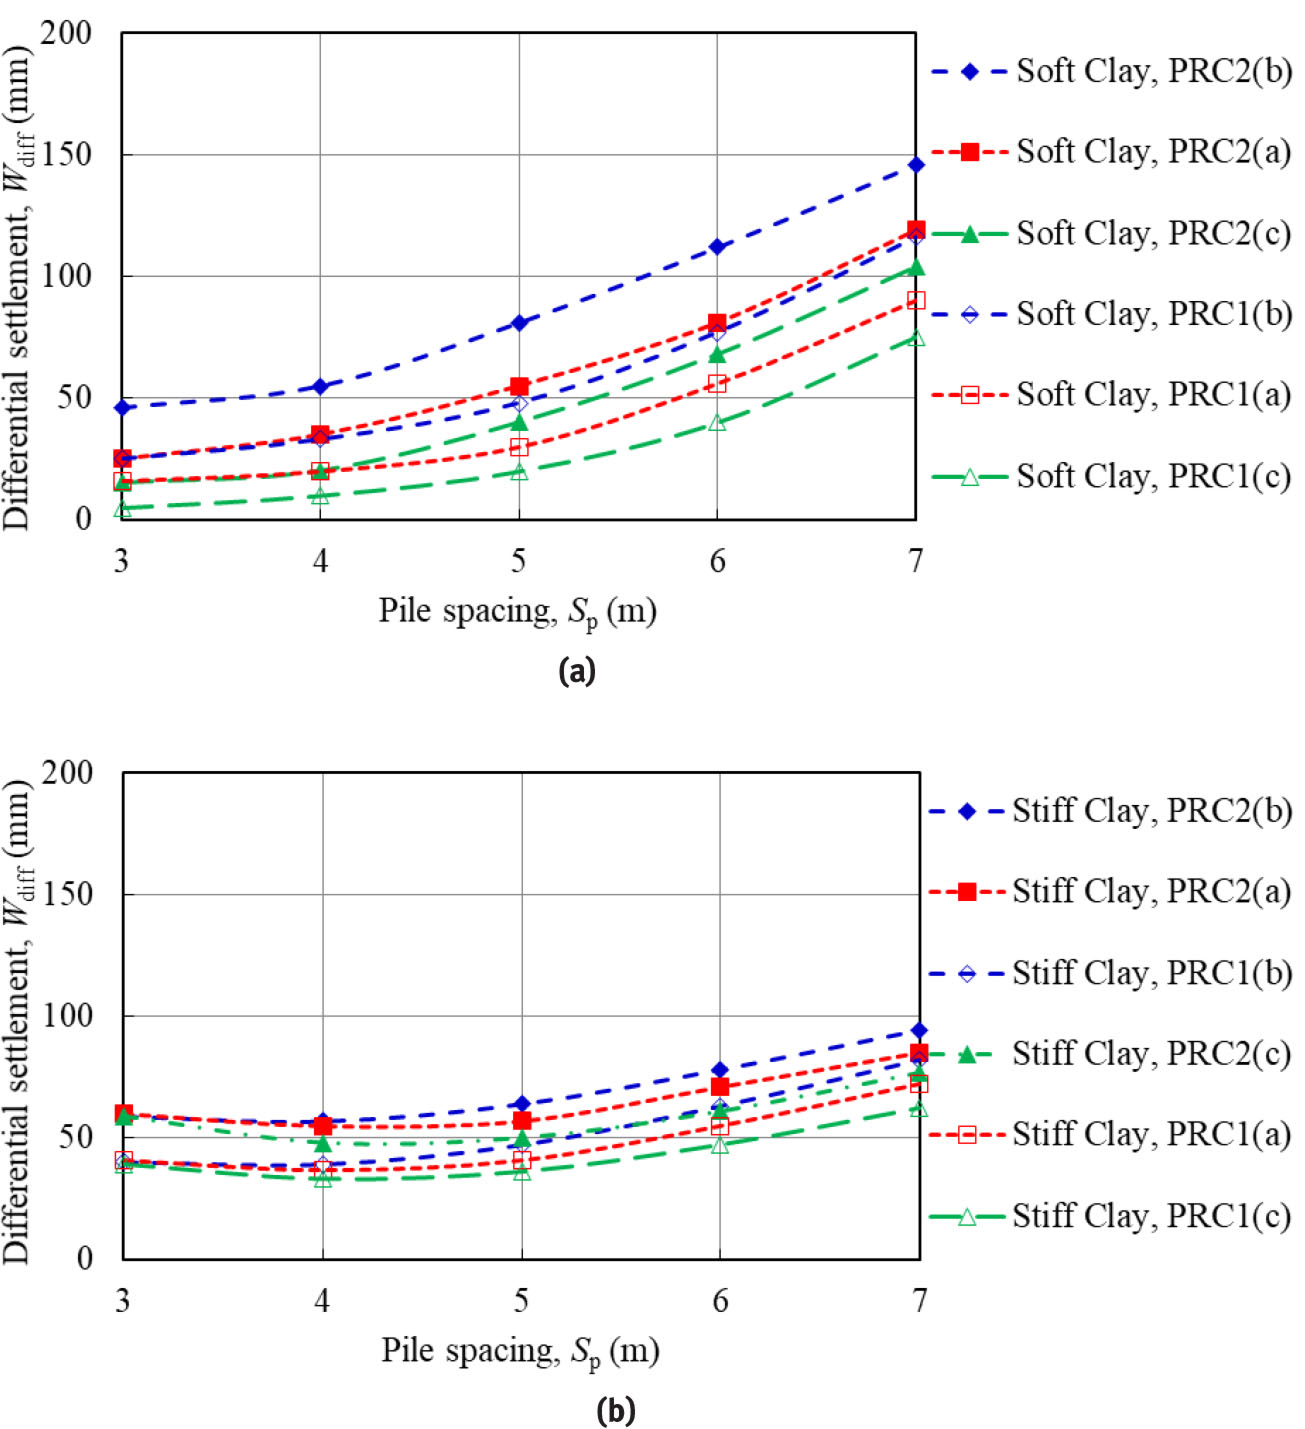
Figure 7
Effect of pile spacing on differential settlement for different pile-raft configurations: (a) soft clay and (b) stiff clay
Table 5
Center and corner settlement for different pile-raft configurations at different pile spacings
| Pile-raft configurations | Pile spacing, Sp (m) | Settlement in soft clay soil profile (mm) | Settlement in stiff clay soil profile (mm) | ||||
|---|---|---|---|---|---|---|---|
| Wcenter | Wcorner | Wdiff | Wcenter | Wcorner | Wdiff | ||
| PRC1(a) | 3 | 490 | 474 | 16 | 160 | 147 | 41 |
| PRC1(b) | 916 | 891 | 25 | 157 | 117 | 40 | |
| PRC1(c) | 1135 | 1125 | 10 | 158 | 119 | 39 | |
| PRC1(a) | 7 | 211 | 121 | 90 | 144 | 72 | 72 |
| PRC1(b) | 232 | 116 | 116 | 150 | 68 | 82 | |
| PRC1(c) | 243 | 162 | 81 | 139 | 77 | 62 | |
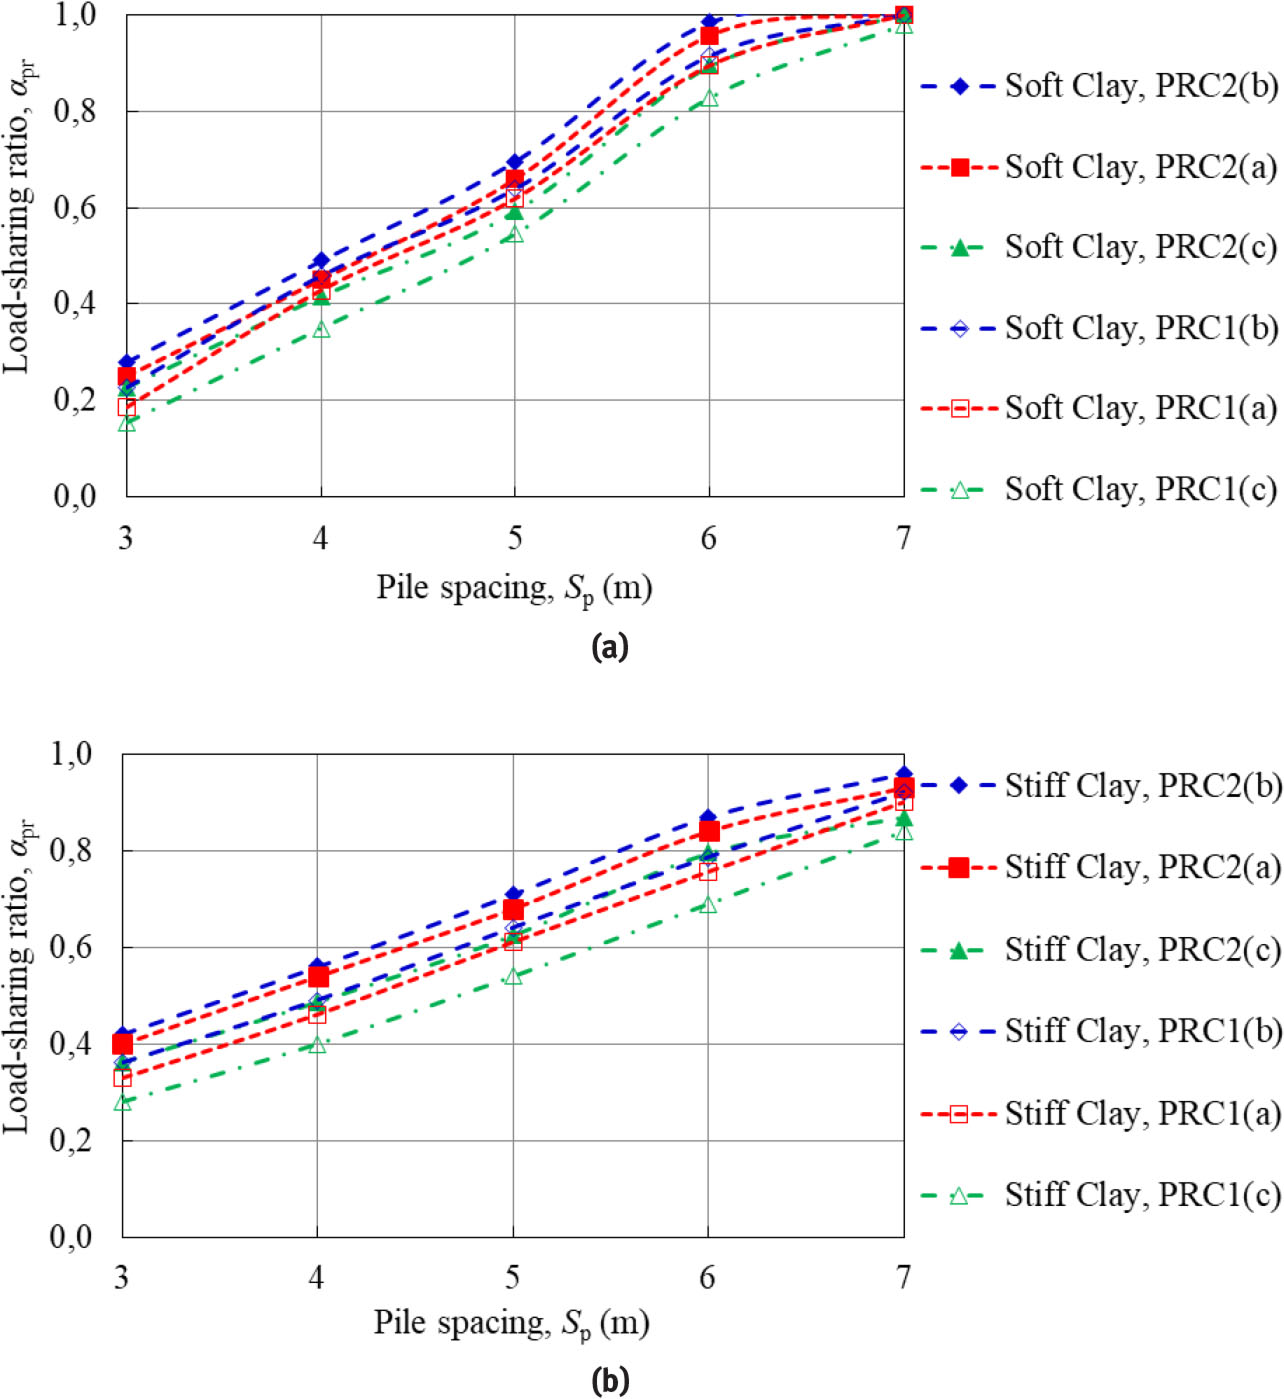
Figure 8
Effect of pile spacing on load-sharing coefficient for different pile-raft configurations (a) soft clay and (b) stiff clay
Table 6
Load carried by piles in different pile-raft configurations at different pile spacings
| Pile-raft configurations | Pile spacing, Sp (m) | Soft clay: load-carried by piles, Rpile (kN) | Stiff clay: load-carried by piles, Rpile (kN) | ||||
|---|---|---|---|---|---|---|---|
| Rcenter | Redge | Rcorner | Rcenter | Redge | Rcorner | ||
| PRC1(a) | 3 | 226 | 2076 | 4434 | 565 | 3010 | 5854 |
| PRC1(b) | 431 | 3125 | 5597 | 650 | 3640 | 6723 | |
| PRC1(c) | 494 | 1272 | 2765 | 1593 | 1474 | 3360 | |
| PRC1(a) | 7 | 6721 | 7036 | 8579 | 6221 | 6388 | 5031 |
| PRC1(b) | 4890 | 7836 | 9105 | 4728 | 6879 | 5102 | |
| PRC1(c) | 7376 | 6309 | 8240 | 7222 | 5751 | 4799 | |
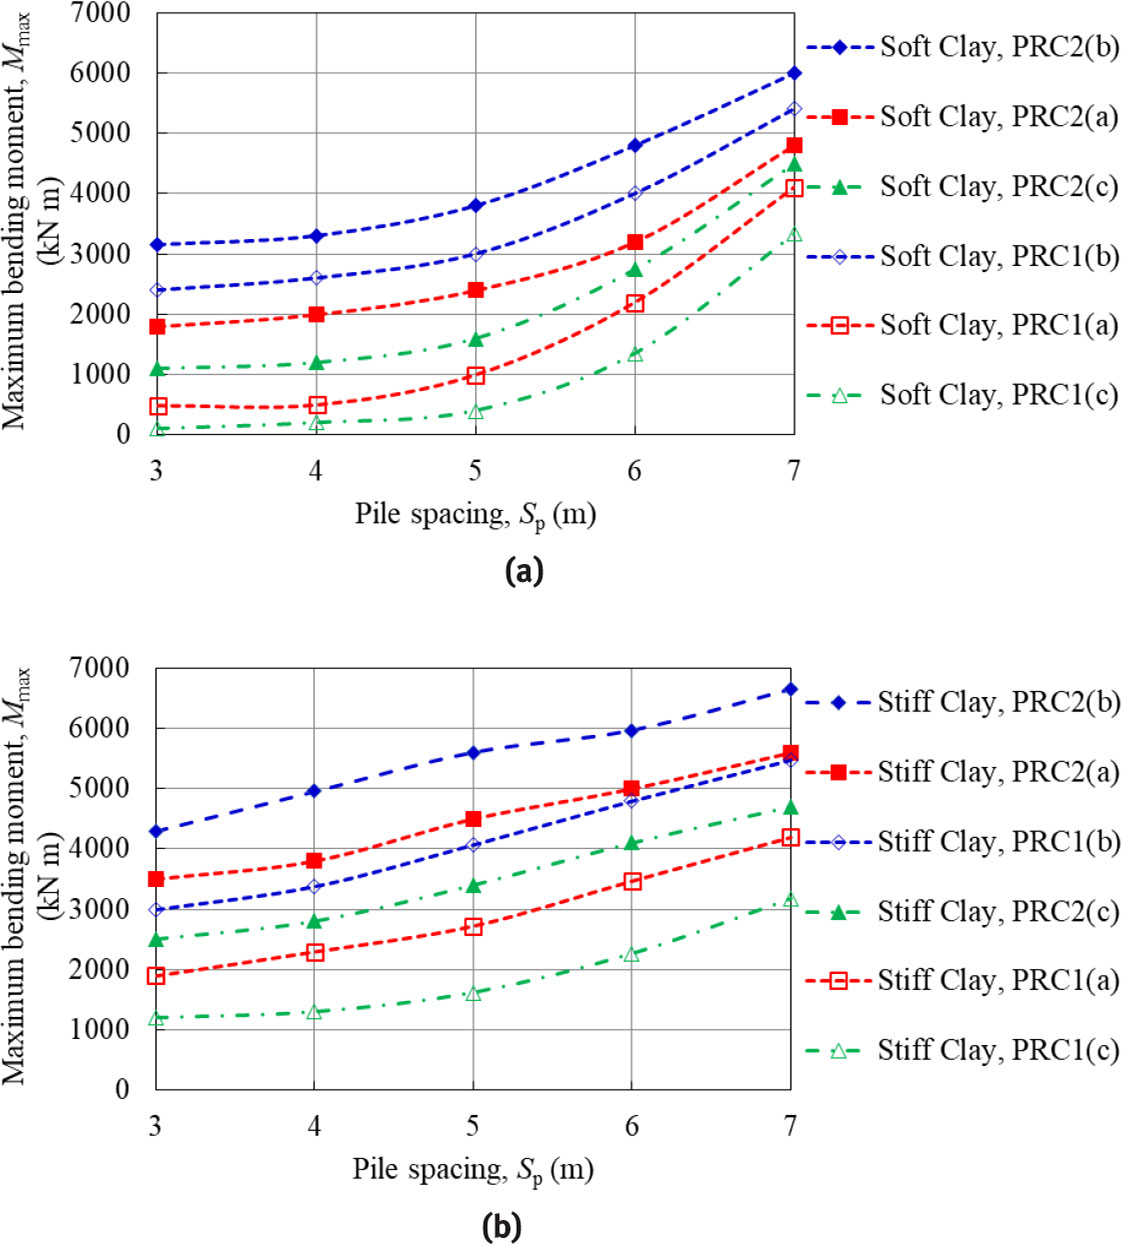
Figure 9
Effect of pile spacing on maximum bending moment for different pile-raft configurations (a) soft clay and (b) stiff clay
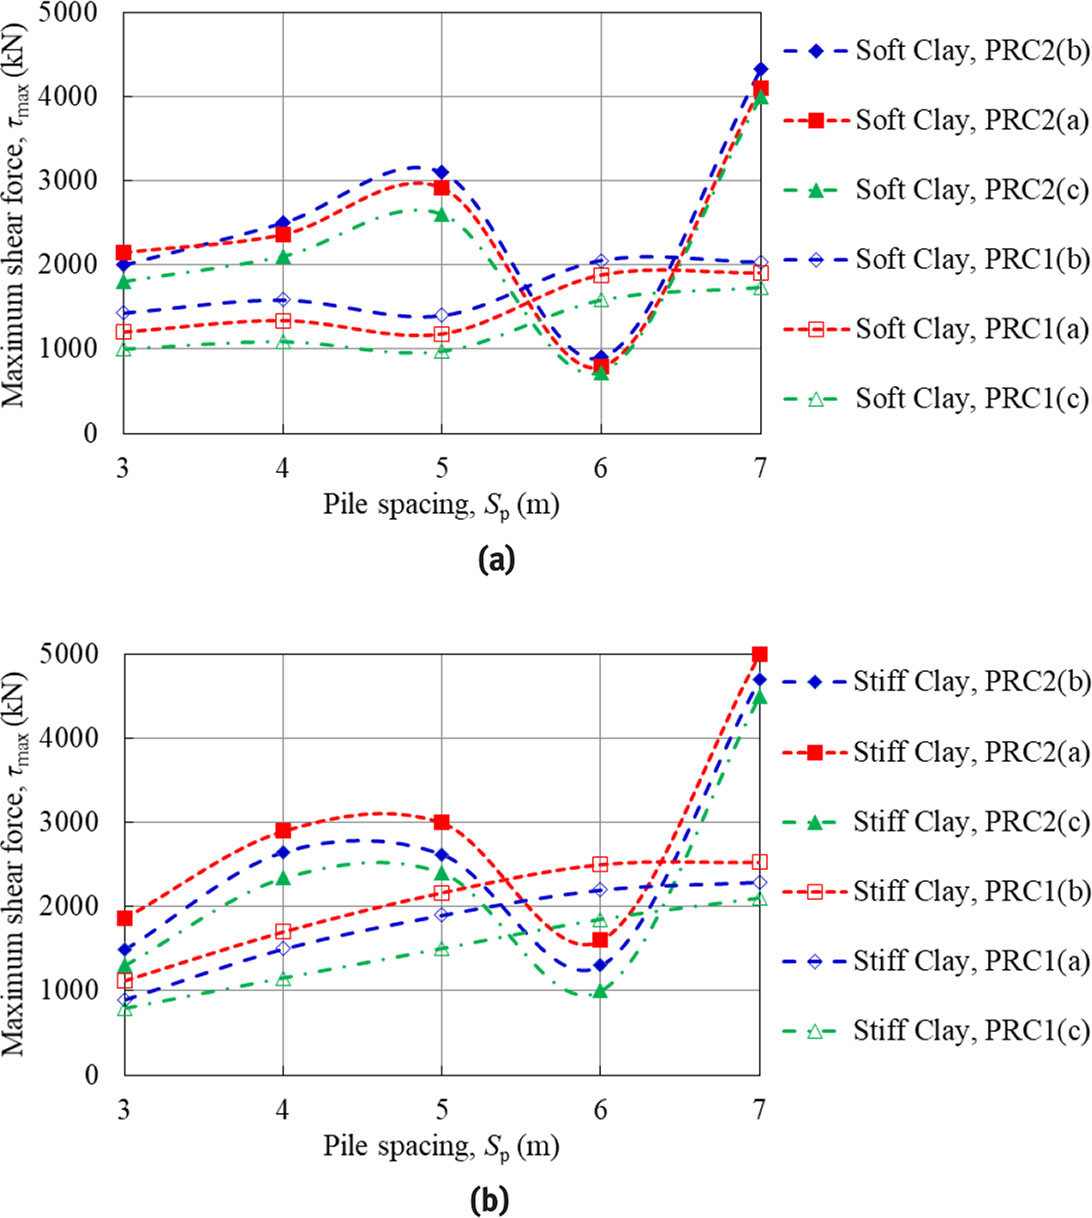
Figure 10
Effect of pile spacing on maximum shear force for different pile-raft configurations (a) soft clay and (b) stiff clay
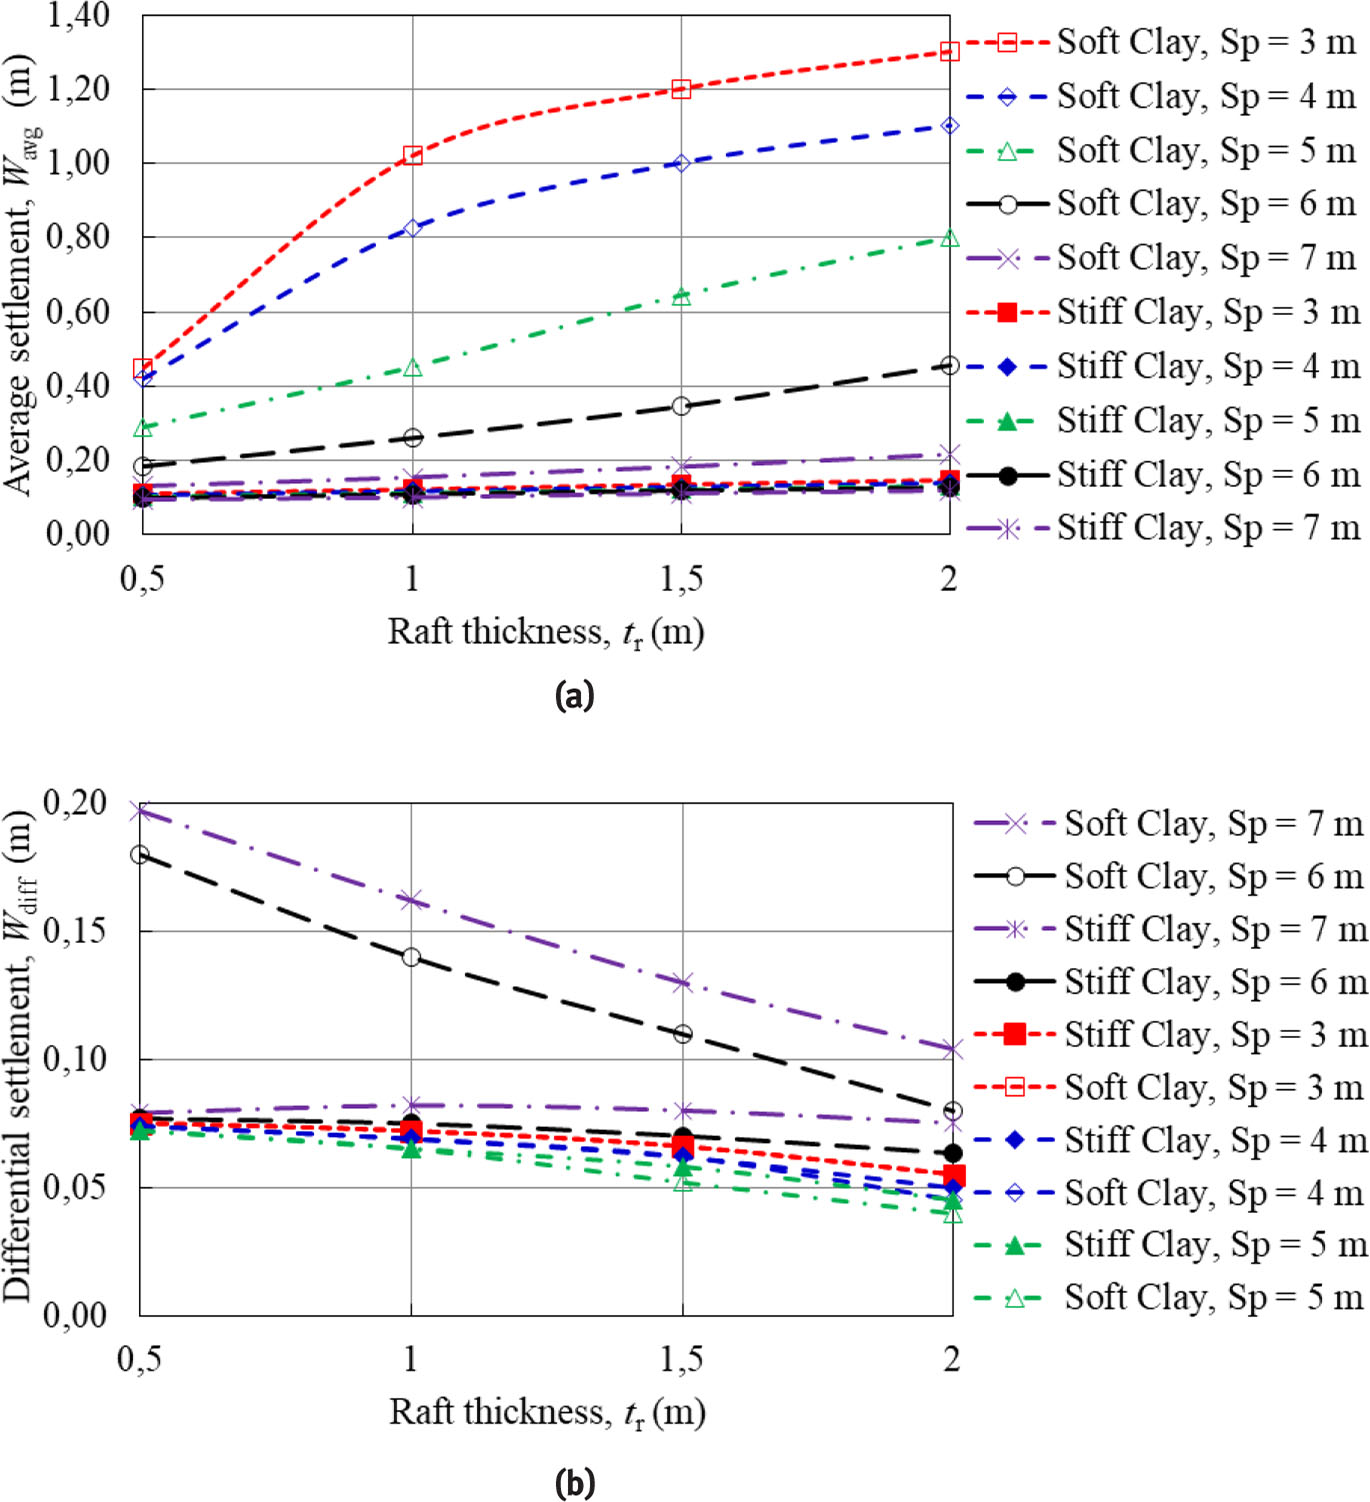
Figure 11
Combined effect of raft thickness and pile spacing on (a) average settlement and (b) differential settlement for PRC2 (c)
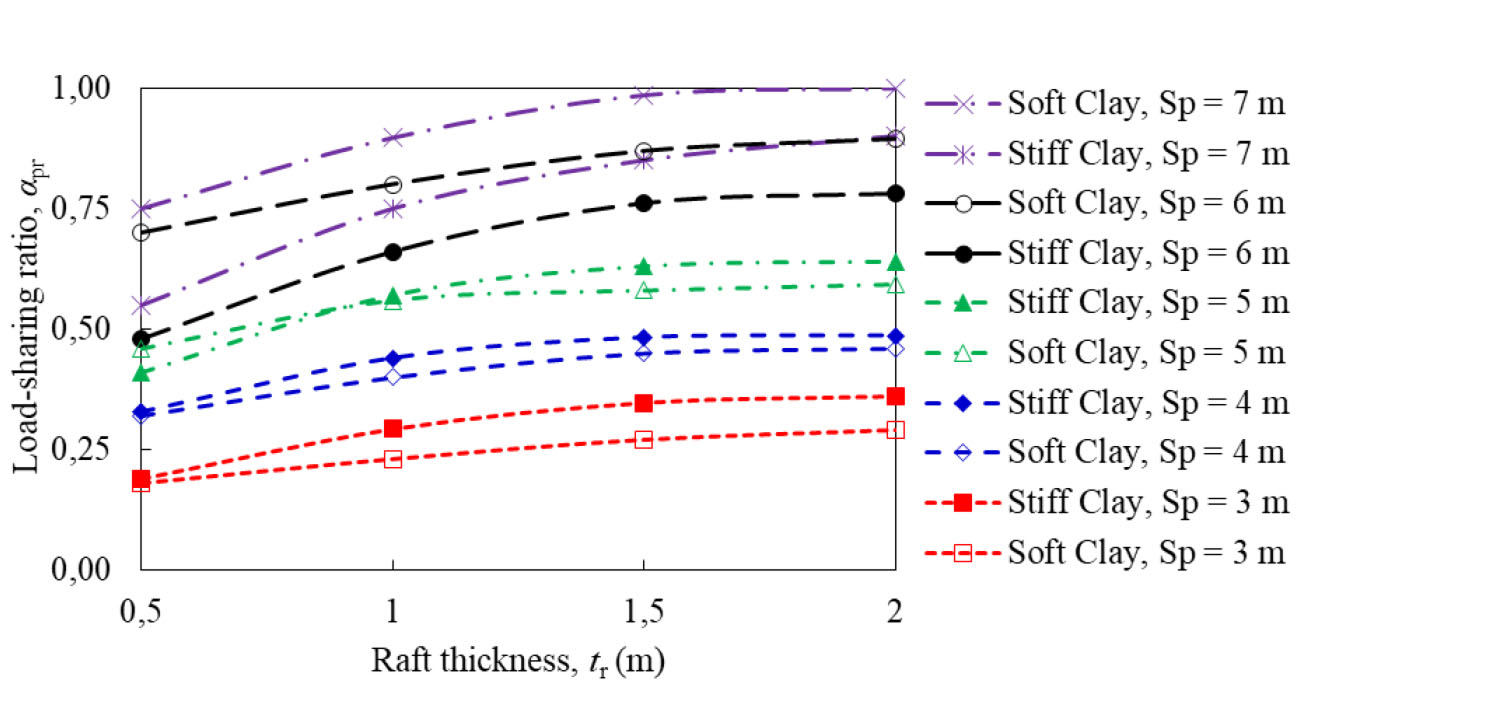
Figure 12
Combined effect of raft thickness and pile spacing on load-sharing coefficient for PRC2(c)
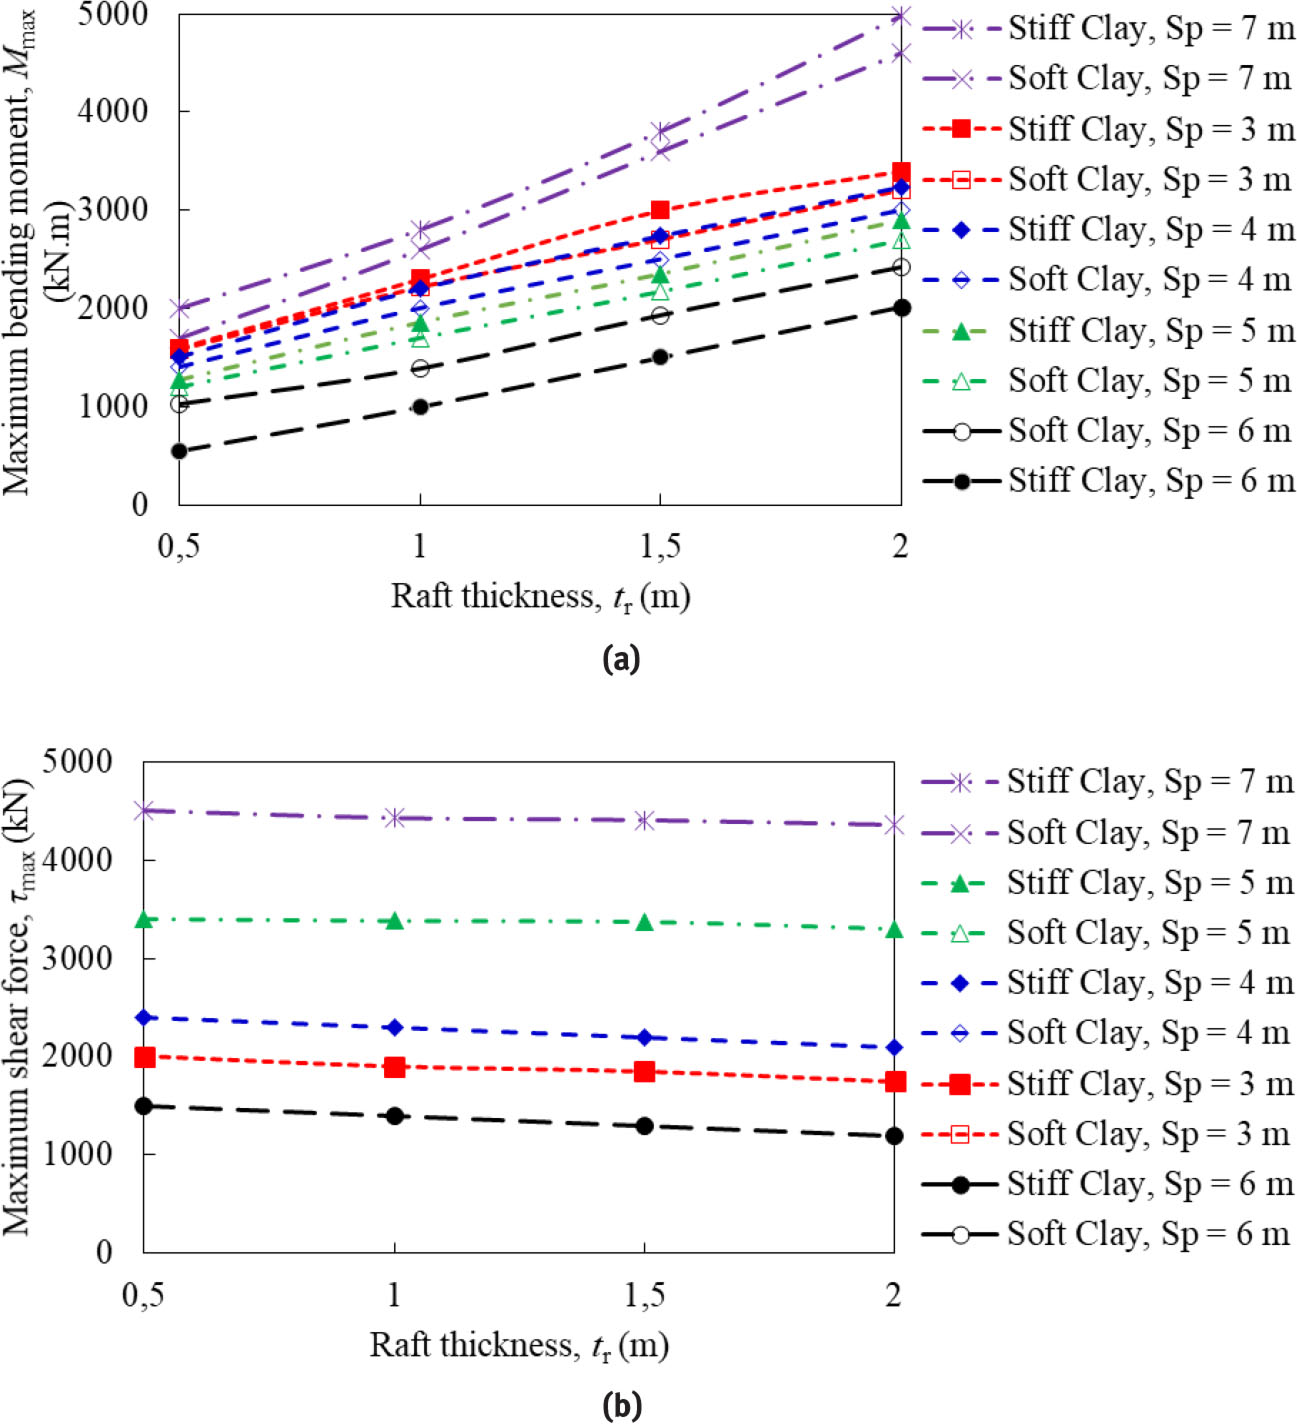
Figure 13
Combined effect of raft thickness and pile spacing on (a) maximum bending moment and (b) maximum shear force for PRC2(c)
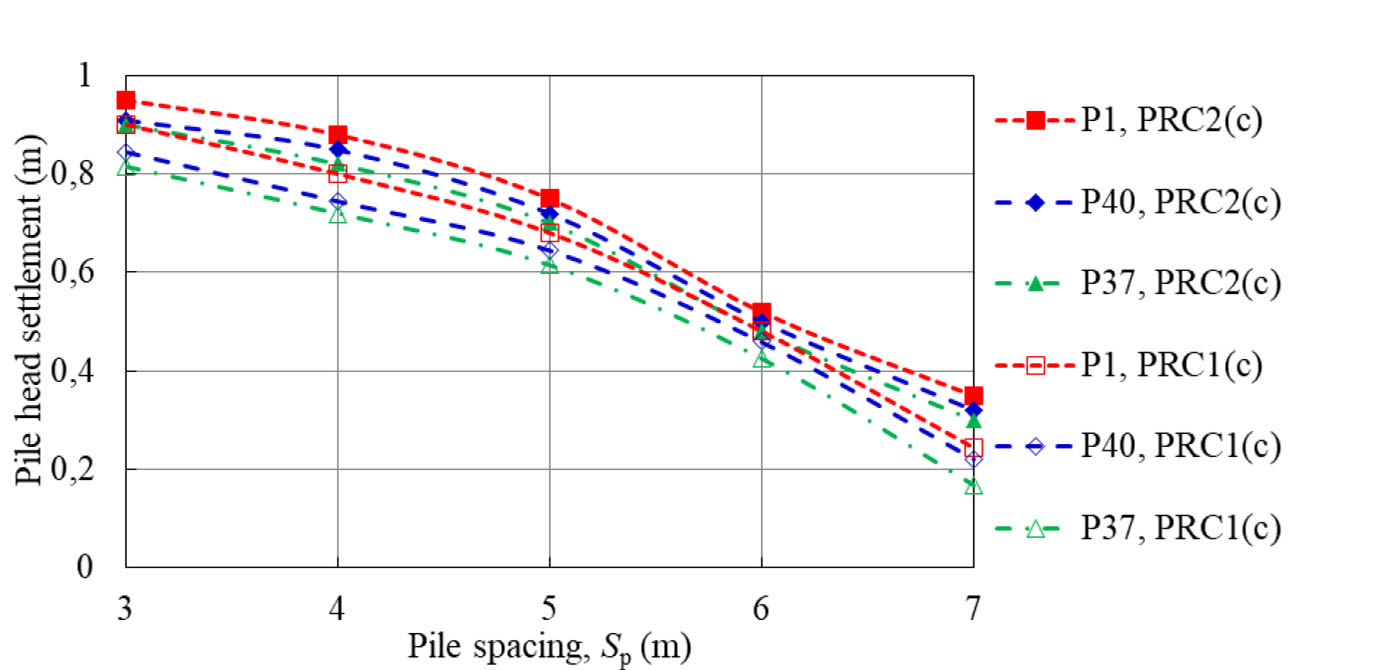
Figure 14
Effect of pile spacing on pile head settlement
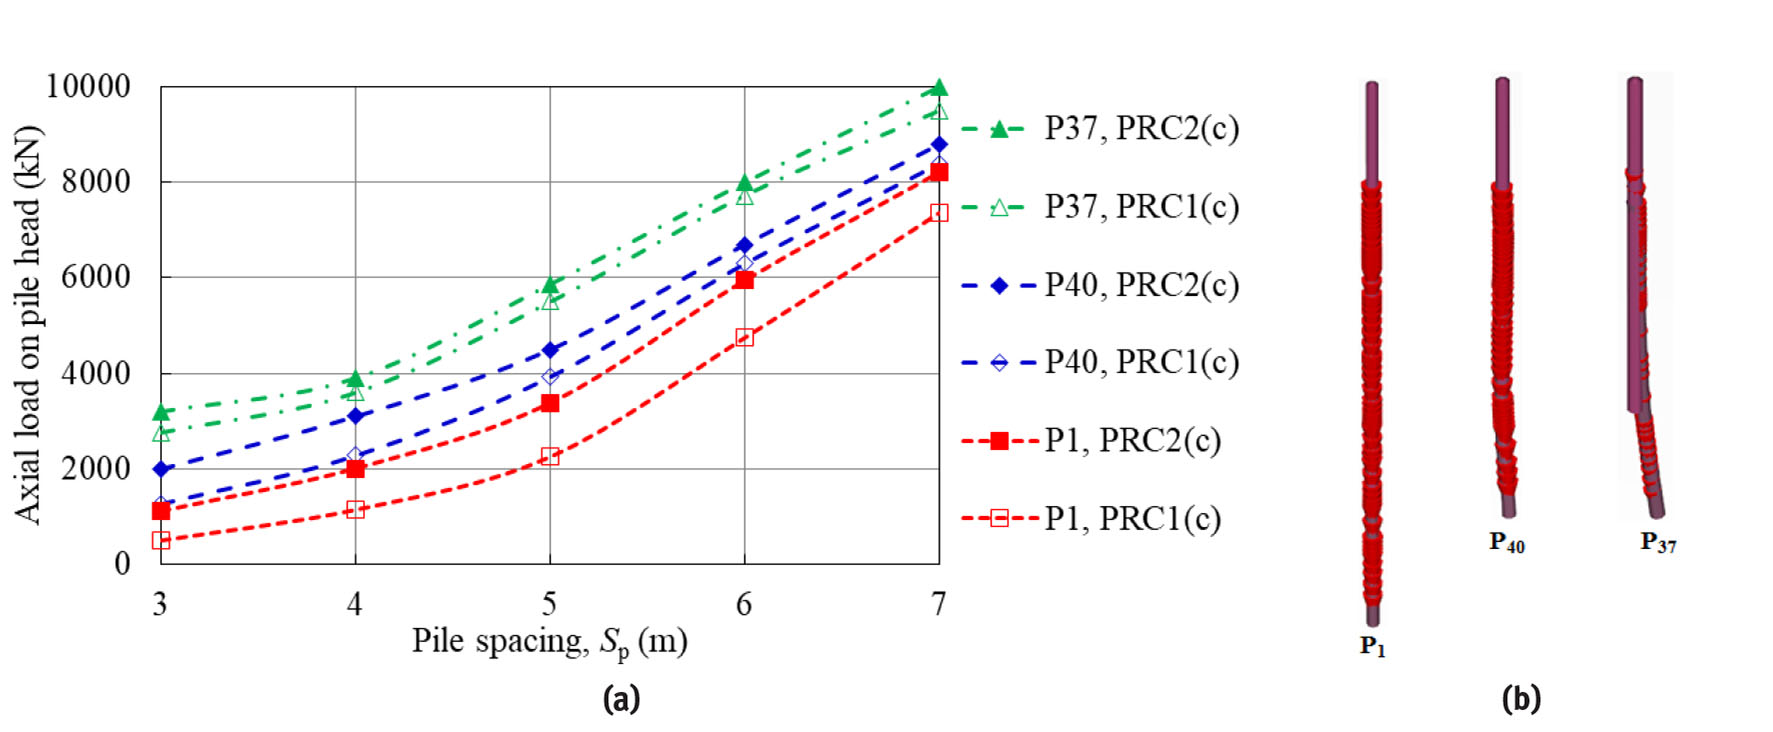
Figure 15
(a) Effect of pile spacing on pile axial load and (b) bending in different piles
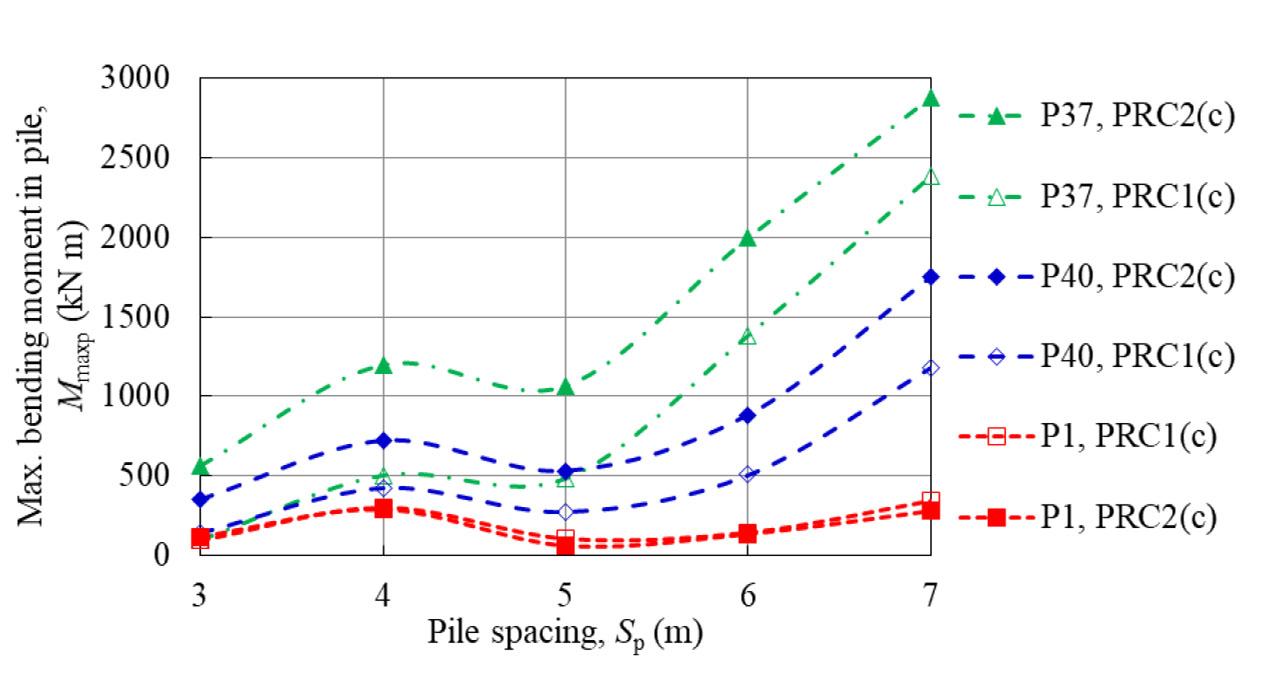
Figure 16
Effect of pile spacing on maximum bending moment in piles