

Figure 1
Pre-set undercut Hilti HDA-P anchor.
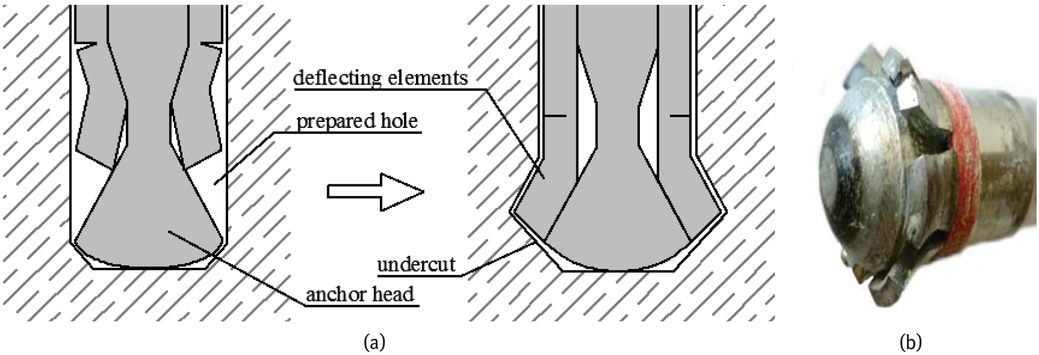
Figure 2
a) scheme of mounting the anchor, b) used anchor.
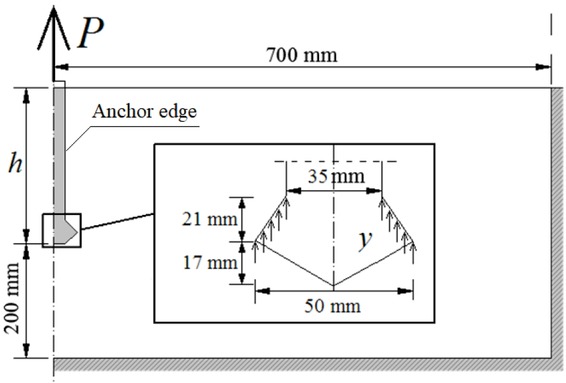
Figure 3
Scheme of the task.
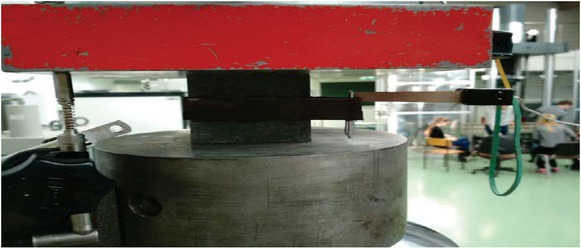
Figure 4
Compression with extensometer test.
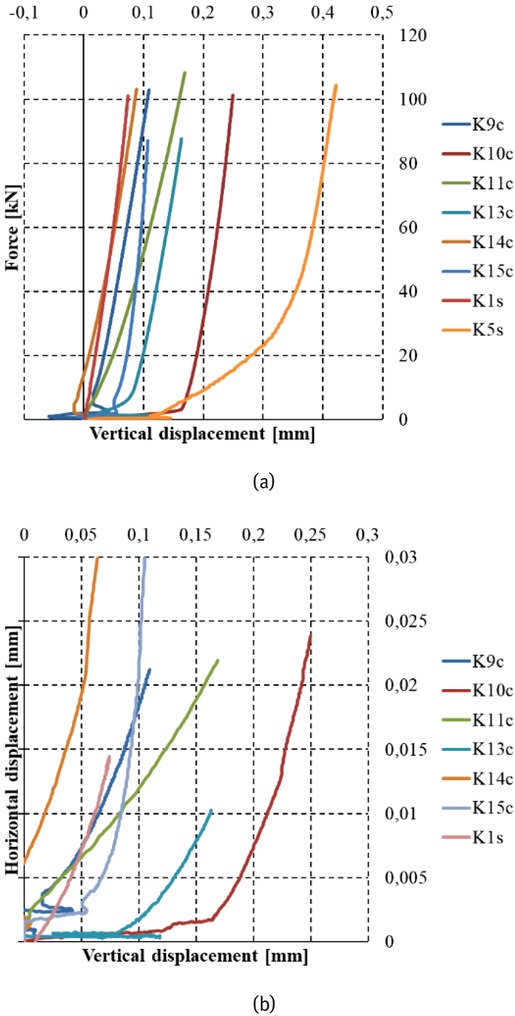
Figure 5
Results of the compressive tests: a) relation between the force and vertical displacement, b) relation between horizontal and vertical displacement.
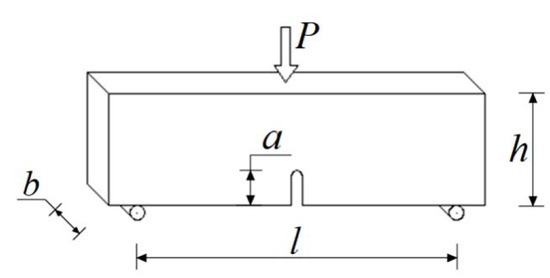
Figure 6
Scheme of the three point bending test with the notch.
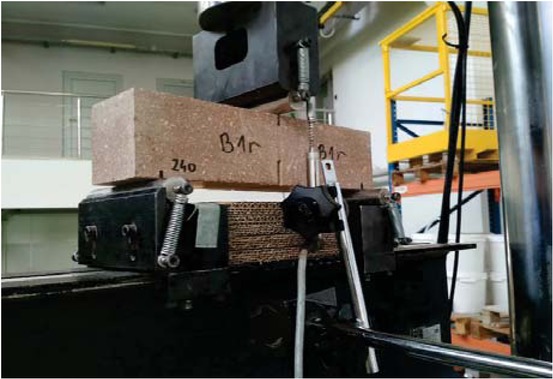
Figure 7
Three point bending test for notched beams.
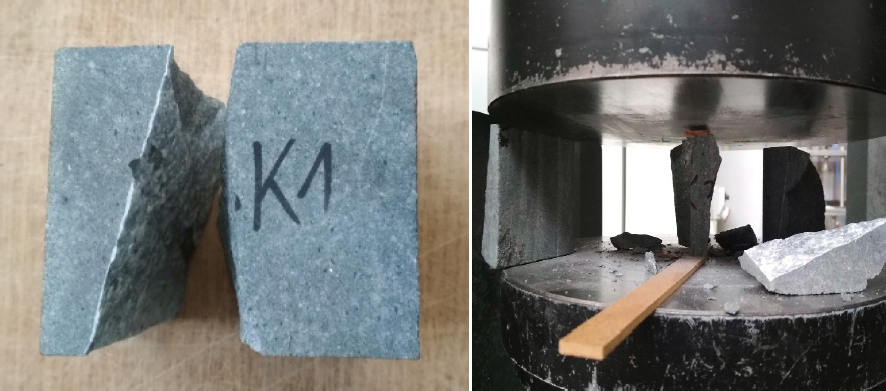
Figure 8
The quasi-Brazilian test.
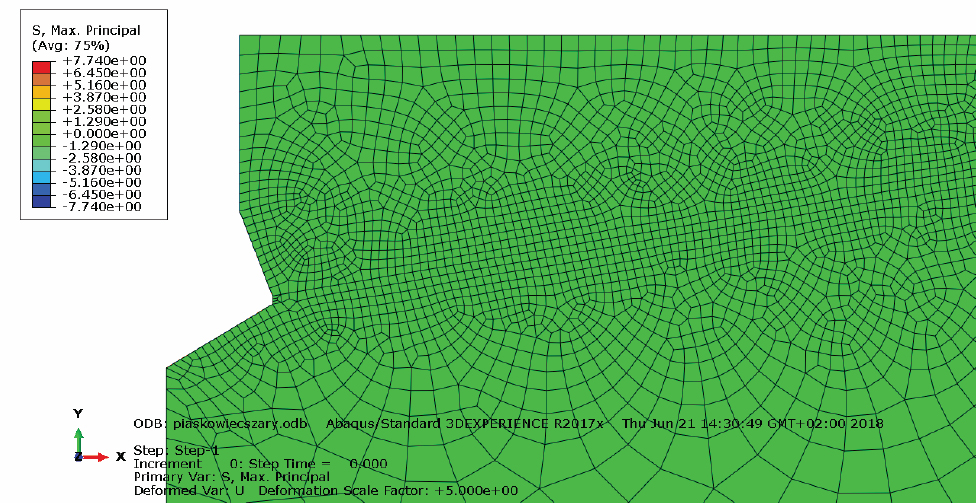
Figure 9
Model of the test before the load application.
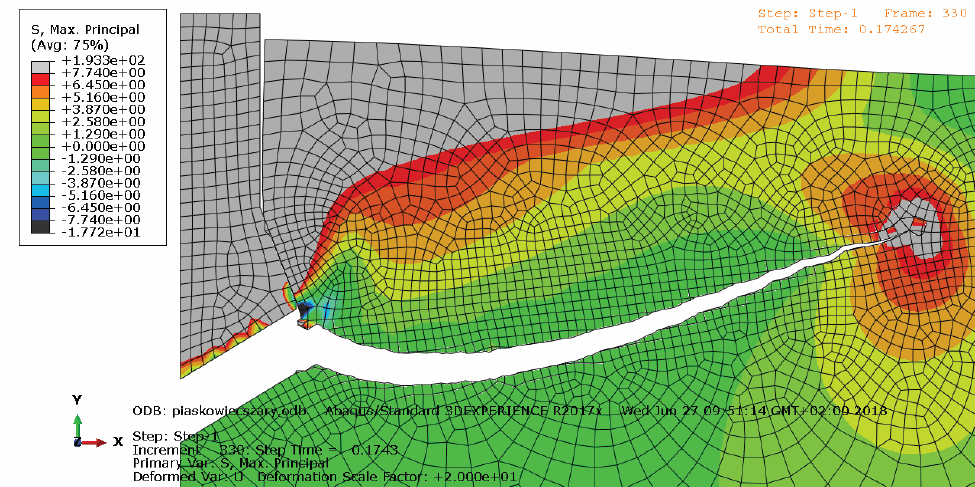
Figure 10
Last step of calculation from simulation with anchor and friction coefficient μ = 0.2.
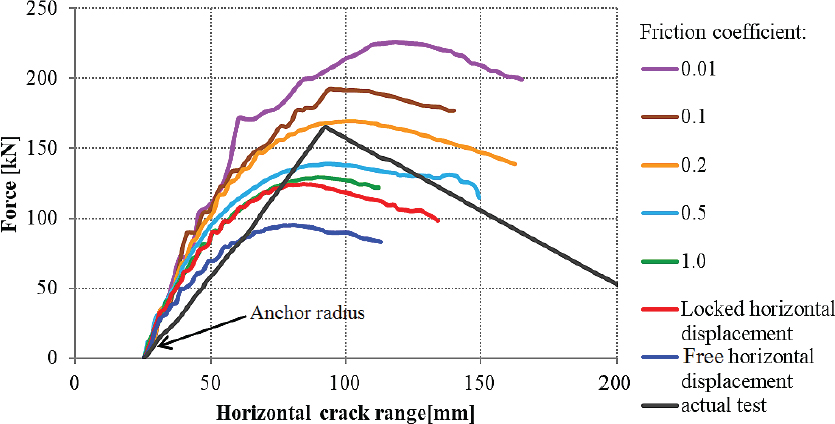
Figure 11
Graph of force dependence on the horizontal range of the crack.
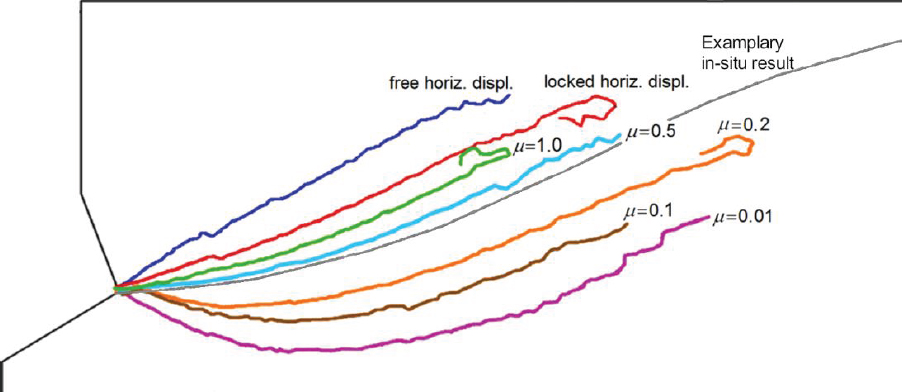
Figure 12
Crack paths for different methods of applying the load.
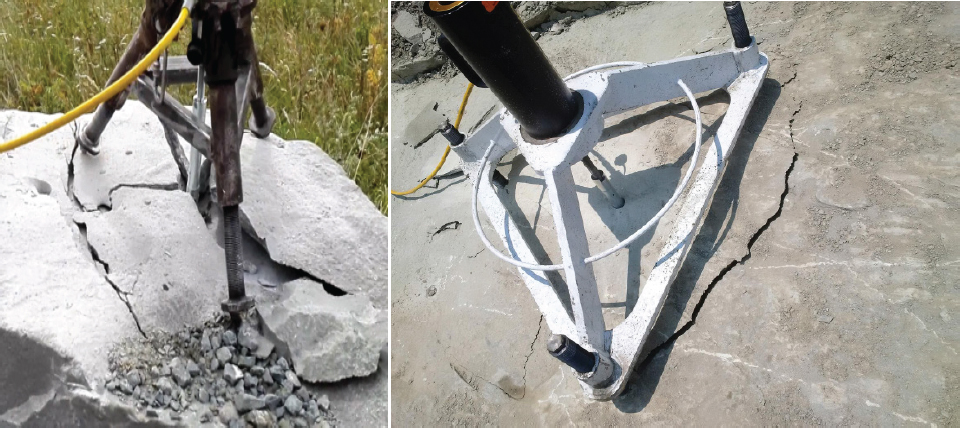
Figure 13
Pull-out test performed on actual rock (Jonak et al., 2019).
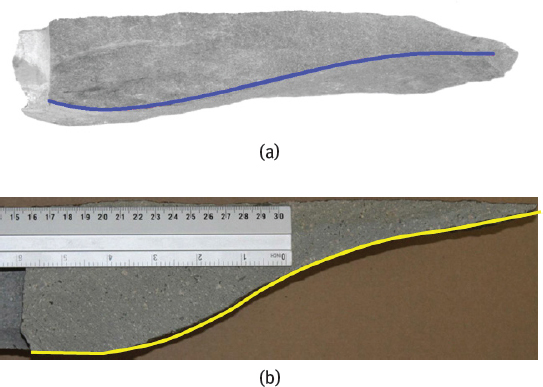
Figure 14
A cross-section of the actual pull-out sample: a) Sandstone, b) Porphyry
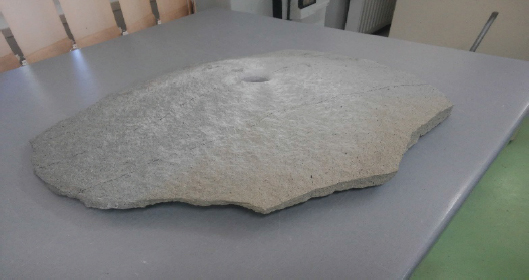
Figure 15
The shape of the actual pull-out sandstone sample.
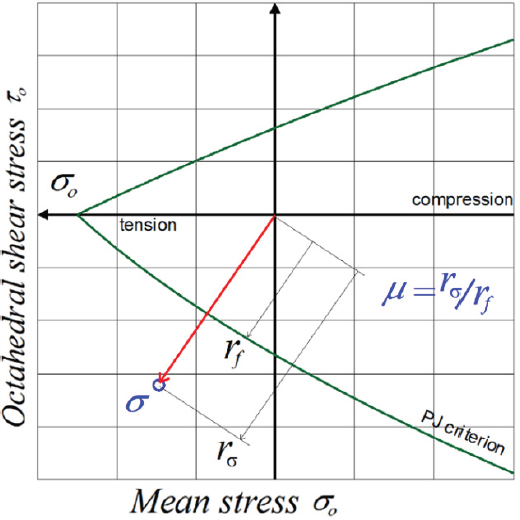
Figure 16
Definition of the material effort ratio μ
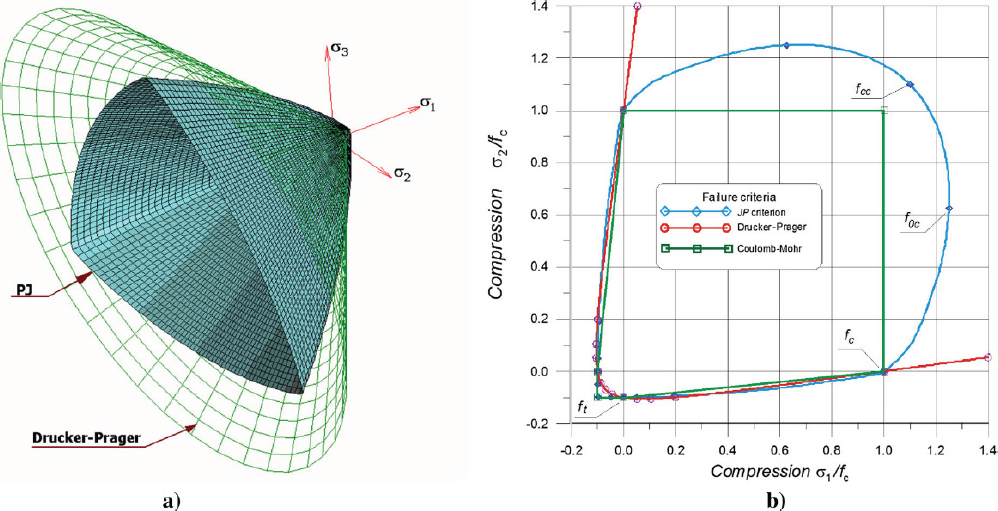
Figure 17
a) The limit surface associated with author Ottosen-Podgórski (PJ) criterion compared with Drucker-Prager cone, b) Coulomb-Mohr, Drucker-Prager and PJ criteria at 2D stress state.
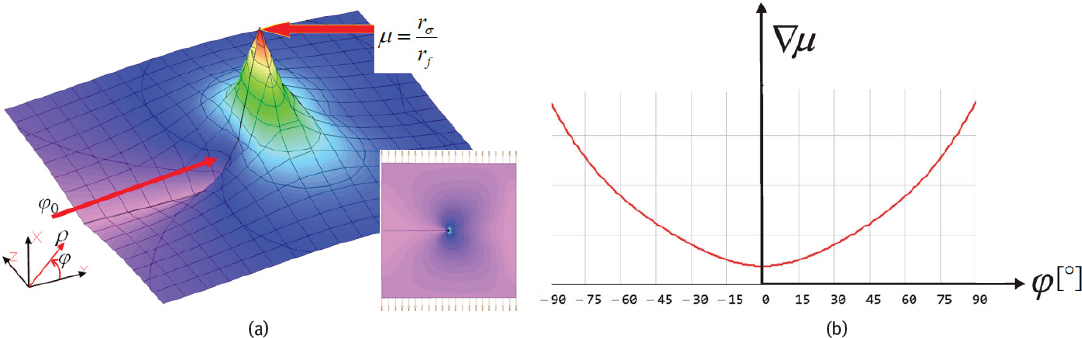
Figure 18
a) Values of the material effort ratio μ near the crack tip, b) the exemplary gradient-crack direction dependency.
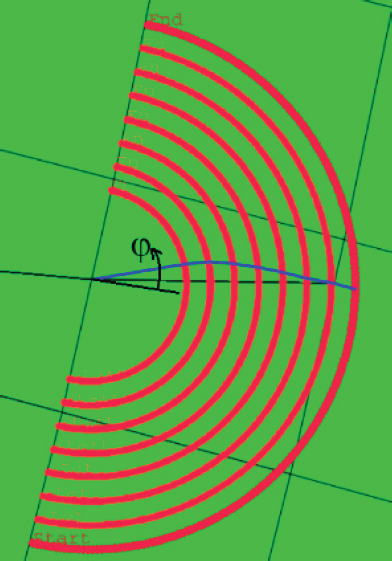
Figure 19
Predicted crack path found with own method.
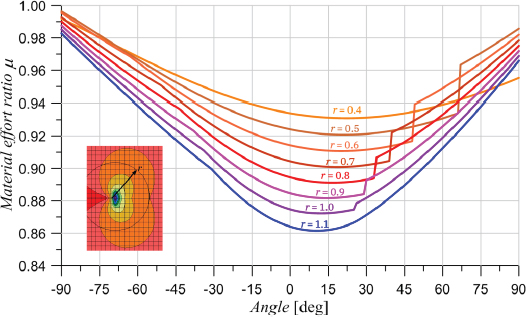
Figure 20
Values of material effort ratio for different angles and different distance from the crack tip.