
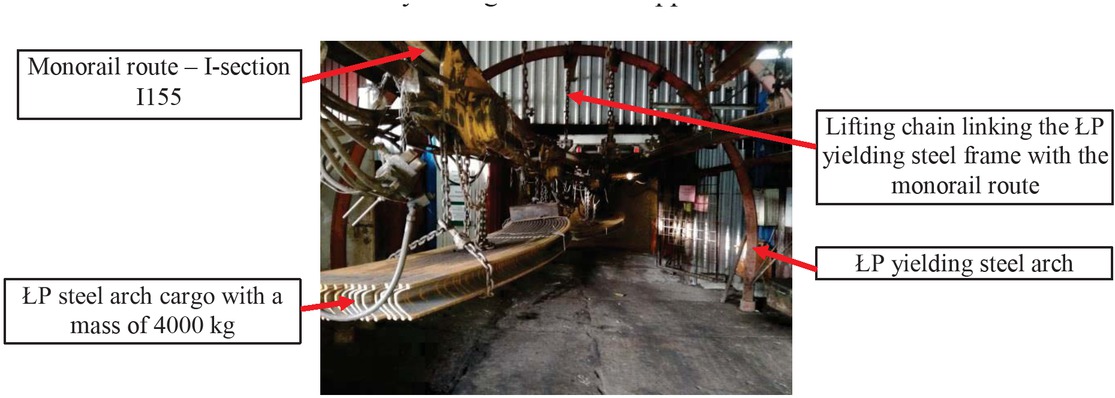
Figure 1
Example view of a route of a suspended monorail with a transport of steel arches that load the ŁP yielding steel arch support frame.
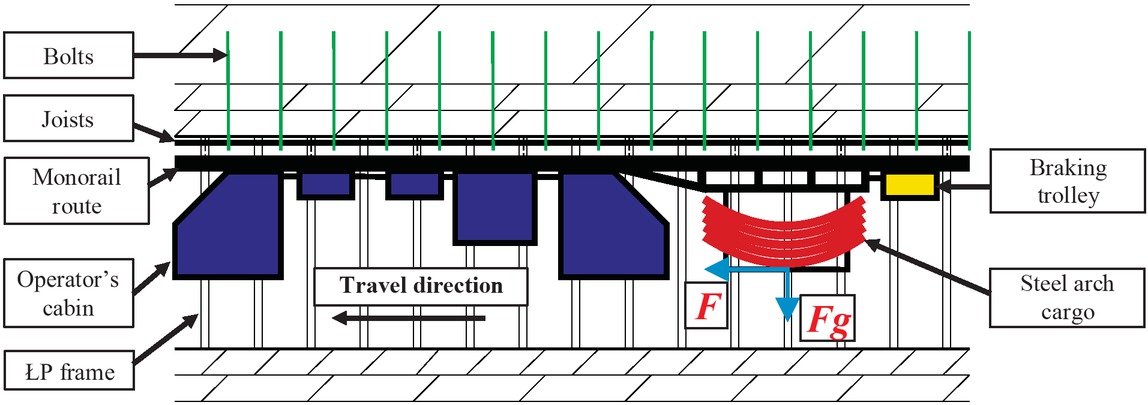
Figure 2
Mine working diagram with transportation via suspended monorail.
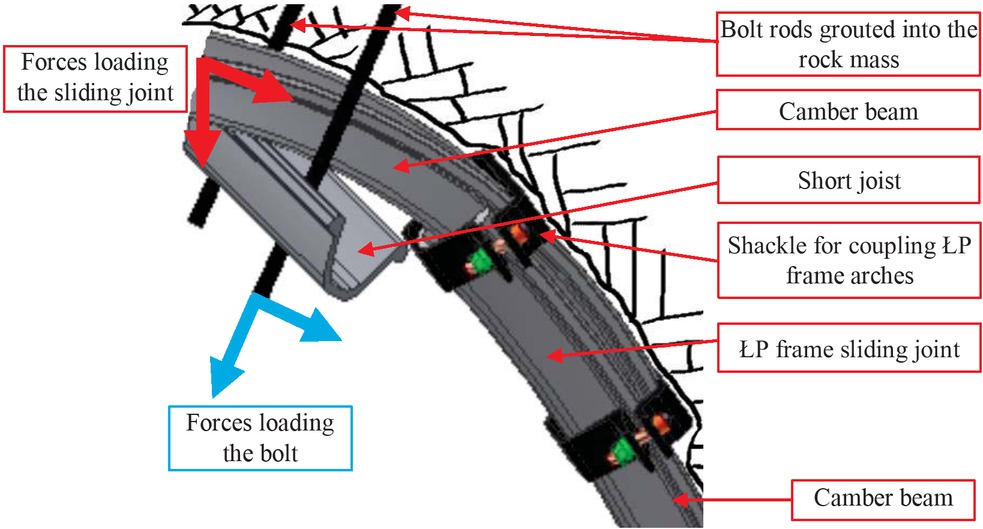
Figure 3
Loading diagram of the ŁP yielding support frame joint and bolts.
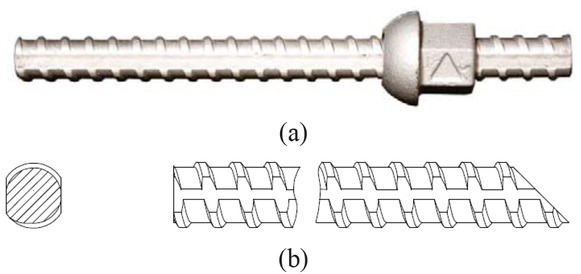
Figure 4
Bolt rod and nut: (a) – view of the rod with the nut; (b) – drawing of the rod with a trapezoidal thread and sectional view.
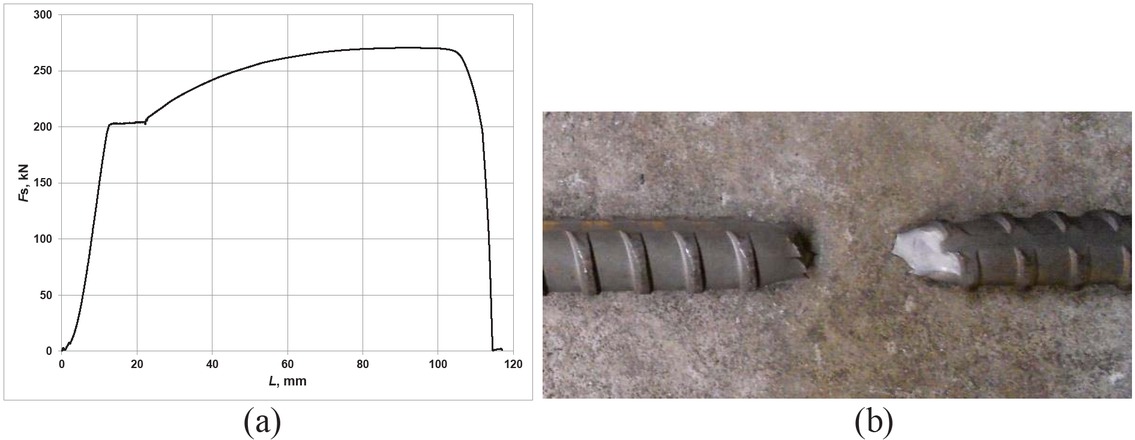
Figure 5
Bolt rod test under static tensile loading: (a) – loading course as a function of bolt rod elongation; (b) – ruptured rod after the test.
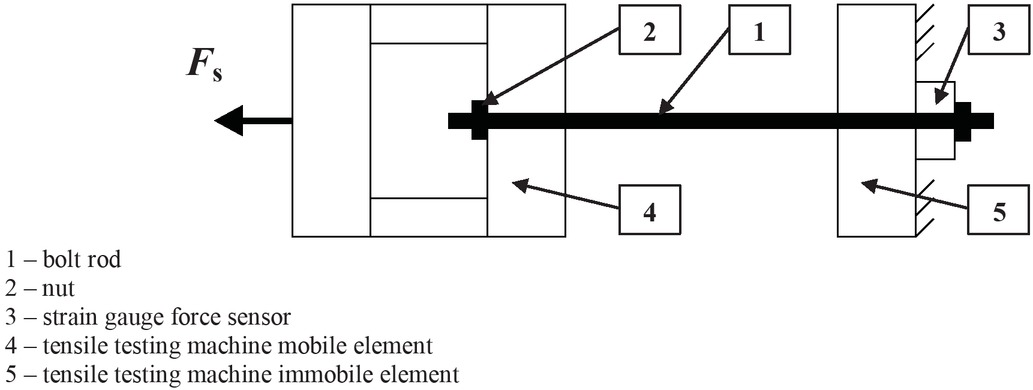
Figure 6
Test stand diagram for bolt tests under static load.
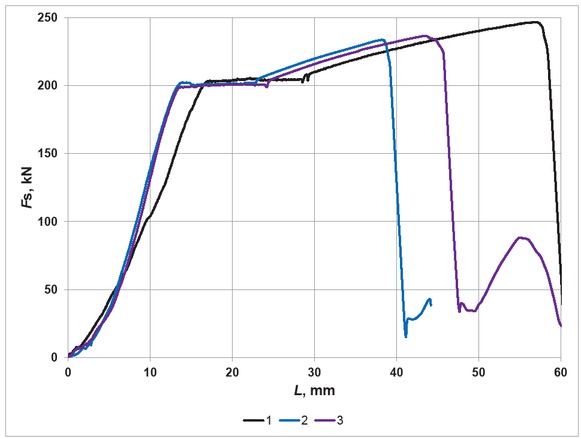
Figure 7
Courses of load as a function of elongation under static load.
Table 1
Results of the rod-and-nut assembly load capacity tests.
| Test number | Maximum load value Fsmax kN | Bolt elongation f corresponding to Lmax mm | Post-test inspection |
|---|---|---|---|
| 1 | 247 | 56.9 | Bolt nut |
| 2 | 234 | 38.1 | thread shearing |
| 3 | 236 | 43.3 |
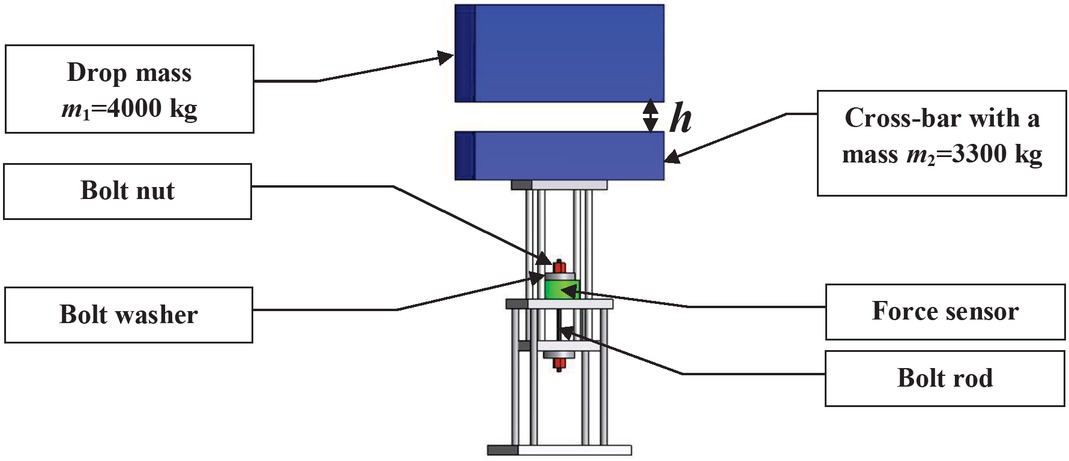
Figure 8
Test facility diagram.
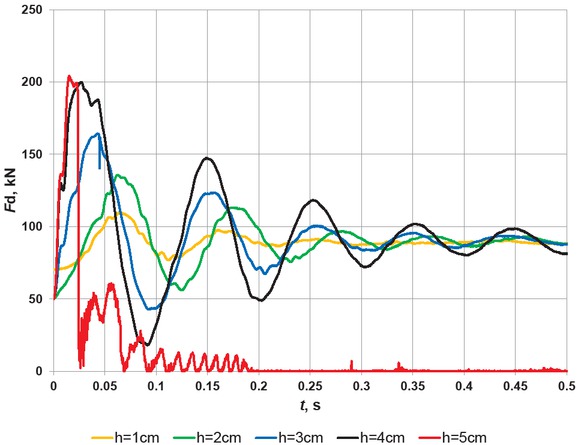
Figure 9
Courses of load as a function of time under dynamic tensile loading of the bolt rods.
Table 2
The result of the bolt rod test under dynamic tensile loading.
| Test number | Drop mass m1, kg | Cross-bar mass m2, kg | Drop height h, m | Impact velocity v, m/s | Maximum load value Fdmax, kN | Post-test inspection |
|---|---|---|---|---|---|---|
| 1 | 4000 | 3300 | 0.01 | 0.44 | 110 | The rod and nut were not |
| 2 | 0.02 | 0.63 | 136 | destroyed | ||
| 3 | 0.03 | 0.77 | 164 | |||
| 4 | 0.04 | 0.89 | 200 | |||
| 5 | 0.05 | 0.99 | 204 | Bolt nut thread shearing and cracking |
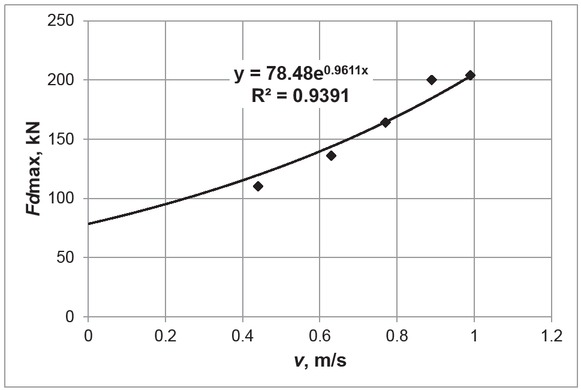
Figure 10
Relation of the maximum force as a function of impact velocity.
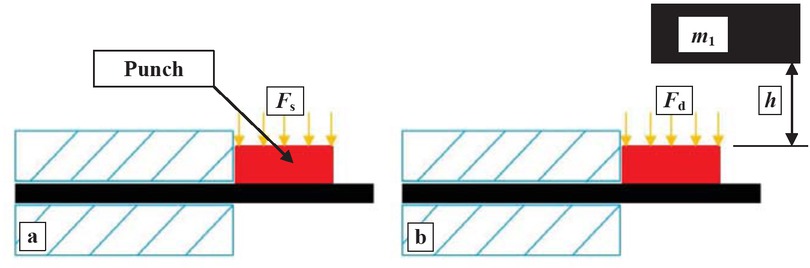
Figure 11
Diagram of the test stand for bolt rod shear tests under: (a) – static load; (b) – dynamic load.
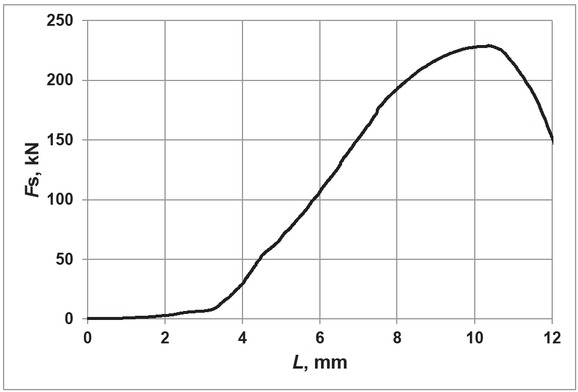
Figure 12
Relation of load as a function of bolt rod displacement during its shearing (maximum shearing force Fsmax = 229 kN).
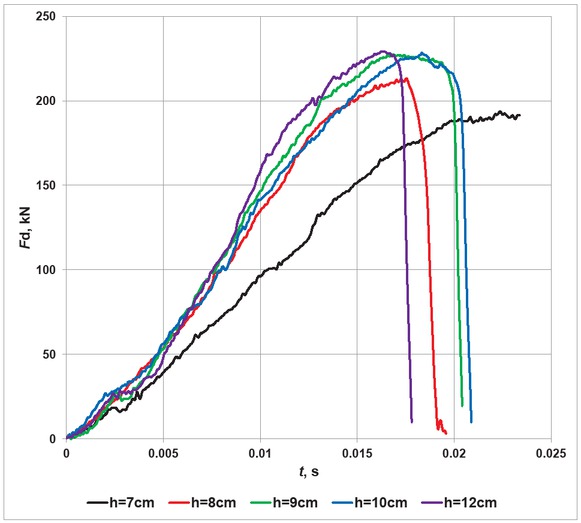
Figure 13
Relations of load as a function of time under dynamic shear loading of the bolt rods.
Table 3
The result of the bolt rod test under dynamic shear loading.
| Test number | Drop mass m1, kg | Cross-bar mass m2, kg | Drop height h, m | Impact velocity v, m/s | Maximum load value Fdmax kN | Post-test inspection |
|---|---|---|---|---|---|---|
| 1 | 2500 | 0 | 0.07 | 1.17 | 194 | the rod was not shorn |
| 2 | 0.08 | 1.25 | 213 | the rod was shorn | ||
| 3 | 0.09 | 1.33 | 227 | |||
| 4 | 0.1 | 1.40 | 228 | |||
| 5 | 0.12 | 1.53 | 229 |
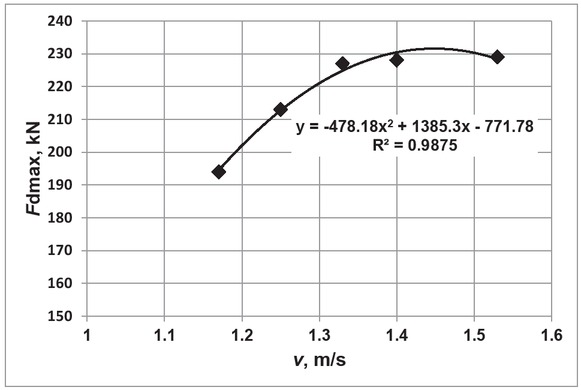
Figure 14
Relation of the maximum shearing force and impact velocity.
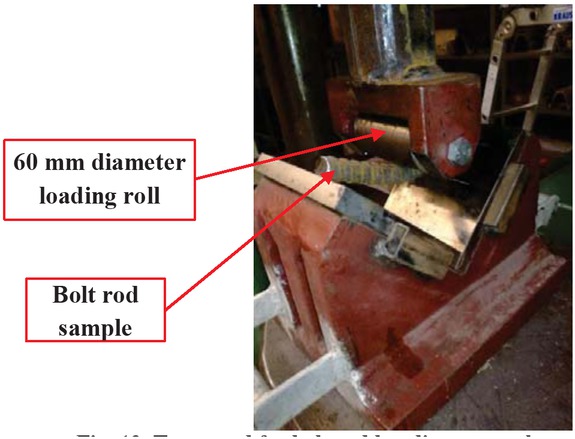
Figure 15
Test stand for bolt rod bending strength tests under static load.
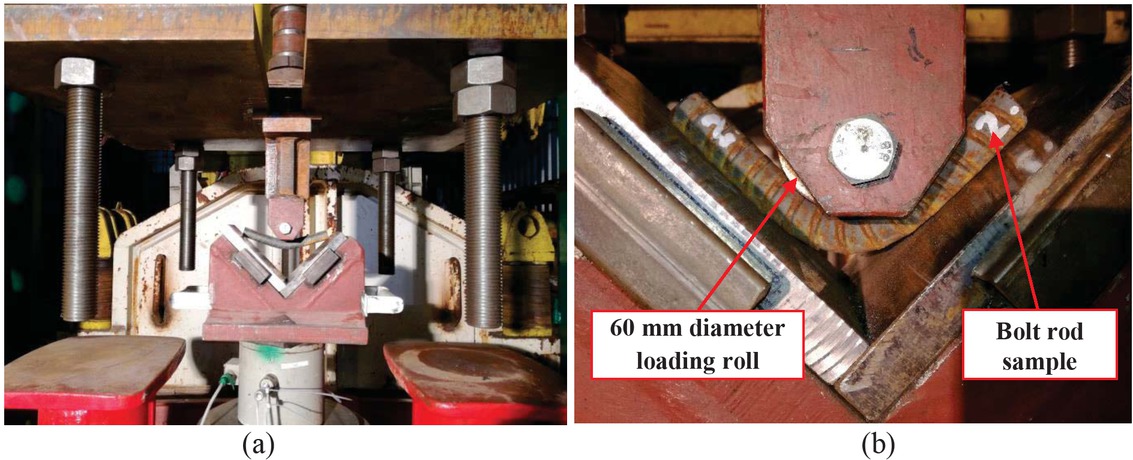
Figure 16
Test stand for bending strength tests under dynamic load: (a) – rod bending by an angle smaller than 90°; (b) – rod bending by 90°.
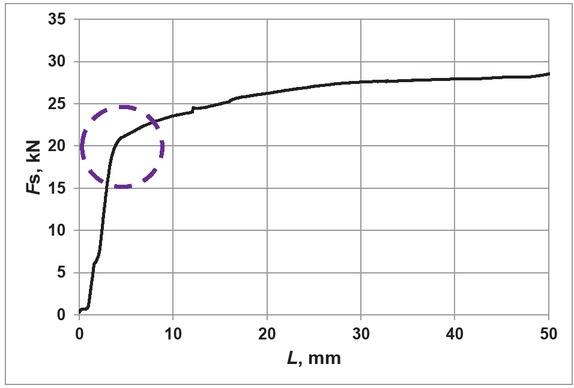
Figure 17
Course of load as a function of bolt rod displacement during its bending (maximum bending force Fsmax = 26.3 kN).
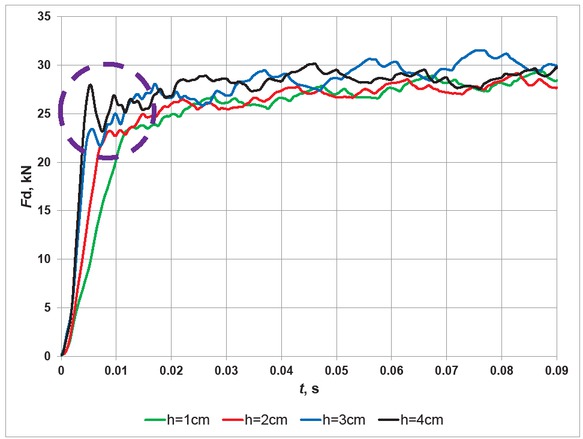
Figure 18
Courses of load Fd as a function of time t under dynamic bending loading of the bolt rods.
Table 4
The result of the bolt rod test under dynamic bending loading.
| Test number | Drop mass m1, kg | Cross-bar mass m2, kg | Drop height h, m | Impact velocity v, m/s | Maximum load value Fdmax kN | Post-test inspection |
|---|---|---|---|---|---|---|
| 1 | 2500 | 0 | 0.01 | 0.44 | 29.7 | The rod was not bent by 90° The sample did not rupture |
| 2 | 0.02 | 0.63 | 29.4 | The rod was bent by 90° | ||
| 3 | 0.03 | 0.77 | 32.1 | The samples did not rupture | ||
| 4 | 0.04 | 0.89 | 30.2 |
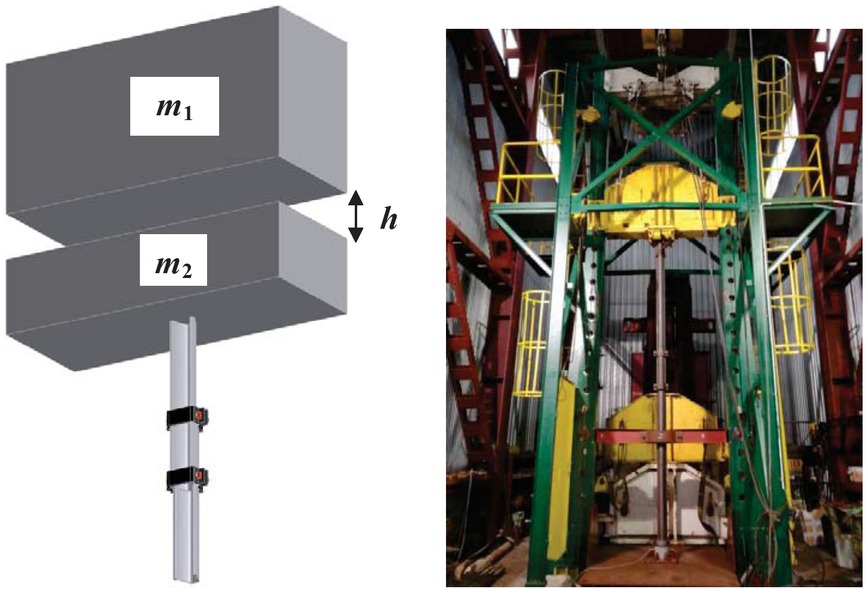
Figure 19
Diagram (left) and view (right) of the facility for sliding joint tests under dynamic load.
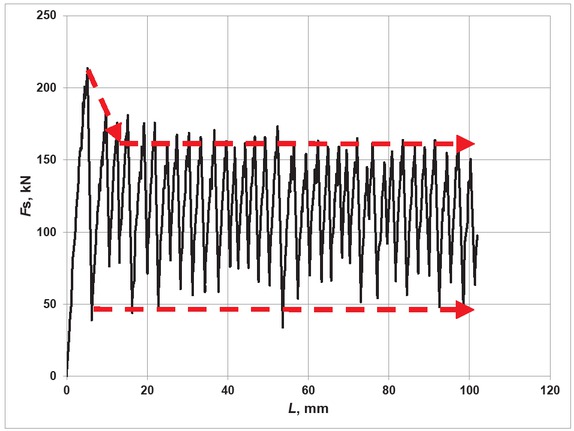
Figure 20
Course of load as a function of joint displacement under static load (maximum loading force Fsmax = 213 kN).
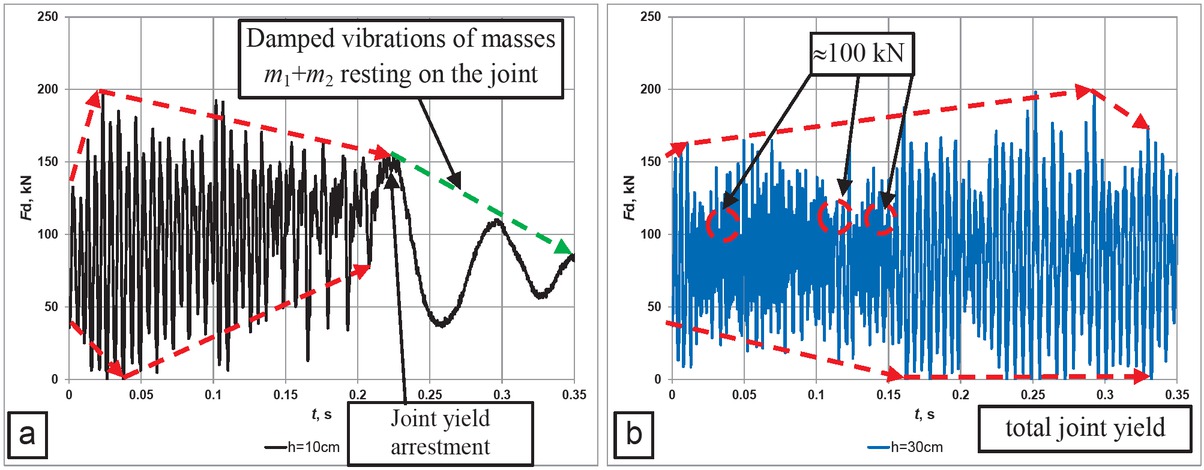
Figure 21
Course of load Fd as a function of time t under dynamic load of the joint at heights: h = 10 cm (a) and h = 30 cm (b).
Table 5
The test result for the joint constructed from V29 sections under dynamic load.
| Test number | Drop height h, m | Impact velocity v, m/s | Section | Number of shackles | Nut tightening torque, Nm | Maximum load capacity Fdmax , kN | Comments |
|---|---|---|---|---|---|---|---|
| 1 | 0.1 | 1.4 | V29 | 2 | 350 | 197 | the joint stopped after |
| approx. 10 cm | |||||||
| 2 | 0.2 | 2.8 | 206 | total joint yield | |||
| 3 | 0.3 | 4.2 | 197 |