
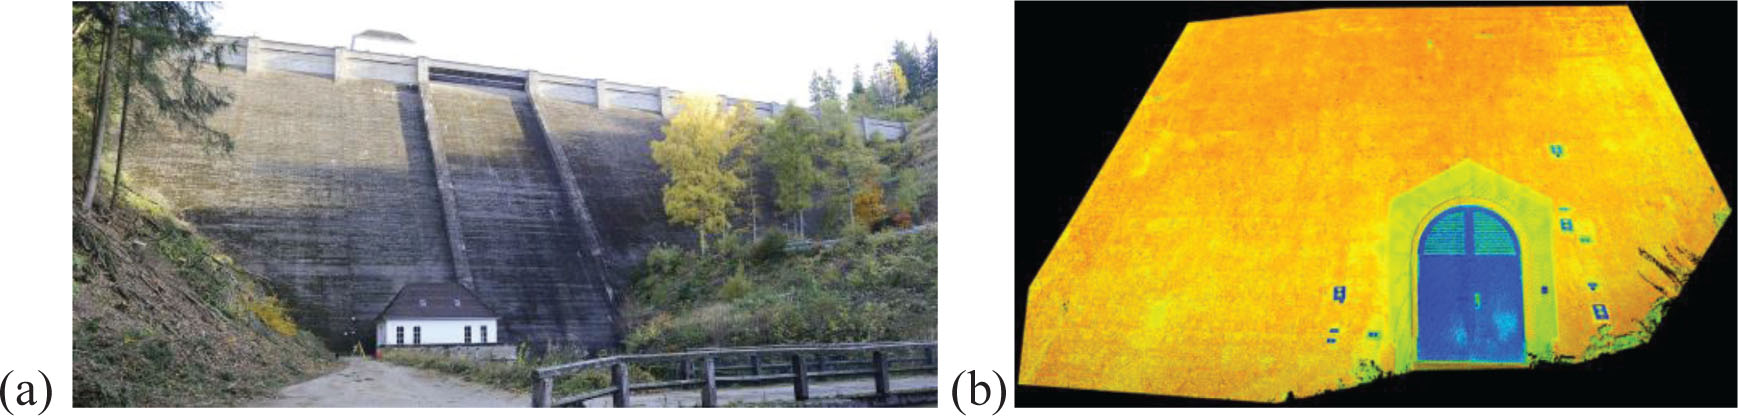
Figure 1
Ecker Dam. (a) Photograph of the structure and (b) results of laser scanning with Leica C10 of downstream surface – station 501 (image of intensity).
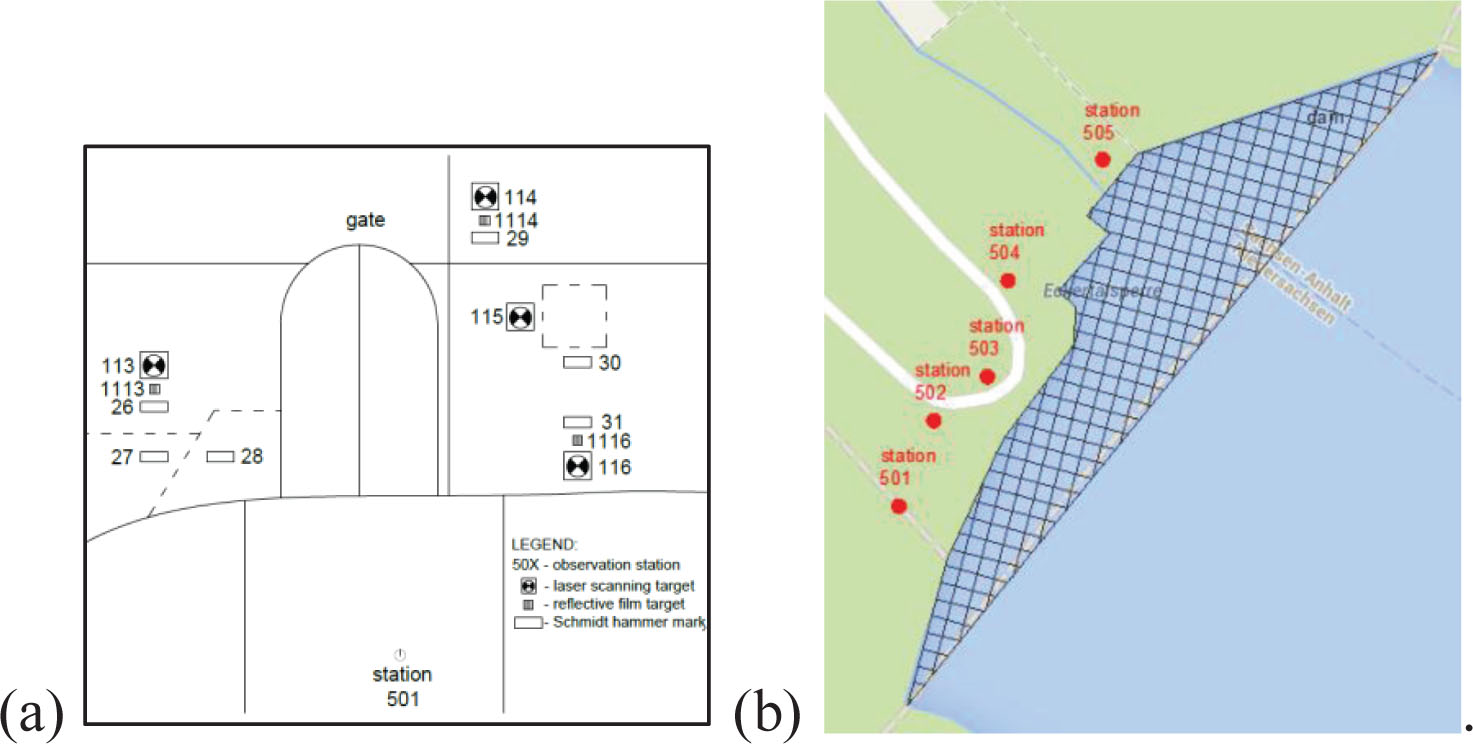
Figure 2
Ecker Dam: (a) example of survey markers/planar targets/signs distribution (station 501) and (b) survey position locations.
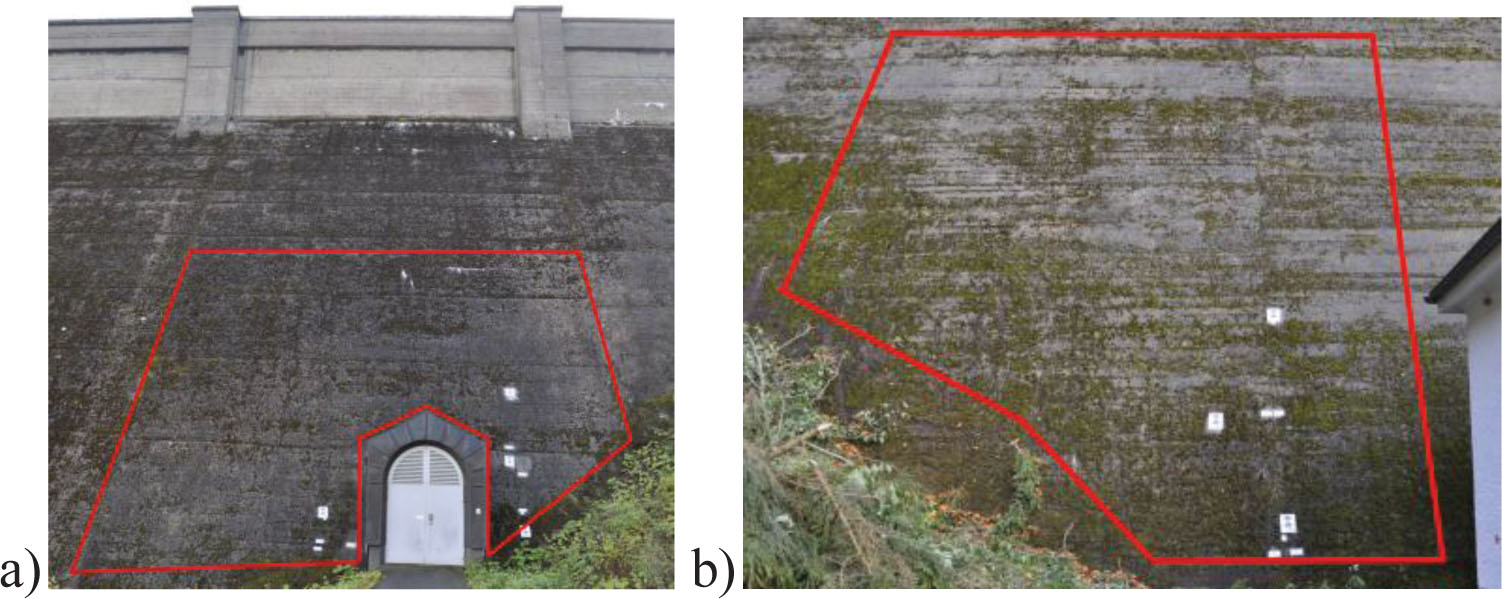
Figure 3
Selected fragments of Ecker Dam surface: (a) east section (station 501) and (b) west section (station 505).
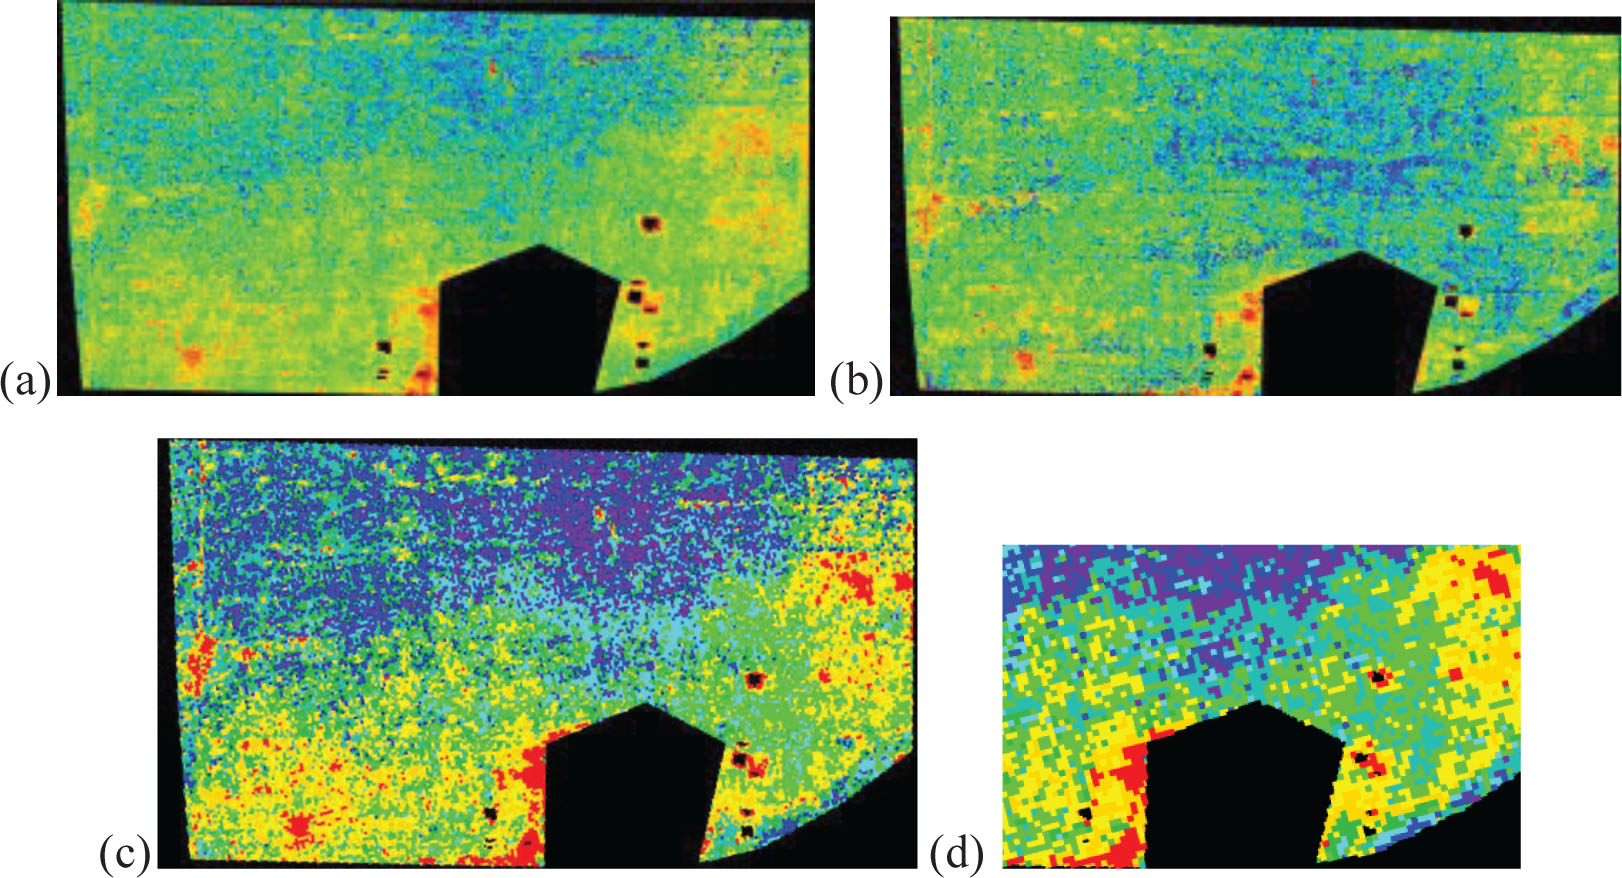
Figure 4
Results of unsupervised classification of intensity value using ISODATA algorithm, Ecker Dam, station 501: (a) Scanner Leica C10, pixel 5 mm × 5 mm; (b) scanner Z+F 5006 h, pixel 5 mm × 5mm; (c) integrated data, pixel 5 cm × 5 cm; (d) integrated data, pixel 10 cm × 10 cm (fragment) clearly visible/legible separate surface areas of concrete surface filled with different material (red colour) and clear concrete (yellow and orange colours).
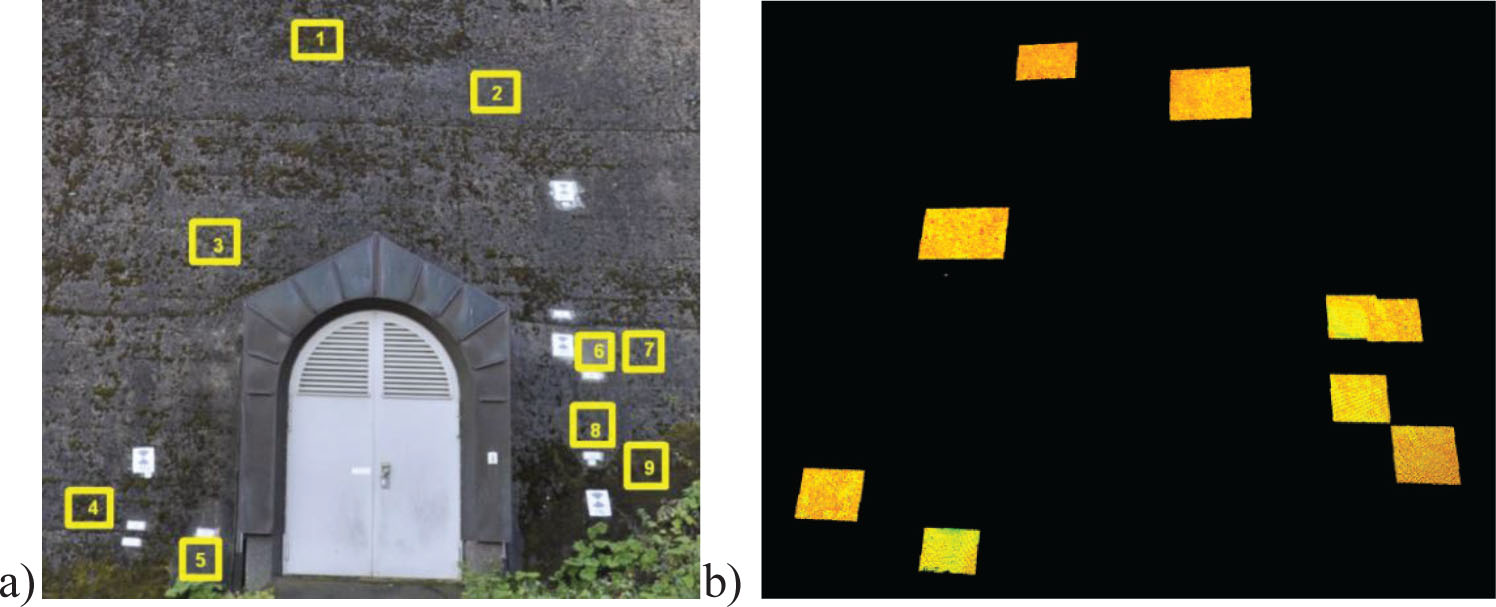
Figure 5
Reference fields Intensity images (with Leica C10, station 501): (a) reference fields marked on the concrete dam’s wall and (b) image of intensity of the reference fields.
Table 1
Selected reference fields for stations 501 and 505.
| Class | Description | Reference fields |
|---|---|---|
| Station 501 | ||
| 1 | Clean concrete | 1, 2 |
| 2 | Concrete covered with mosses to a lower extent | 3, 4, 7 |
| 3 | Concrete covered with mosses to a higher extent | - |
| 4 | Concrete covered with mosses | 9 |
| 5 | Infill areas with material of different properties (such as. cement) | 5, 6, 8 |
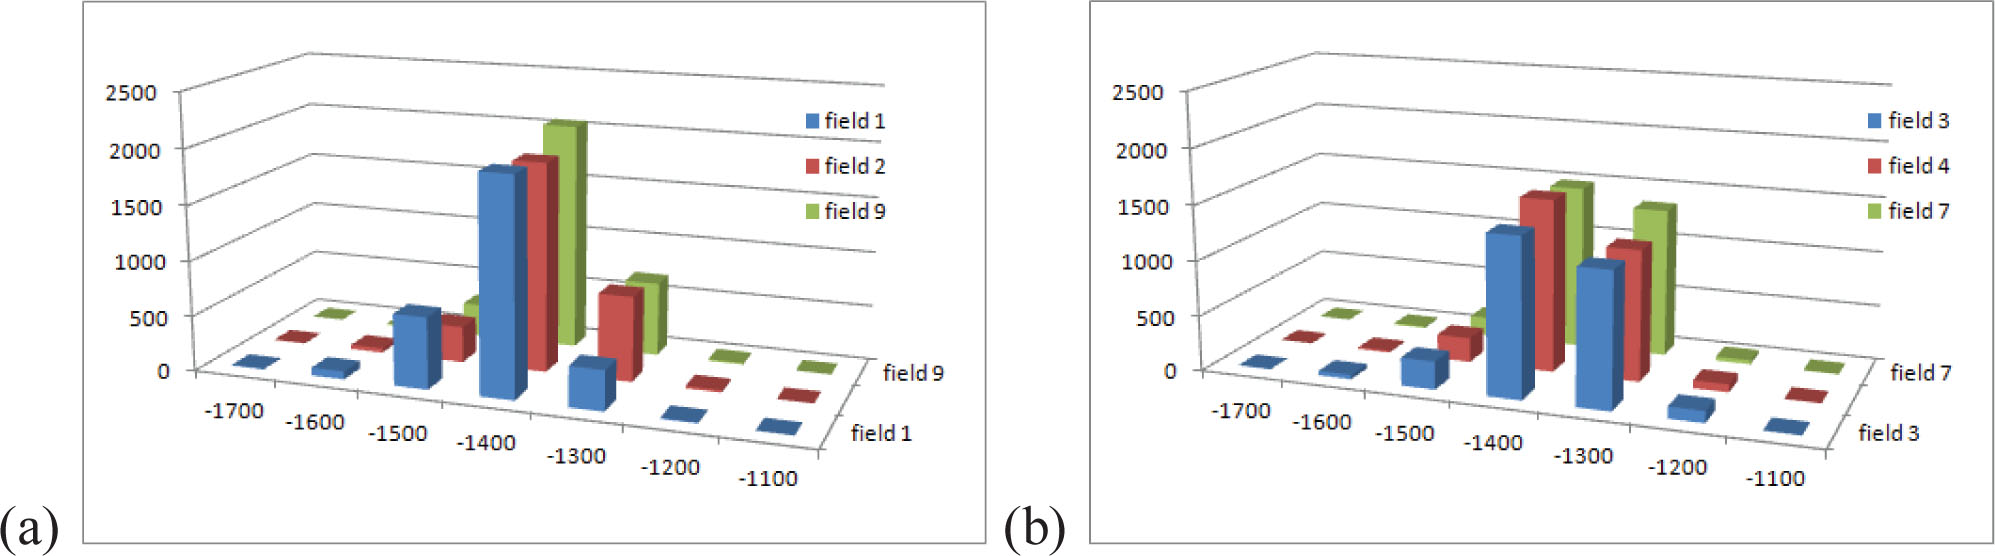
Figure 6
Classes 1 and 2 histograms (station 501, scanner Leica C10): X-axis – registered values range; Y-axis – occurrence number for sample area. (a) Class 1 – clean concrete; and (b) Class 2 – concrete covered with mosses to a small extent.
Table 2
Comparison of statistical parameters, characterising reference samples – Ecker Dam.
| Class | Sample fields/reference | Description | I | Minimum | Maximum | Mean | Standard deviation | Dominant (range of values) |
|---|---|---|---|---|---|---|---|---|
| Ecker Dam – Leica C10 – Station 501 | ||||||||
| 1 | 2 | Clean concrete | I * | −1,630 | −1,274 | −1,427.42 | 36.05 | −1,455 to −1,397 |
| Iavg5 ** | −1,456 | −1,396 | −1,425.60 | 14.38 | −1,440 to −1,409 | |||
| Iavg10 *** | −1,455 | −1,403 | −1,427.00 | 11.68 | −1,435 to −1,418 | |||
| 2 | 4 | Concrete covered with mosses to a small extent | I * | −1,643 | −1,207 | −1,415.91 | 45.10 | −1,461 to −1,378 |
| Iavg5 ** | −1,452 | −1,351 | −1,415.34 | 19.75 | −1,429 to −1,392 | |||
| Iavg10 *** | −1,441 | −1,389 | −1,412.77 | 12.83 | −1,423 to −1,403 | |||
| 3 | - | Concrete covered with mosses to a high extent | Not designated | |||||
| 4 | − | Concrete covered with mosses | Identification error caused by significant surface dampness | |||||
| 5 | 6 | Infill areas with material of different properties (such as cement) | I * | −1,403 | −1,311 | −1,357.21 | 18.69 | −1,380 to −1,332 |
| Iavg5 ** | −1,442 | −1,299 | −1,358.26 | 30.58 | −1,366 to −1,340 | |||
| Iavg10 *** | −1,380 | −1,322 | −1,350.20 | 18.26 | −1,357 to −1,353 | |||
Table 3
Differences in class identification.
| Fields | Station 501 | |
|---|---|---|
| Leica C10 | Z+F 5006h | |
| 1 | Class I | Class I |
| 2 | Class I | - |
| 3 | Class II | Class II |
| 4 | Class II | Class II |
| 5 | Class V | - |
| 6 | Class V | - |
| 7 | Class II | Class I |
| 8 | Class V | - |
| 9 | Class I | - |
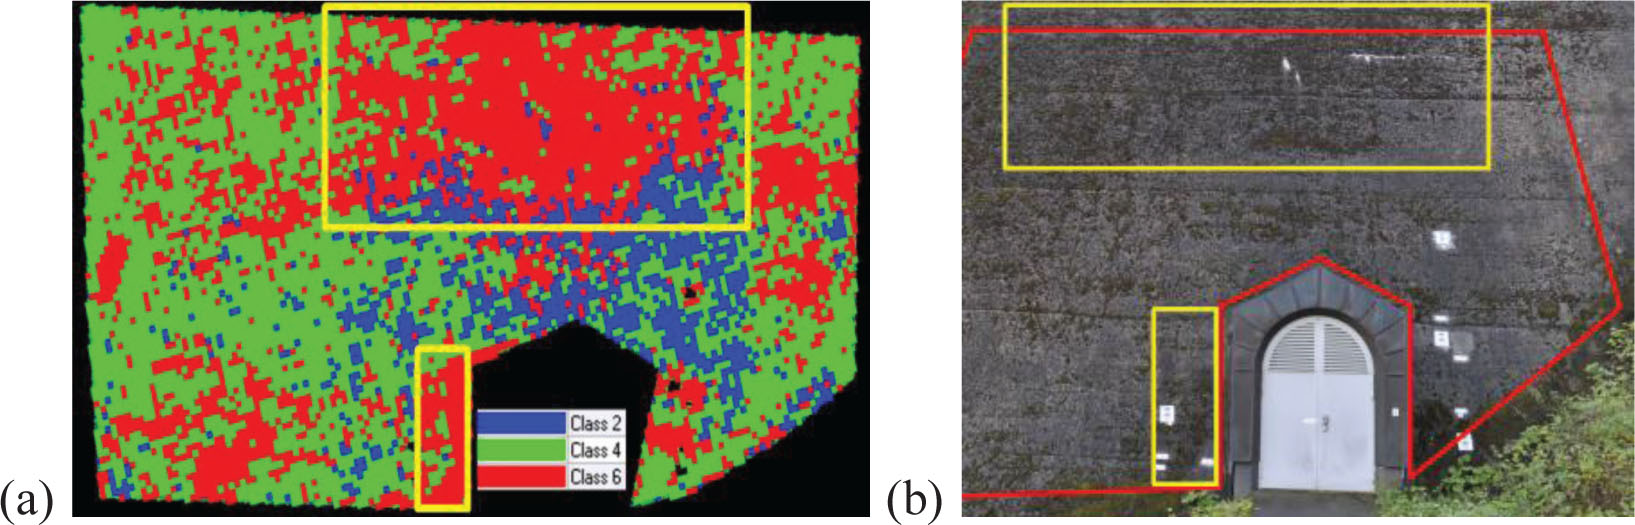
Figure 7
The areas indicated for preservation in station 505: (a) area highlighted with yellow colour was defined using supervised classification results, classes defined as follows: 2 – Class I (clean concrete), 4 – Class II (concrete covered with mosses to small extent), 6 – Class V (infill areas or significant surface erosion);and (b) area designated for preservation marked onthe visible spectrum image.
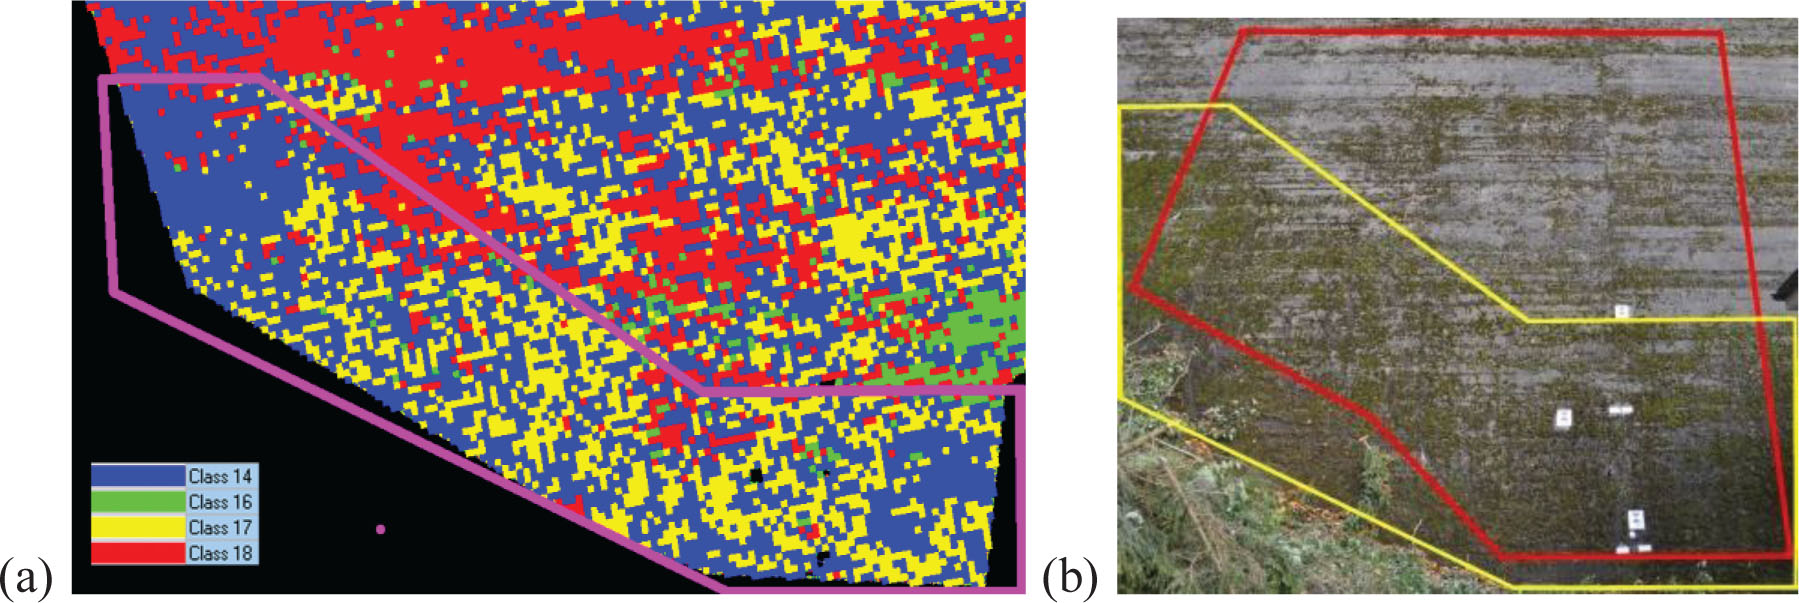
Figure 8
Areas indicated for cleaning in station 505: (a) area highlighted with magenta was defined using supervised classification results, classes indicated analogically to Figure 7, and (b) area designated for preservation marked on the visible spectrum image.