
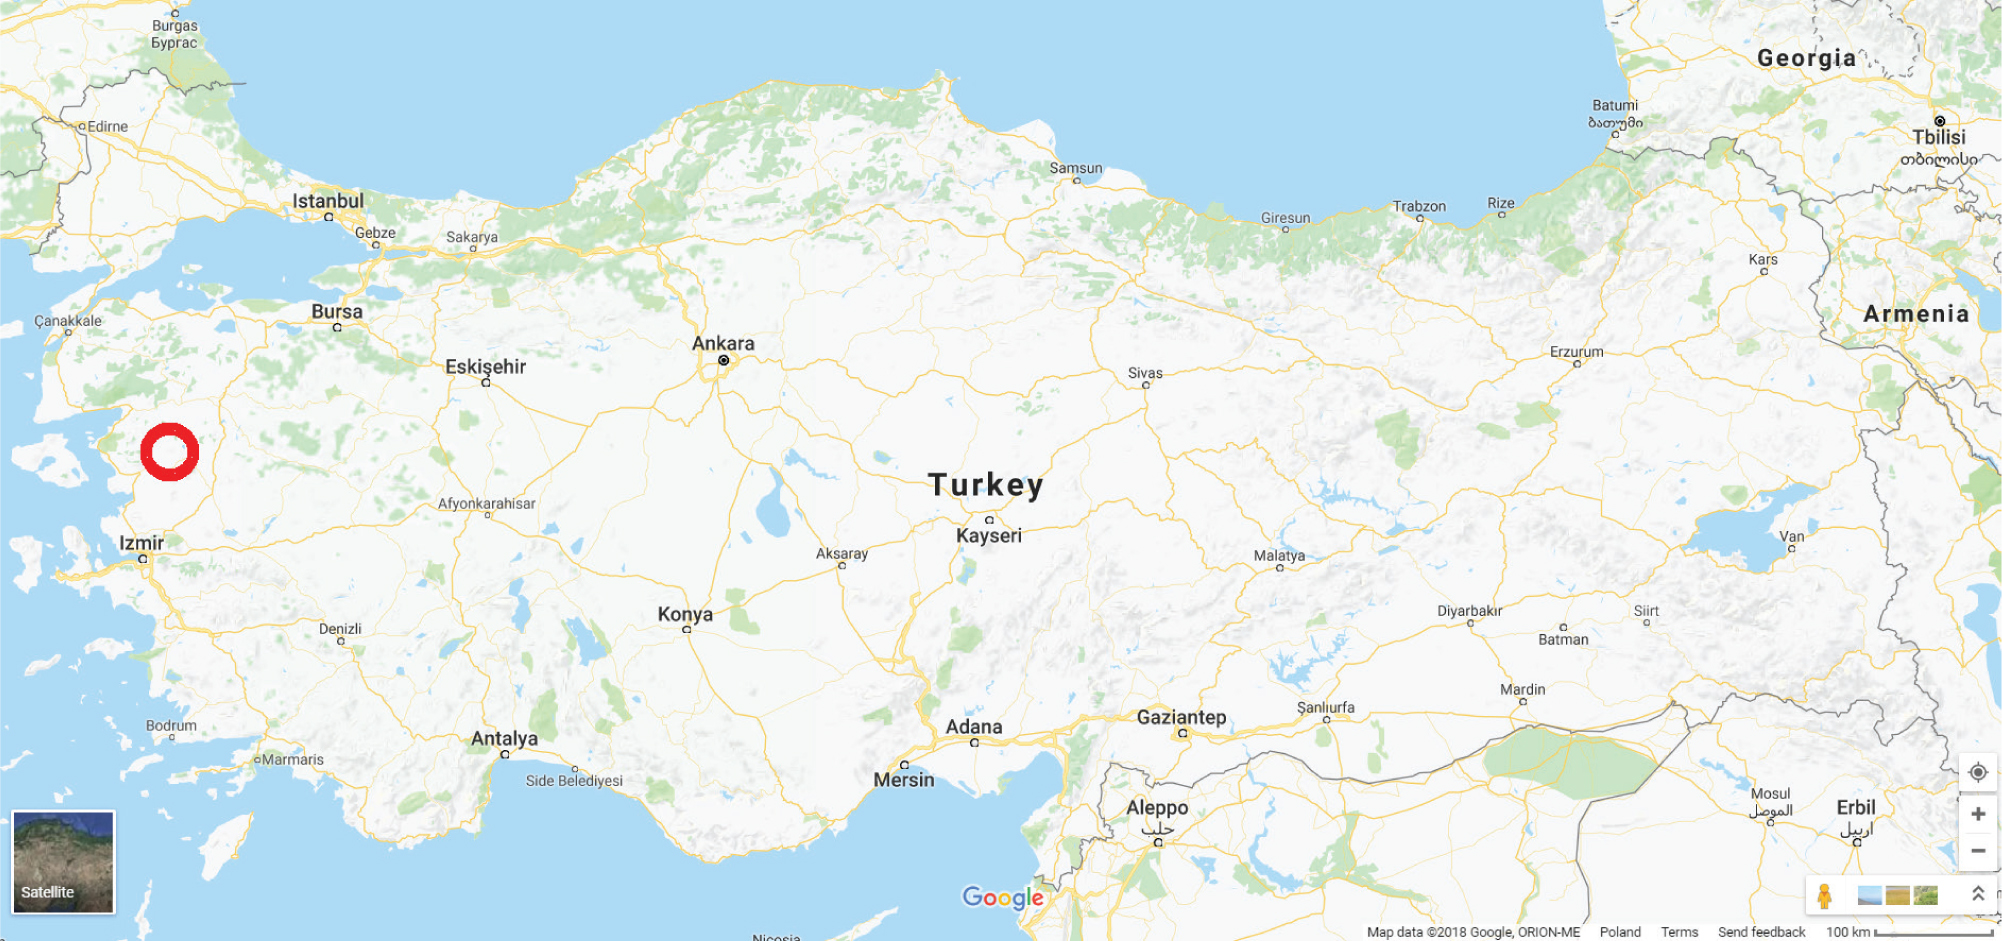
Figure 1
Location of the Soma basin (Google Maps).
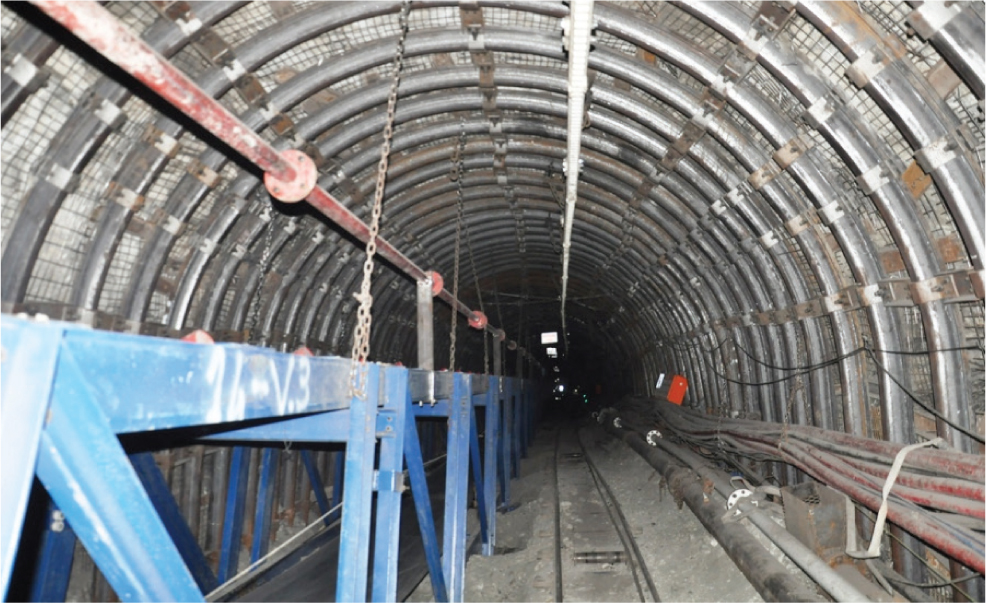
Figure 2
General view of the gallery [11].
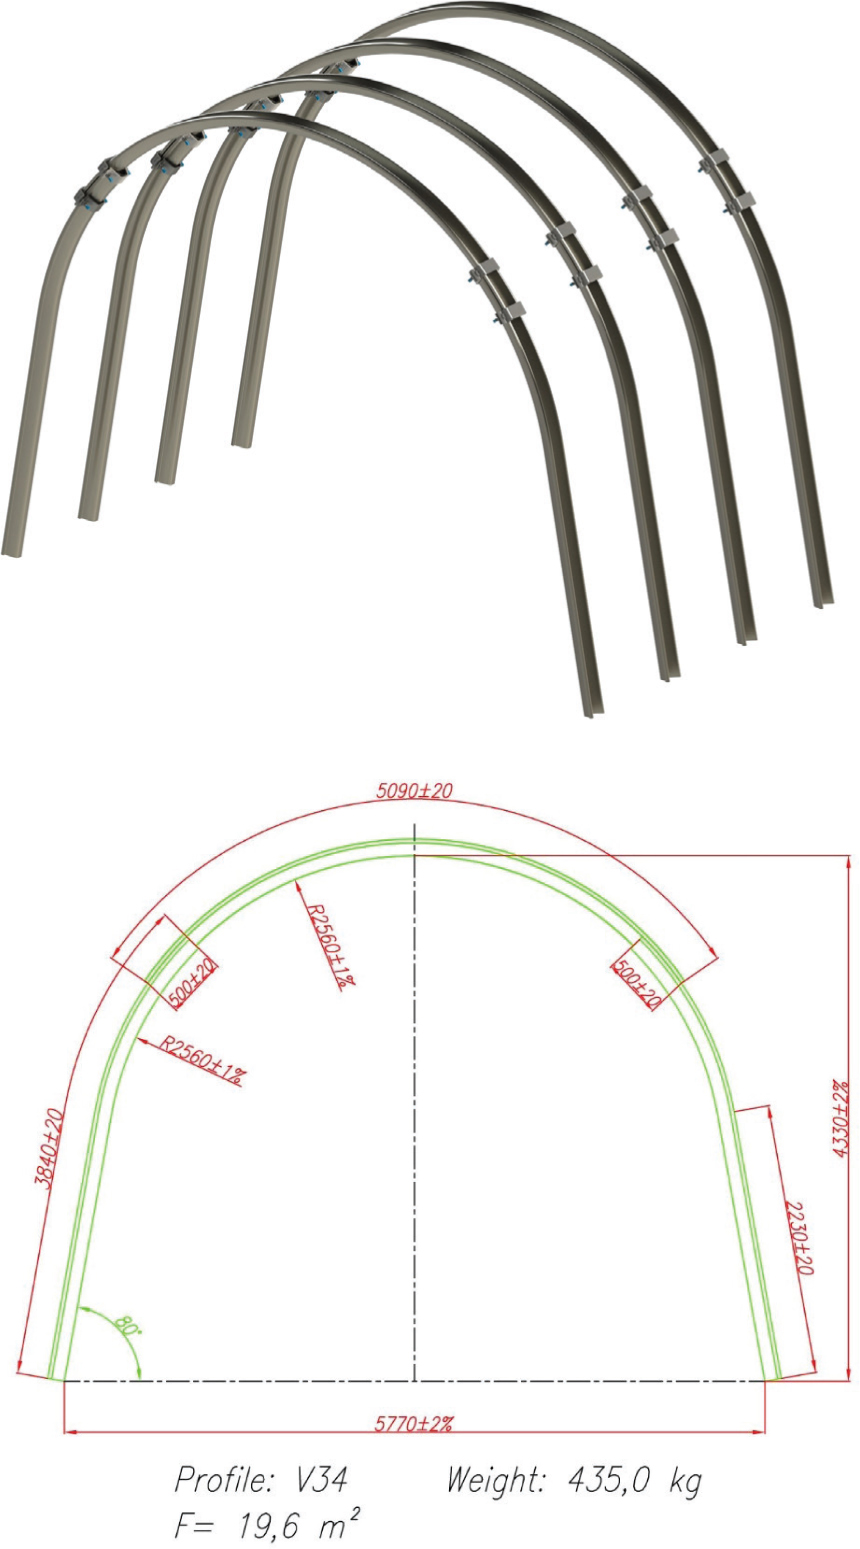
Figure 3
The shape of the frame and basic geometrical parameters.
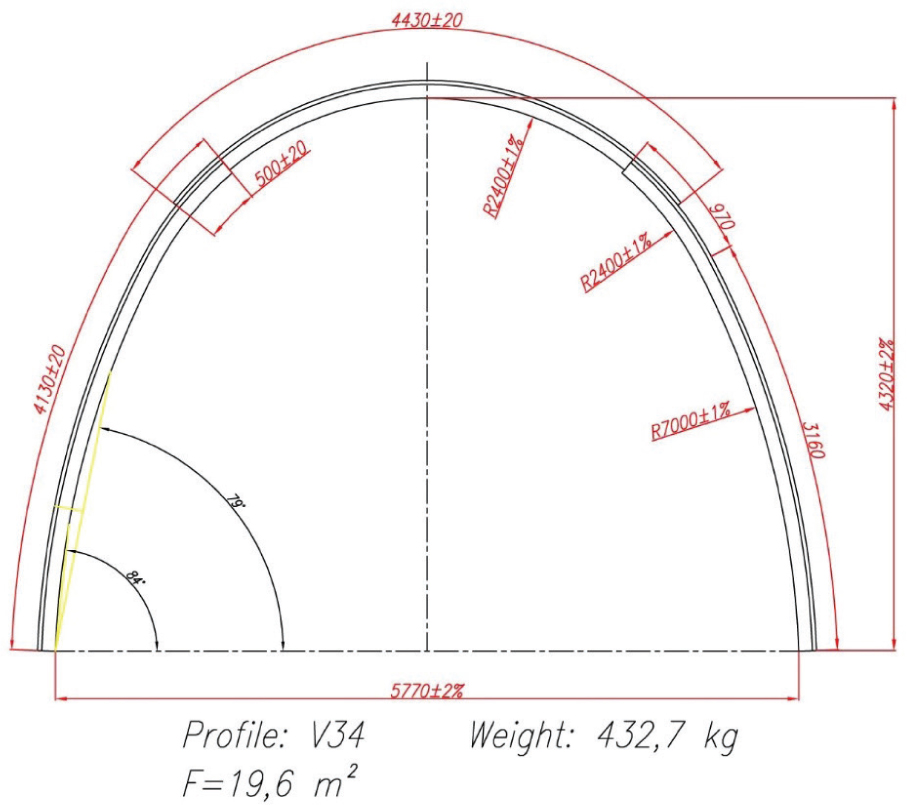
Figure 4
The proposed outline of the frame of approximately 20 m2.
Table 1
Material factor γs.
| Steel grades | Ys | Re min. (MPa) | Rm min. (MPa) |
|---|---|---|---|
| 25G2; 31Mn4 | 1.15 | 340 | 550 |
| S480W | 1.25 | 480 | 650 |
| S550W | 1.25 | 550 | 730 |
Table 2
Material plasticising coefficient
| Steel grades | n |
|---|---|
| 25G2; 31Mn4 (Re = 340 MPa, Rm = 550 MPa) | 0.6176 |
| S480W (Re = 480 MPa, Rm = 650MPa) | 0.3542 |
| S550W (Re = 550 MPa, Rm = 730 MPa) | 0.3273 |
Table 3
Cross-sectional mechanical parameters of V36 profile
| Profile | A | H | B | e | lX | lY | WX | WY | epl | WplX | m | σdop25G2 | σdopS480W | σdopS550W |
|---|---|---|---|---|---|---|---|---|---|---|---|---|---|---|
| cm2 | mm | mm | mm | cm4 | cm4 | cm3 | cm3 | mm | cm3 | – | MPa | MPa | MPa | |
| V36 | 45.16 | 138 | 171 | 65.68 | 923 | 1229 | 127.64 | 143.74 | 61.57 | 185.72 | 1.455 | 612 | 694 | 784 |
Table 4
Models analysed.
| Model designation | Arch support | Section | Steel grade |
|---|---|---|---|
| A | Current | V36 | S480W |
| B | Proposed | V36 | S480W |
| C | Proposed | V36 | S550W |
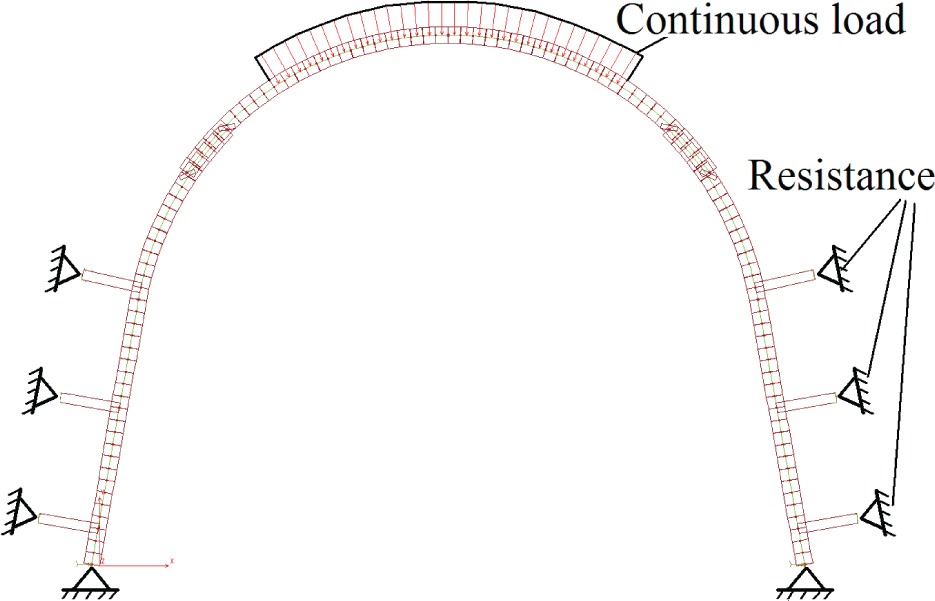
Figure 5
Variant I of the load on the frame.
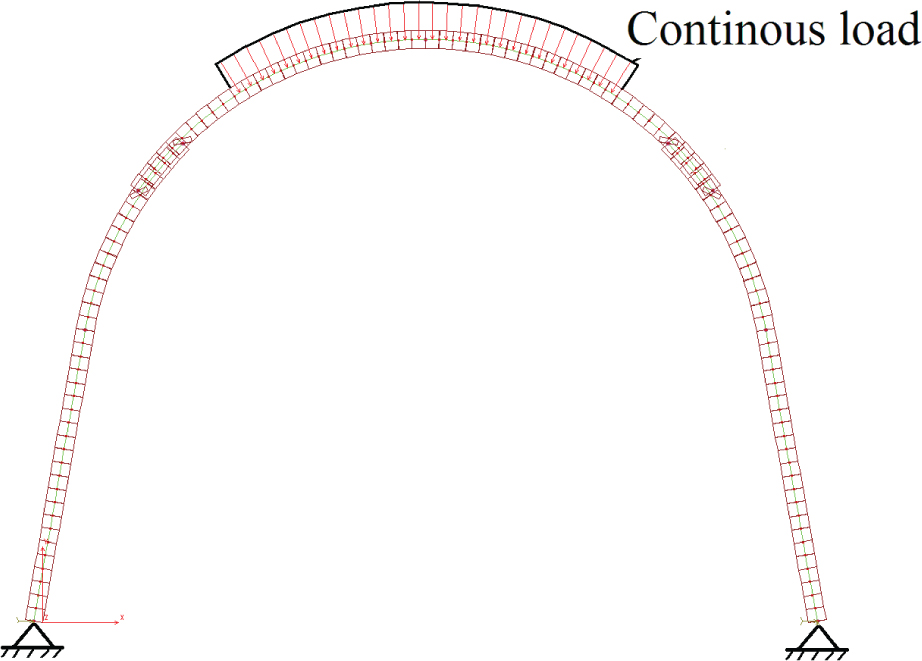
Figure 6
Variant II of the load on the frame.
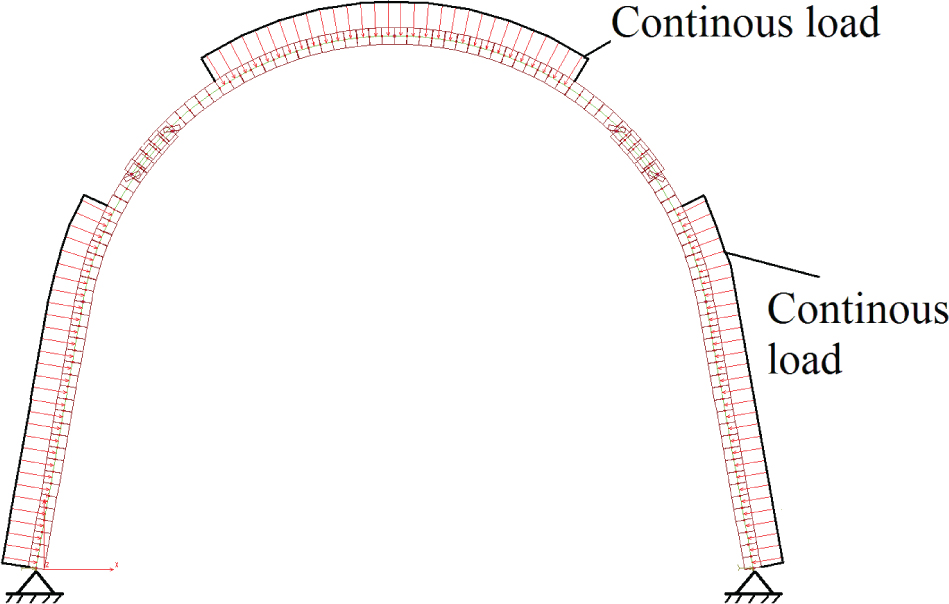
Figure 7
Variant III of the load on the frame.
Table 5
Maximum stress values in the analysed arch supports
| Model designation | Load scheme | ||
|---|---|---|---|
| I | II | III | |
| (qs = 0.1 MN/m | (qs=0.1 MN/m | (qs = 0.1 MN/m | |
| + resist the side wall) | + no side wall resistance) | + qo = 0.05 MN/m) | |
| A (current V36, S480W) | Smax = 310.7 MPa | Smax = 609.1 MPa | Smax = 327.3 MPa |
| B (proposed V36, S480W) C (proposed V36, S550W) | Smax = 268.2 MPa | Smax = 578.3 Mpa | Smax = 262.6 Mpa |
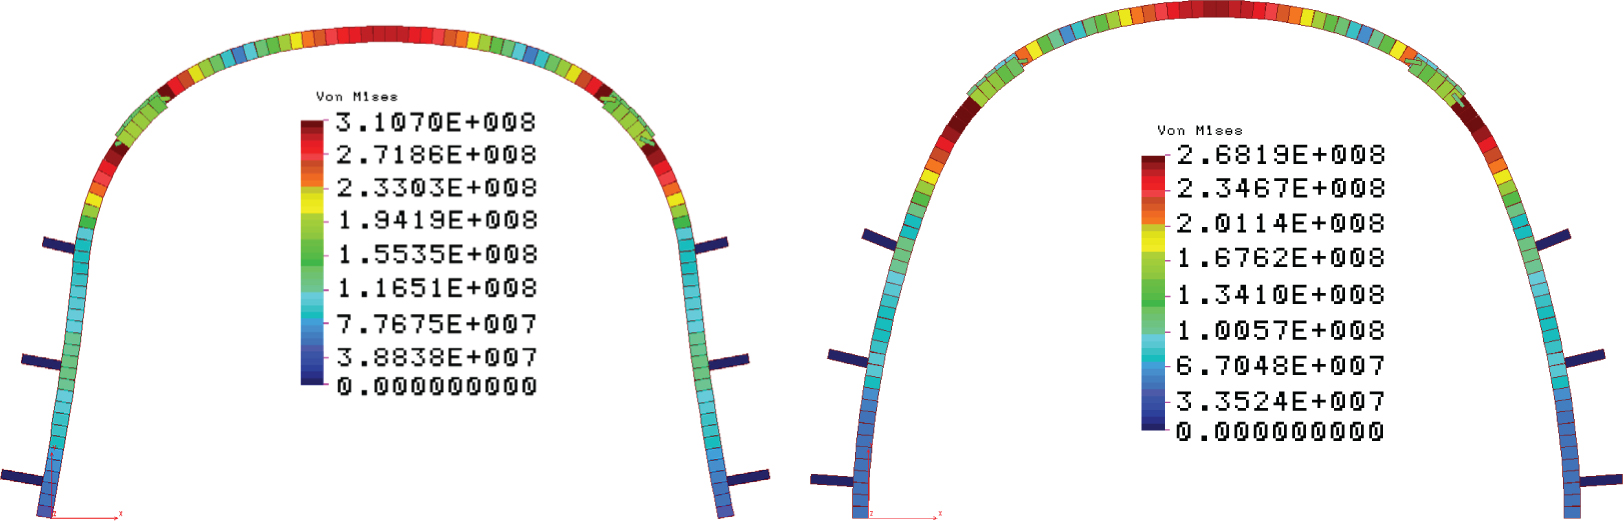
Figure 8
The map of reduced stresses in the A (left) and B and C (right) frames for load scheme I (qs = 0.1 MN/m, stresses in Pa, deformation scale 10×).
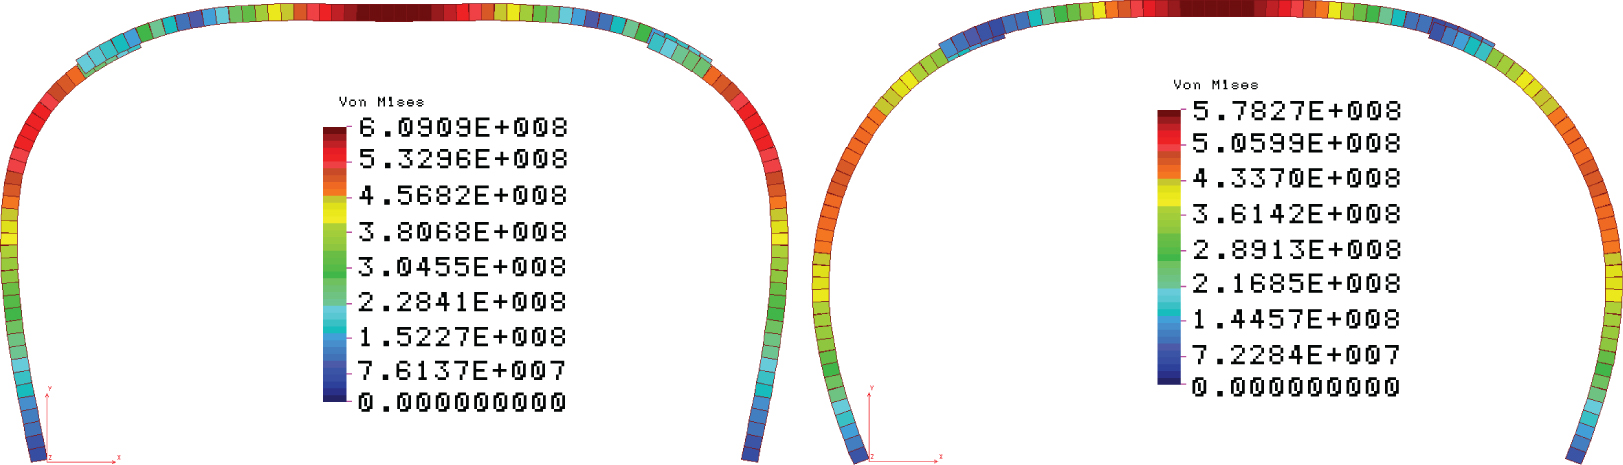
Figure 9
The map of reduced stresses in the A (left) and B and C (right) frames for load scheme II (qs = 0.1 MN/m, stresses in Pa, deformation scale 10×).
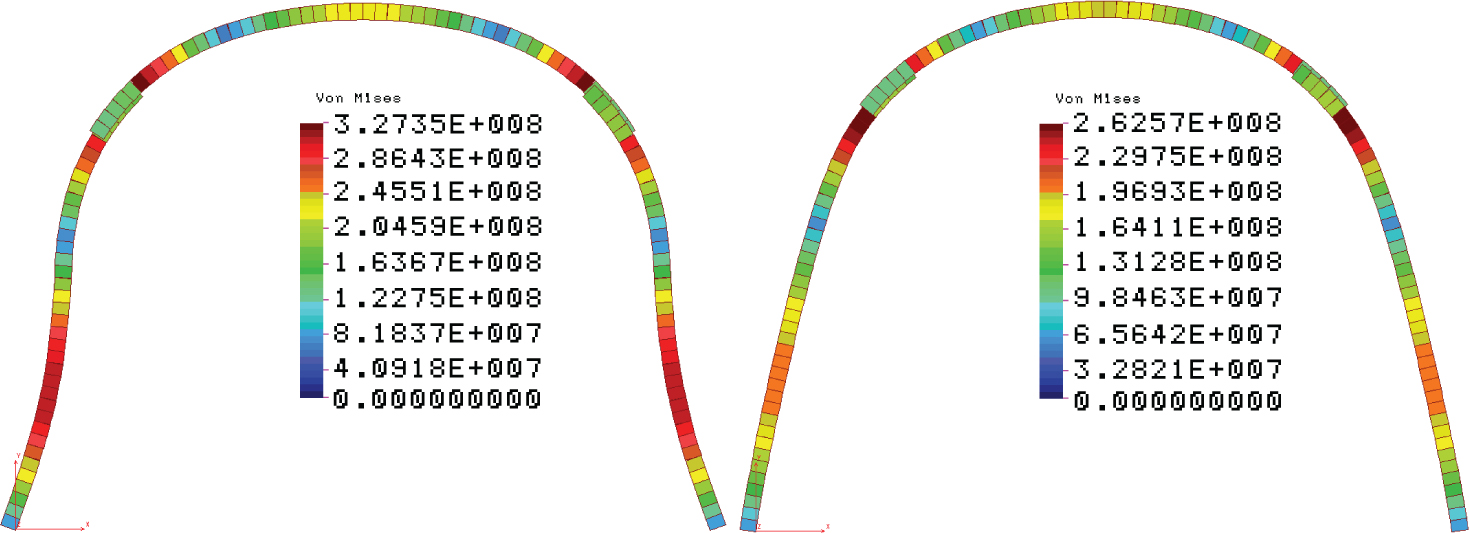
Figure 10
The map of reduced stresses in the A (left) and B and C (right) frames for load scheme III (qs = 0.1 MN/m, stresses in Pa, deformation scale 10×).
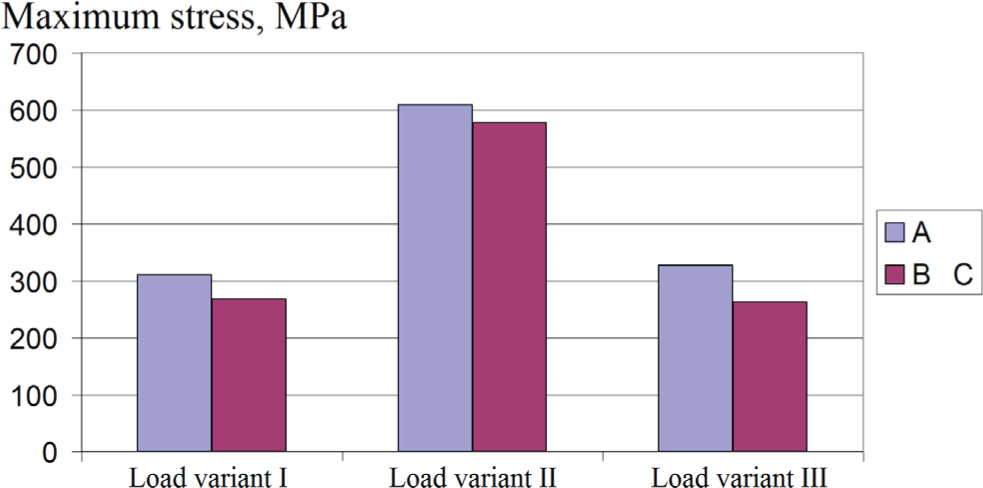
Figure 11
Comparison of maximum stresses in arch support A and B and C for different load patterns.
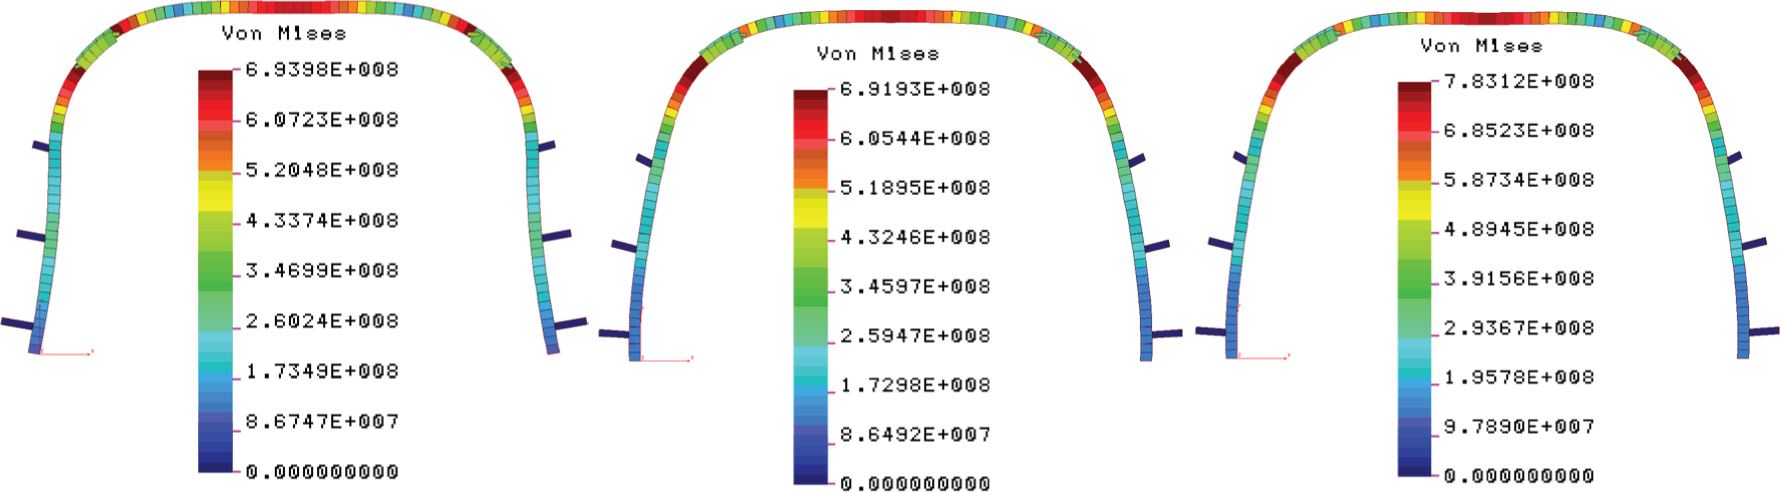
Figure 12
Map of reduced stresses in A (left), B (middle) and C (right) frames for load scheme – variant I (stresses in Pa, deformation scale 10×).
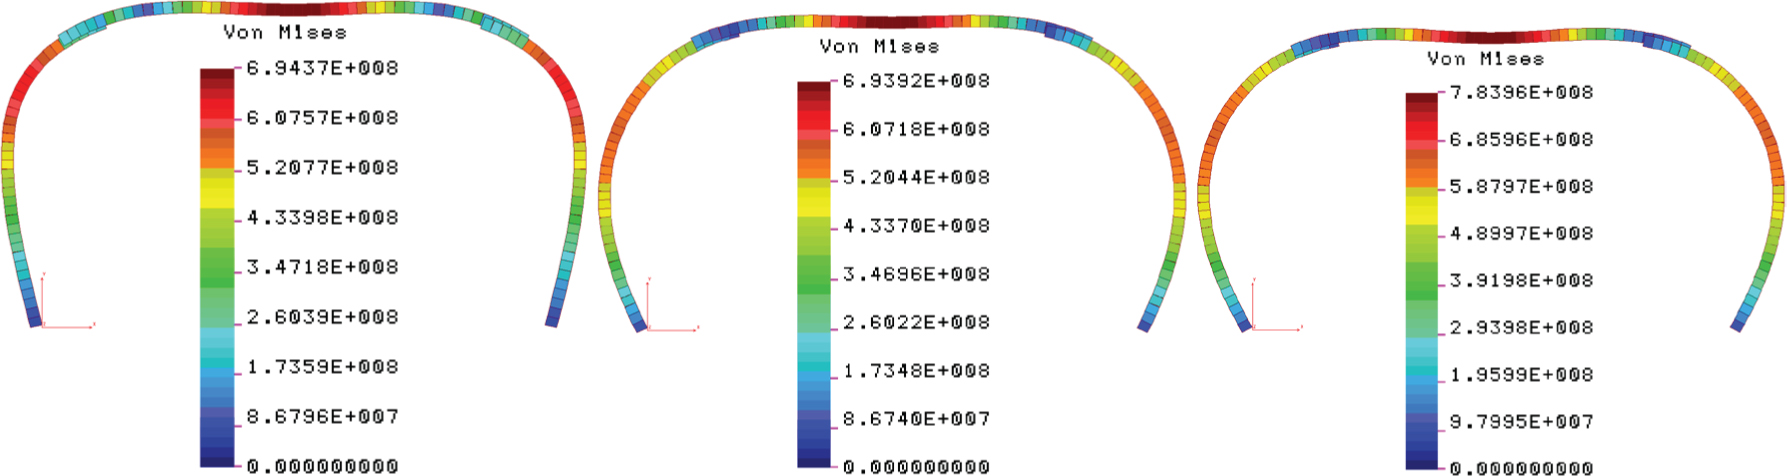
Figure 13
Map of reduced stresses in A (left), B (middle) and C (right) frames for load scheme – variant II (stresses in Pa, deformation scale 10×).
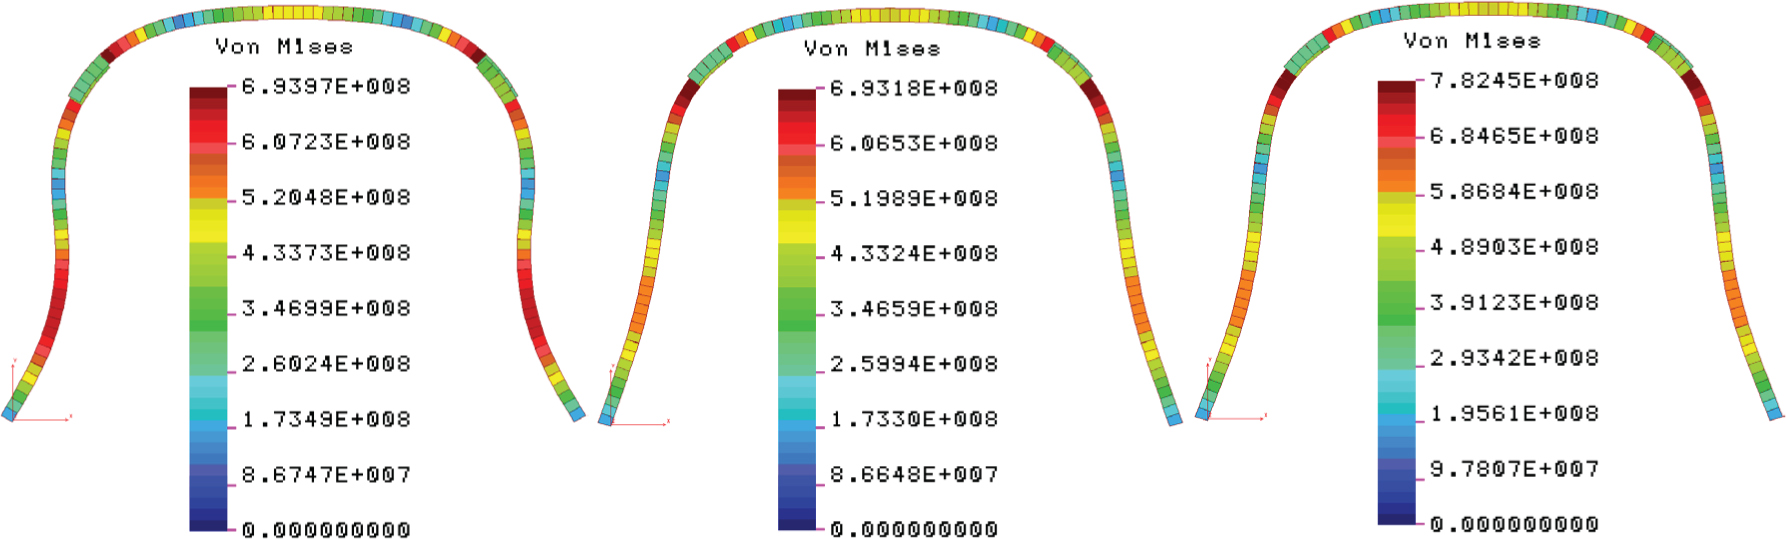
Figure 14
Map of reduced stresses in A (left), B (middle) and C (right) frames for load scheme – variant III (stresses in Pa, deformation scale 10×).
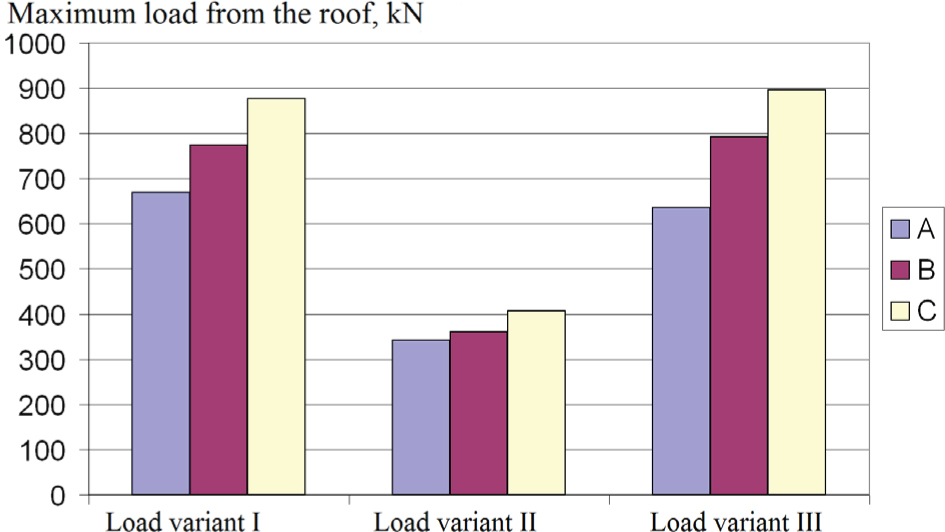
Figure 15
Comparison of the maximum load capacity of arch support A, B and C for different load patterns.
Table 6
Maximum load values transmitted by the arch support.
| Model designation | Load variant | |||||
|---|---|---|---|---|---|---|
| I (roof load + wall resistance) | II (roof load + no side wall resistance) | III (roof load + side load) | ||||
| A (current V36, S480W) | Fmax = 669 kN | 100% | Fmax = 342 kN | 100% | Fmax = 636 kN | 100% |
| B (proposed V36, S480W) | Fmax = 774 kN | 115% | Fmax = 360 kN | 105% | Fmax = 792 kN | 124% |
| C (proposed V36, S550W) | Fmax = 877 kN | 131% | Fmax = 407 kN | 119% | Fmax = 896 kN | 140% |