
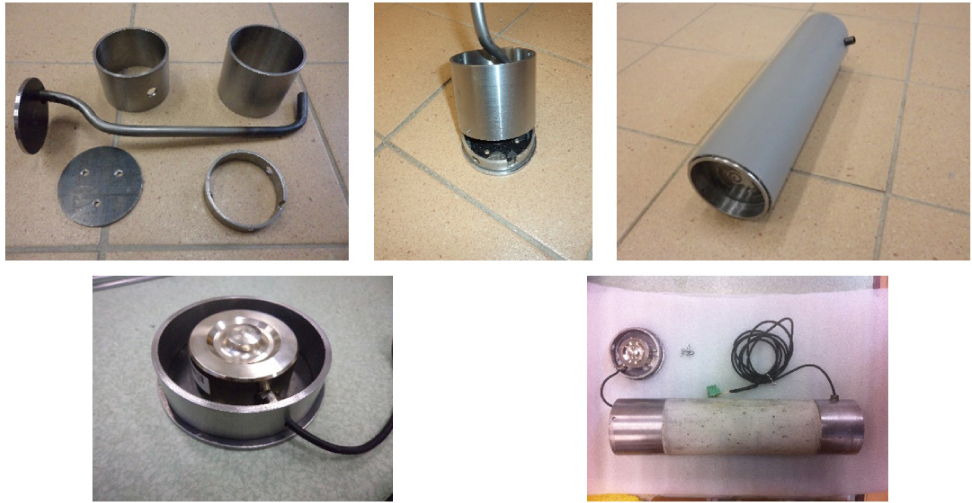
Figure 1
Components of instrumentation pile model.
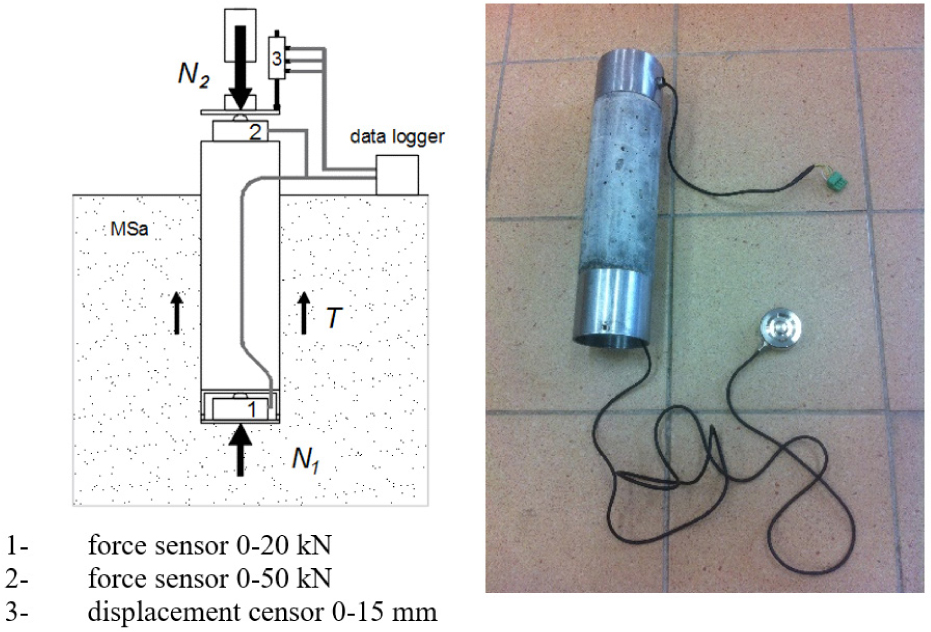
Figure 2
Simplified scheme of the laboratory instrumented pile.
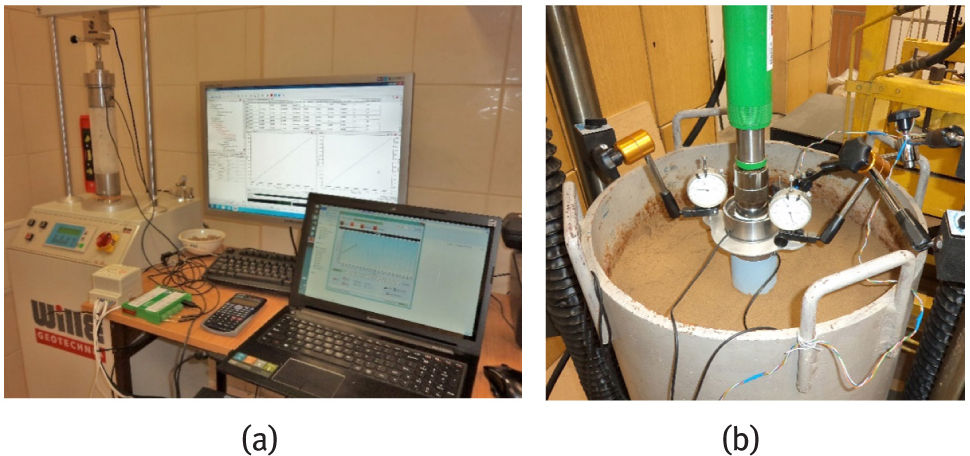
Figure 3
(a) Calibration of the model instrumented pile. (b) Pile prepared to static load test.
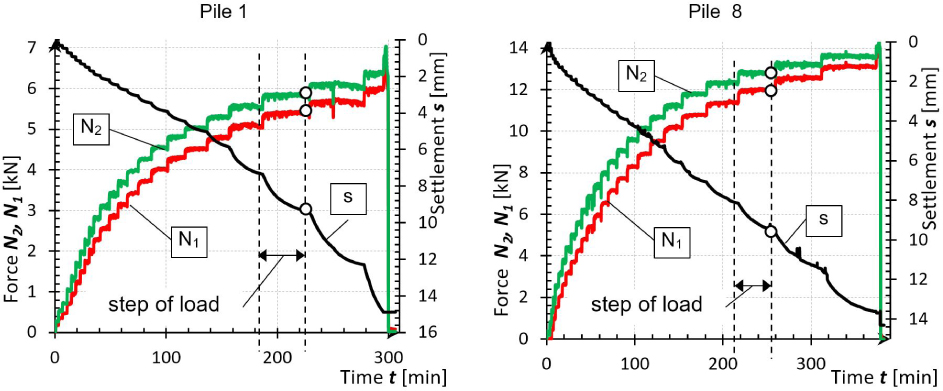
Figure 4
The results of static load tests of two model piles.
Table 1
Comparison of the M-K approximation of piles 1 and 8.
| No | Diameter D (m) | Depth H (m) | M-K approximation parameters | |||||
|---|---|---|---|---|---|---|---|---|
| C2 (mm/kN) | Ngr,2(kN) | κ2 (–) | C1 (mm/kN) | Ngr,1(kN) | κ1 (–) | |||
| 1 | 0.07 | 0.20 | 0.4317 | 6.66 | 0.332 | 0.5362 | 6.28 | 0.288 |
| 8 | 0.07 | 0.25 | 0.2079 | 14.69 | 0.348 | 0.28335 | 14.33 | 0.238 |
Table 2
Comparison of the M-K approximation of piles 1 and 8 in experiments.
| No | Diameter D (m) | Length H (m) | Approximation M-K | Calculation | ||||
|---|---|---|---|---|---|---|---|---|
| C2 (mm/kN) | Ngr,2(kN) | κ2 (–) | C1 (mm/kN) | Ngr,1(kN) | κ1 (–) | |||
| 1 | 0.07 | 0.20 | 0.4317 | 6.66 | 0.332 | 0.54848 | 6.59 | 0.275 |
| 8 | 0.07 | 0.25 | 0.2079 | 14.69 | 0.348 | 0.27192 | 14.48 | 0.288 |
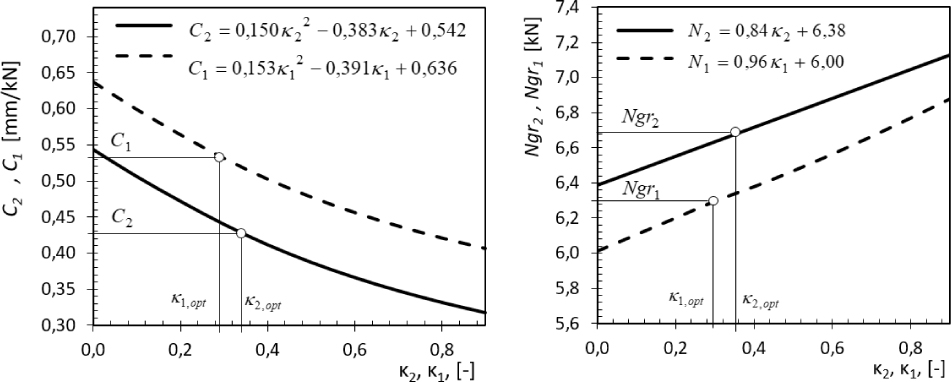
Figure 5
Relationship obtained during the M-K approximation for pile 1.
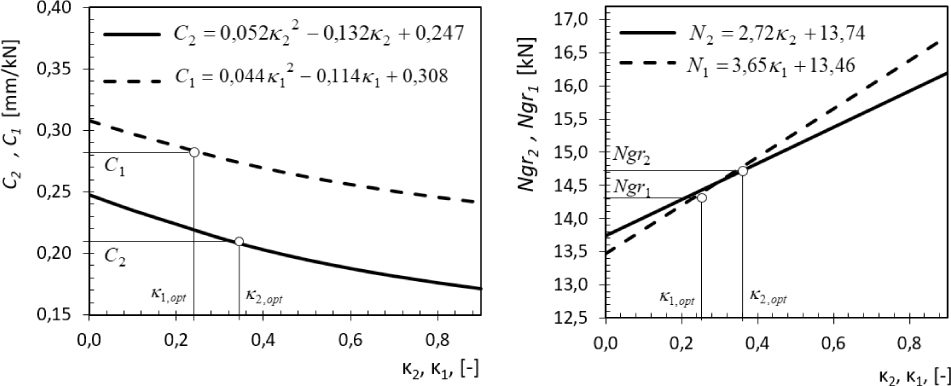
Figure 6
Relationship obtained during the M-K approximation for pile 8.
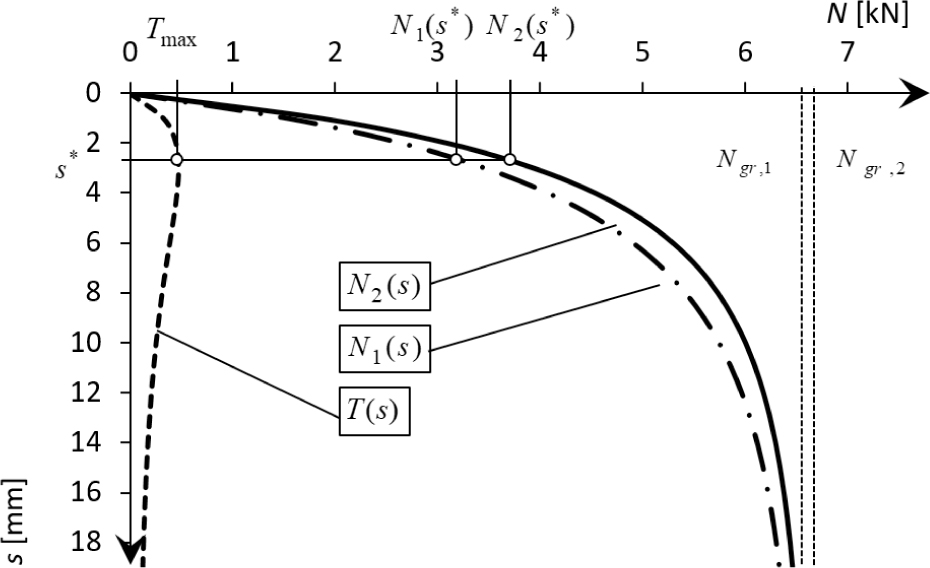
Figure 7
Calculated skin and toe resistance mobilisation following the settlement – pile 1.
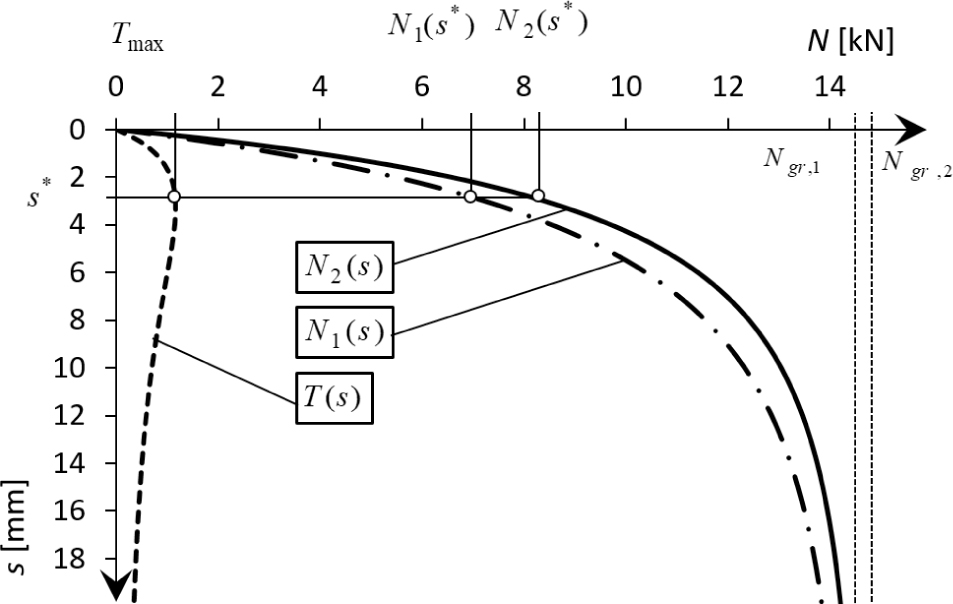
Figure 8
Calculated skin and toe resistance mobilisation following the settlement – pile 8