
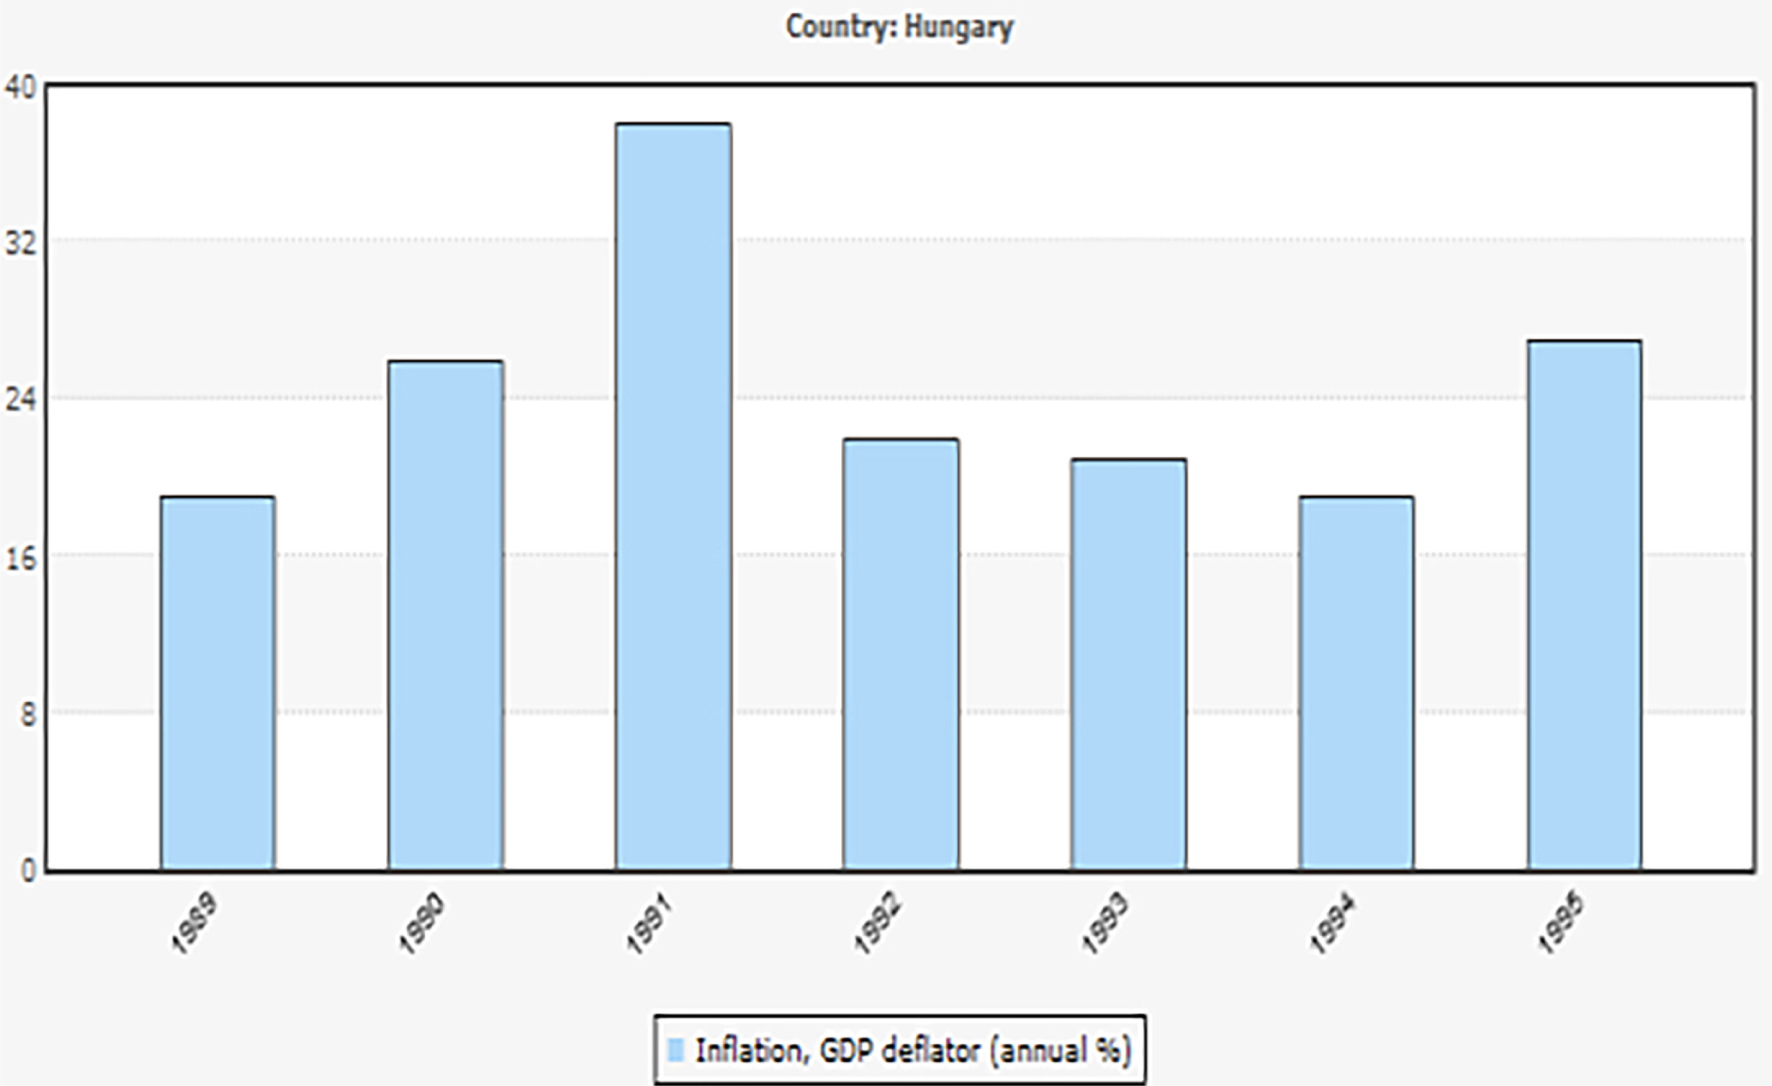
Figure 1.
Inflation, GDP deflator (annual %) 1990–1995.
Source: World Development Indicators (WDI) & Global Development Finance (GDF) 2018.
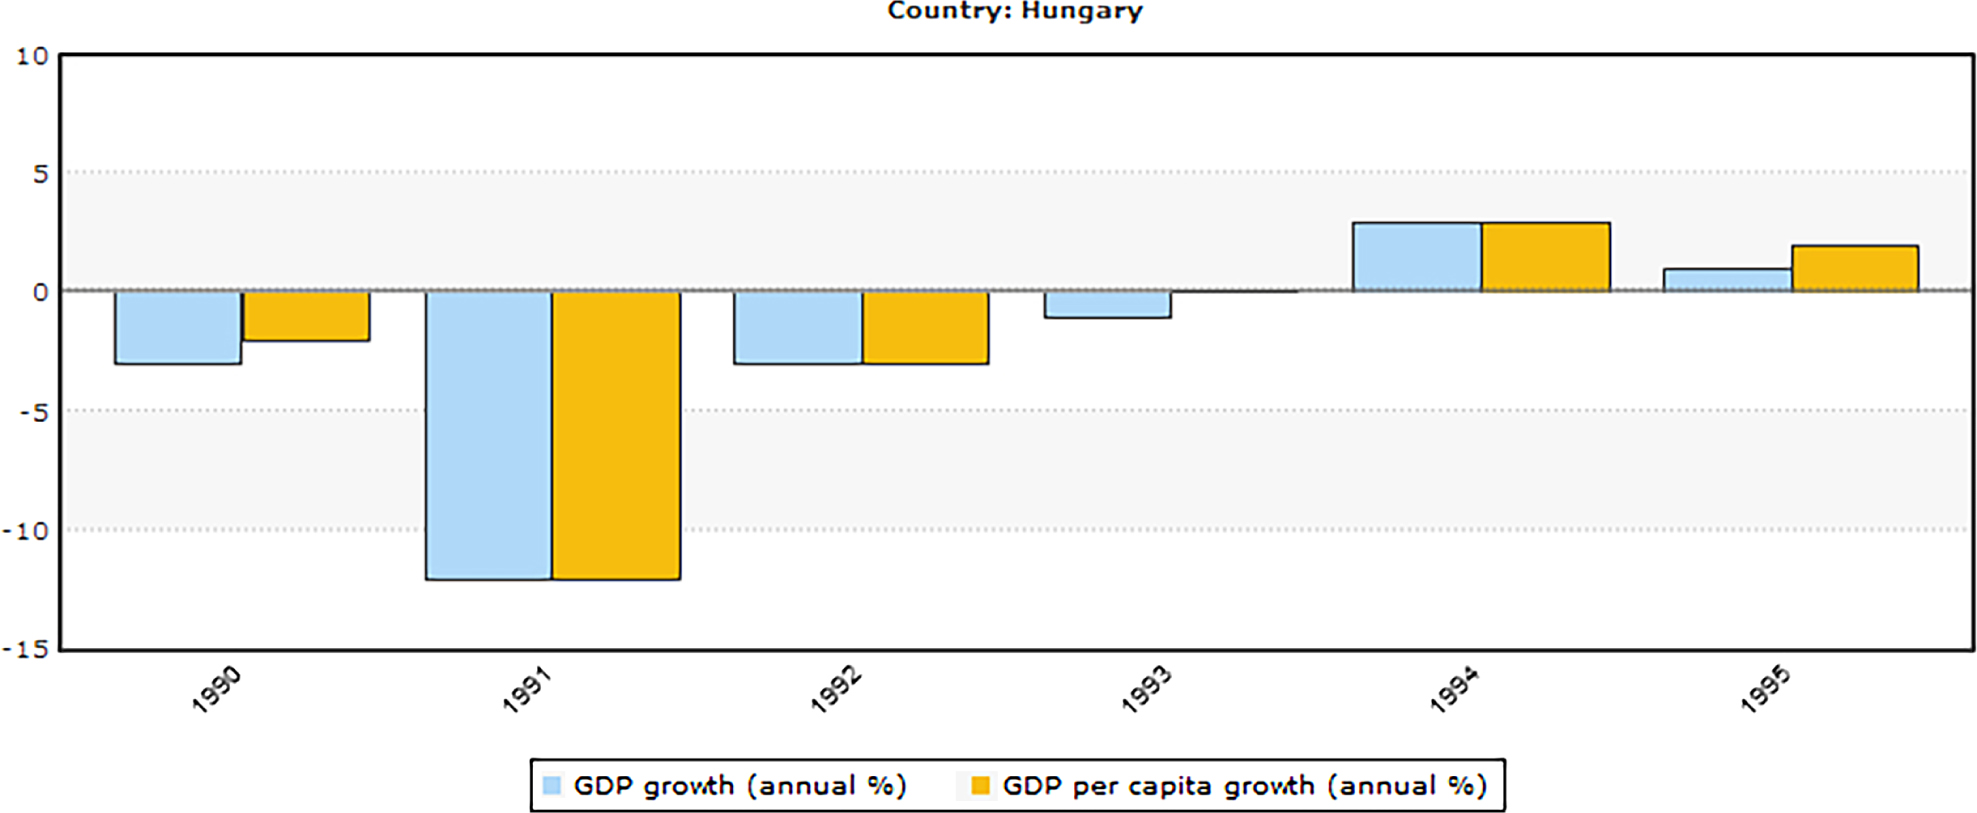
Figure 2.
GDP growth/GDP per capita annual growth 1990–1995.
Source: World Development Indicators (WDI) & Global Development Finance (GDF) 2018.
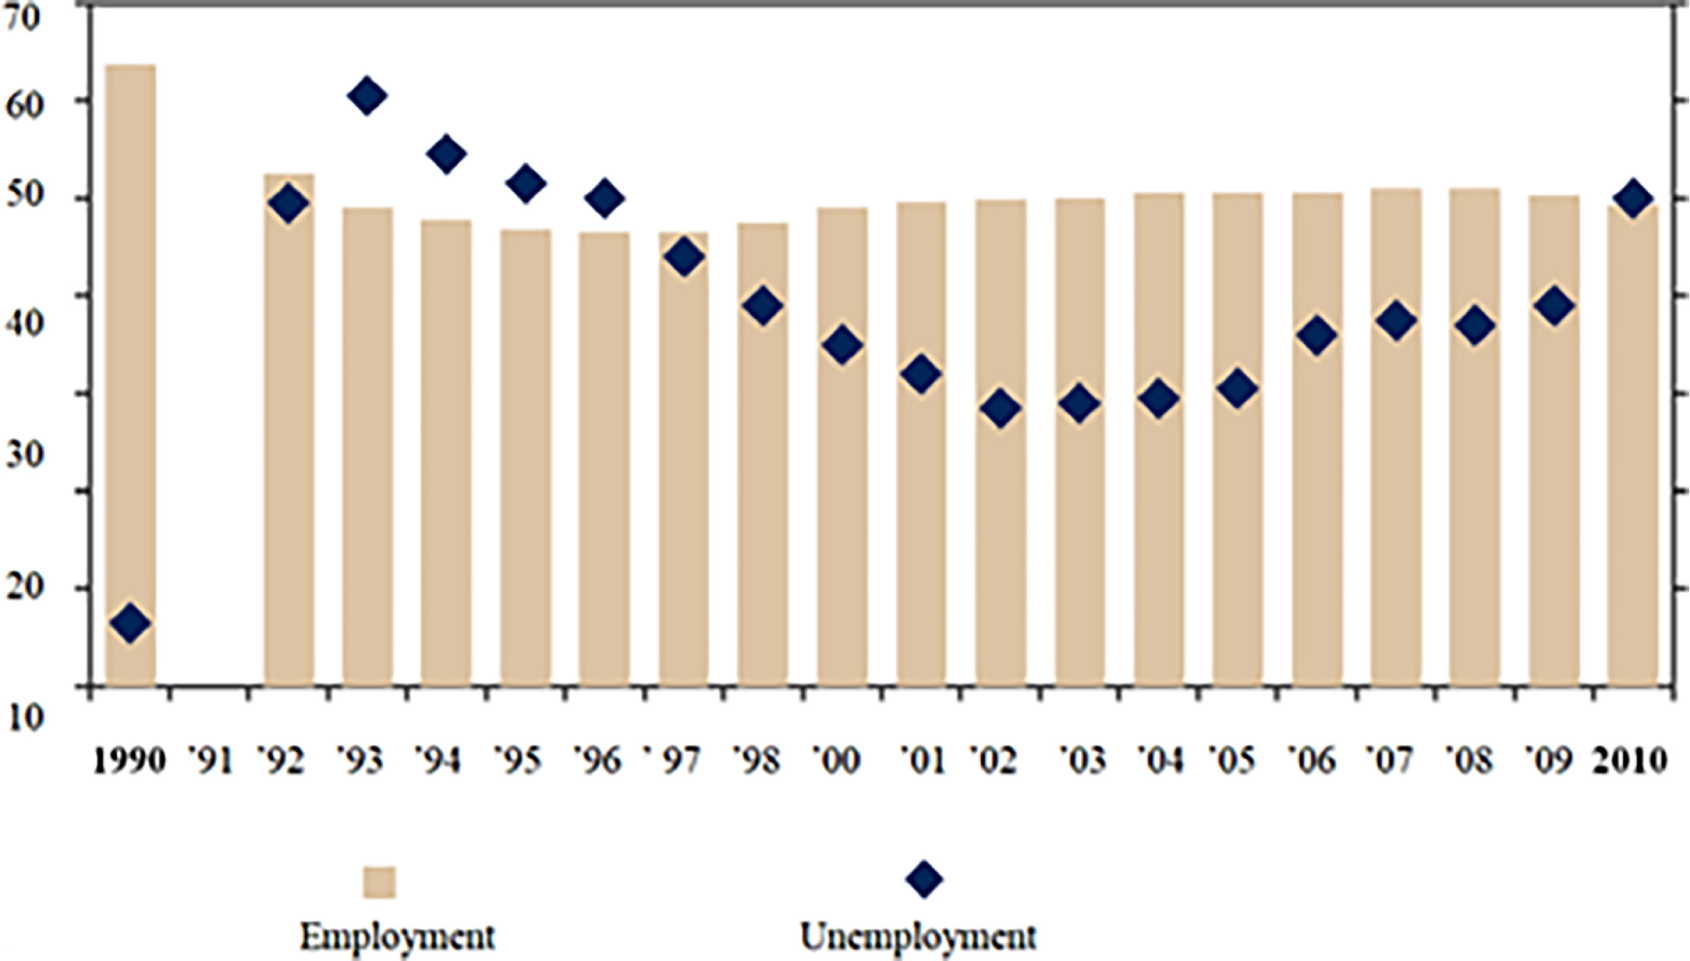
Figure 3.
Main labour market trends (within the population aged 15–74).
Source: Hungarian Central Statistical Office 2018.
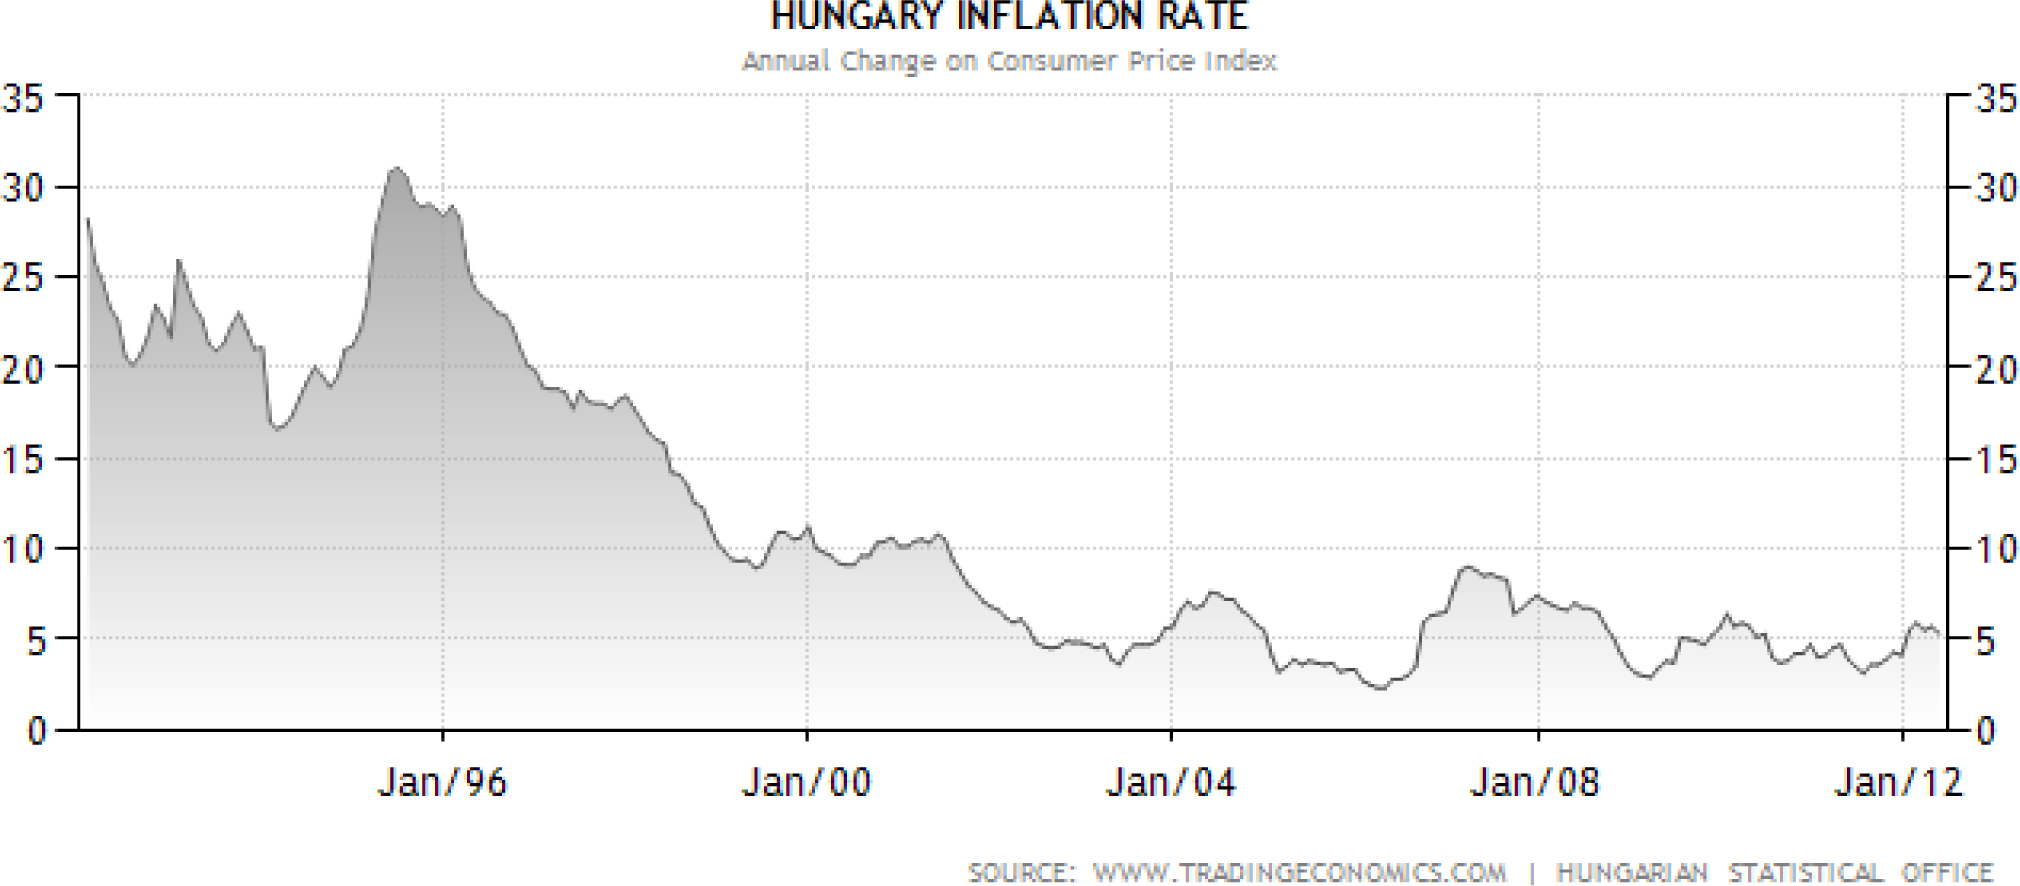
Figure 4.
Inflation rate 1992–2012.
Source: Trading Economics – Hungarian Central Statistical Office 2018.
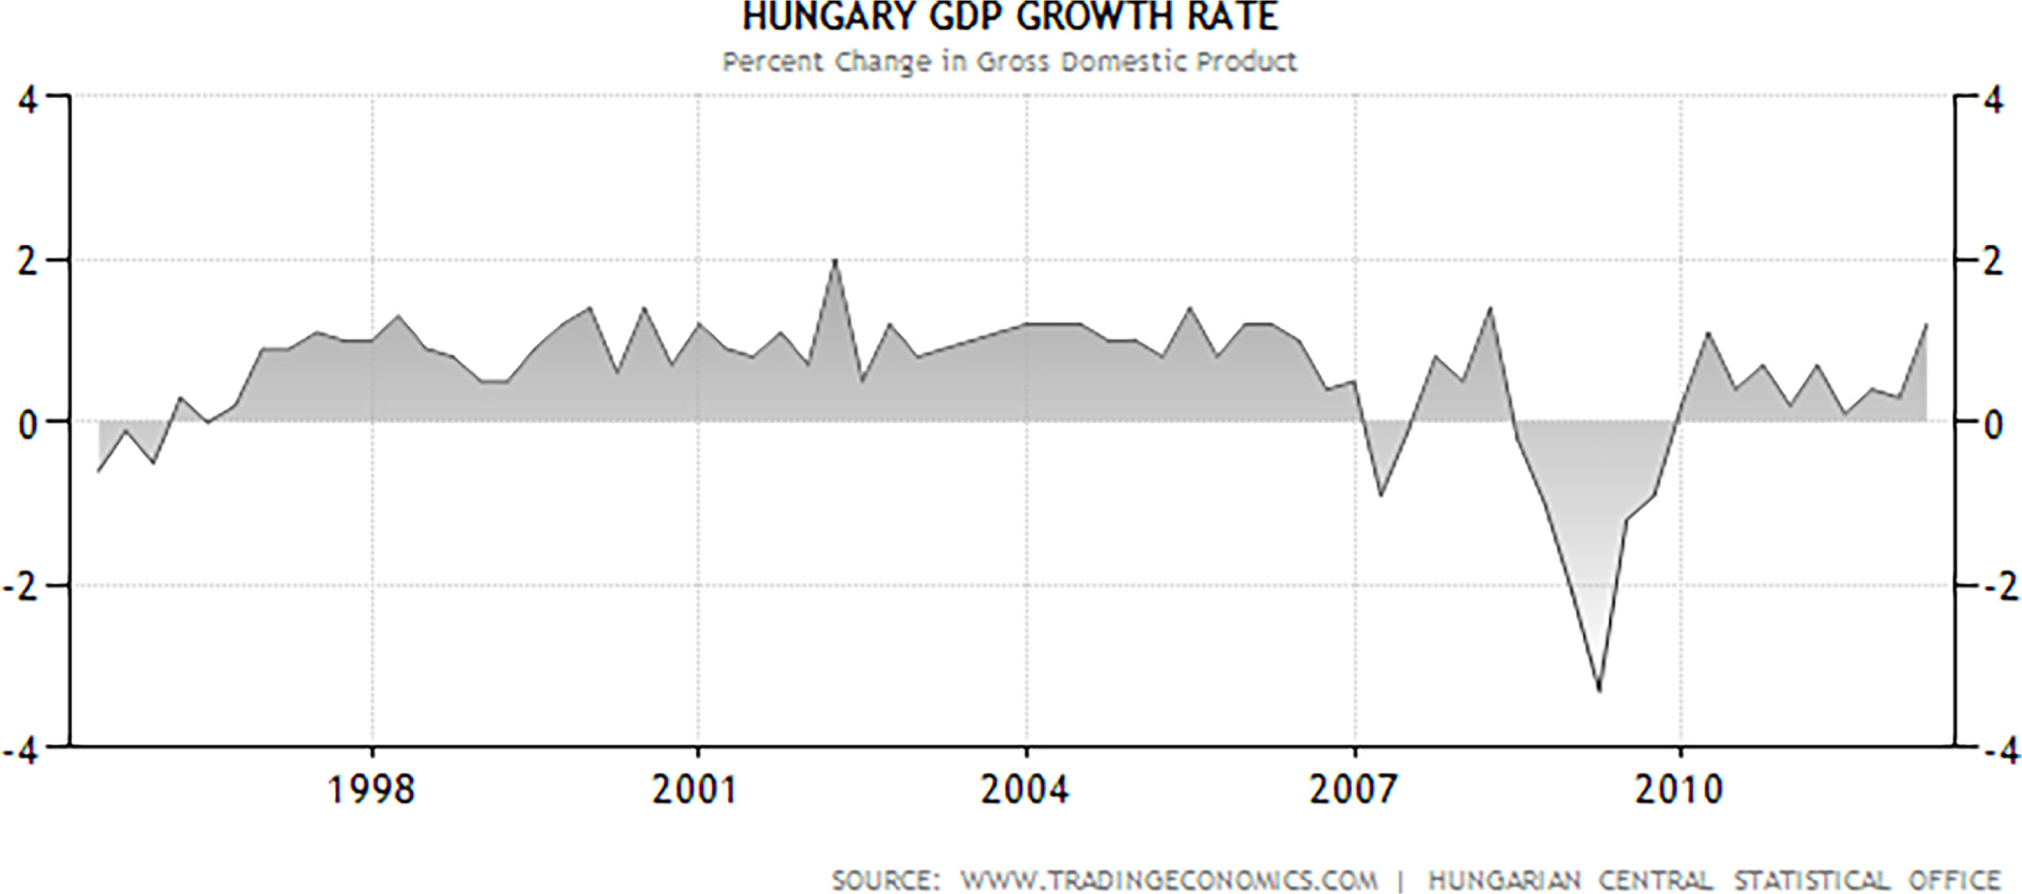
Figure 5.
GDP growth rate 1995–2012.
Source: Trading Economics – Hungarian Central Statistical Office 2018.
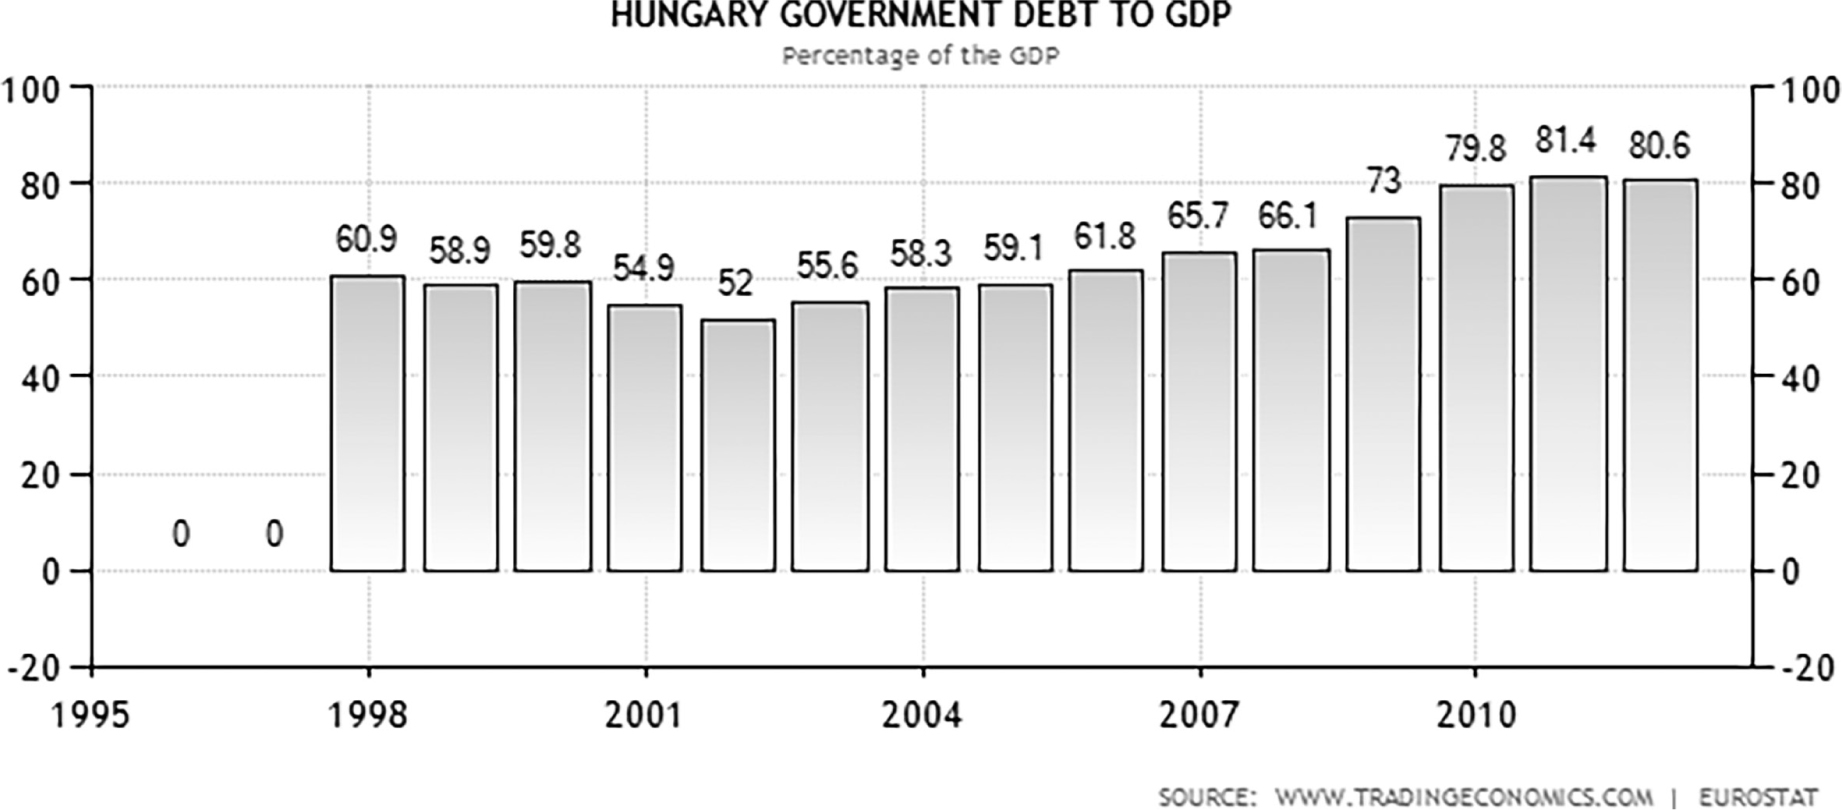
Figure 6.
Government debt to GDP 1995–2012.
Source: Trading Economics – Hungarian Central Statistical Office 2018.
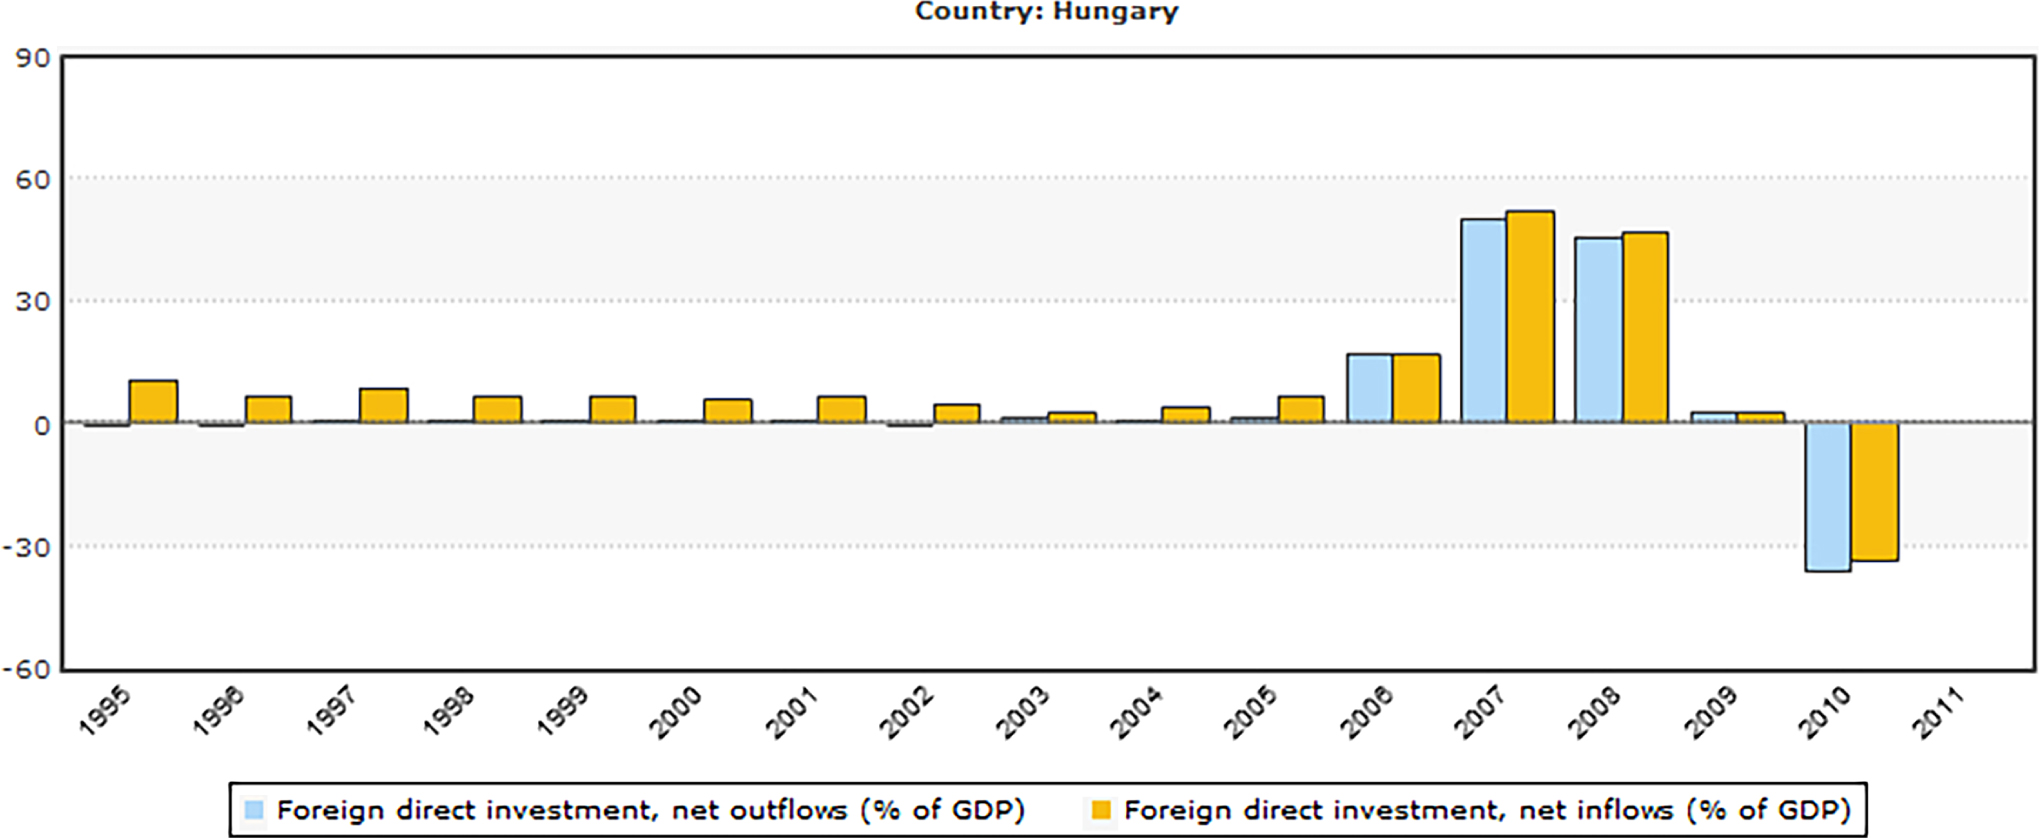
Figure 7.
FDI Net inflows/Net outflows.
Source: Trading Economics – Hungarian Central Statistical Office 2018.
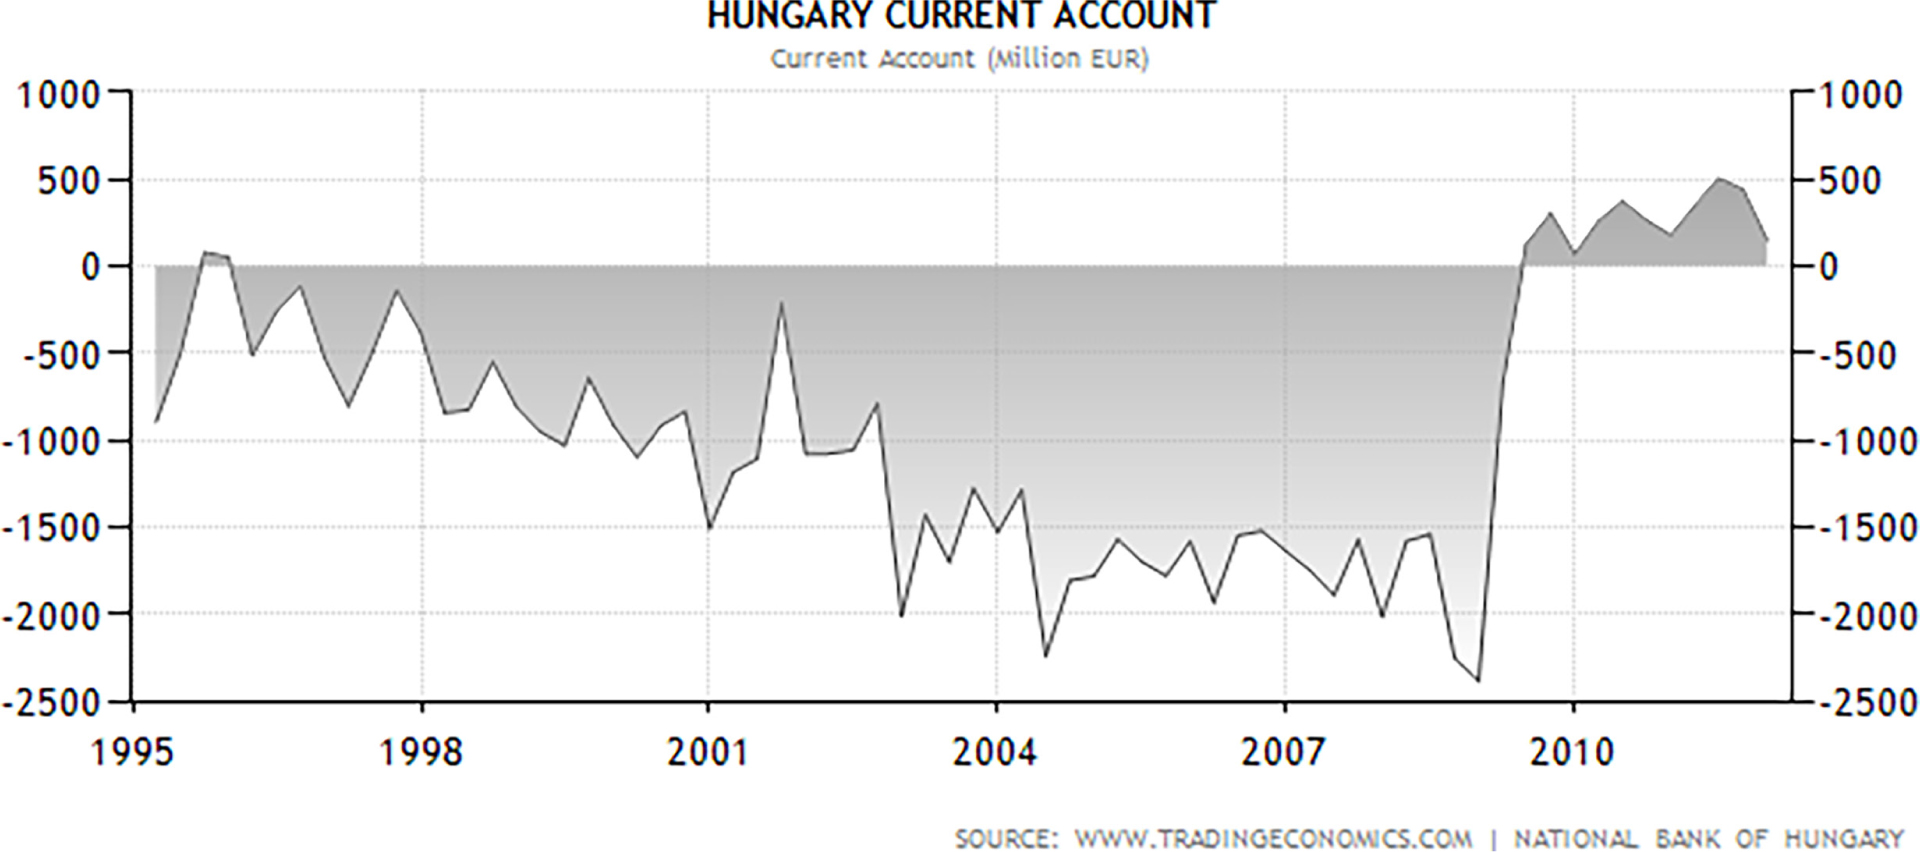
Figure 8.
Current account 1995–2012.
Source: Trading Economics – Hungarian Central Statistical Office 2018.
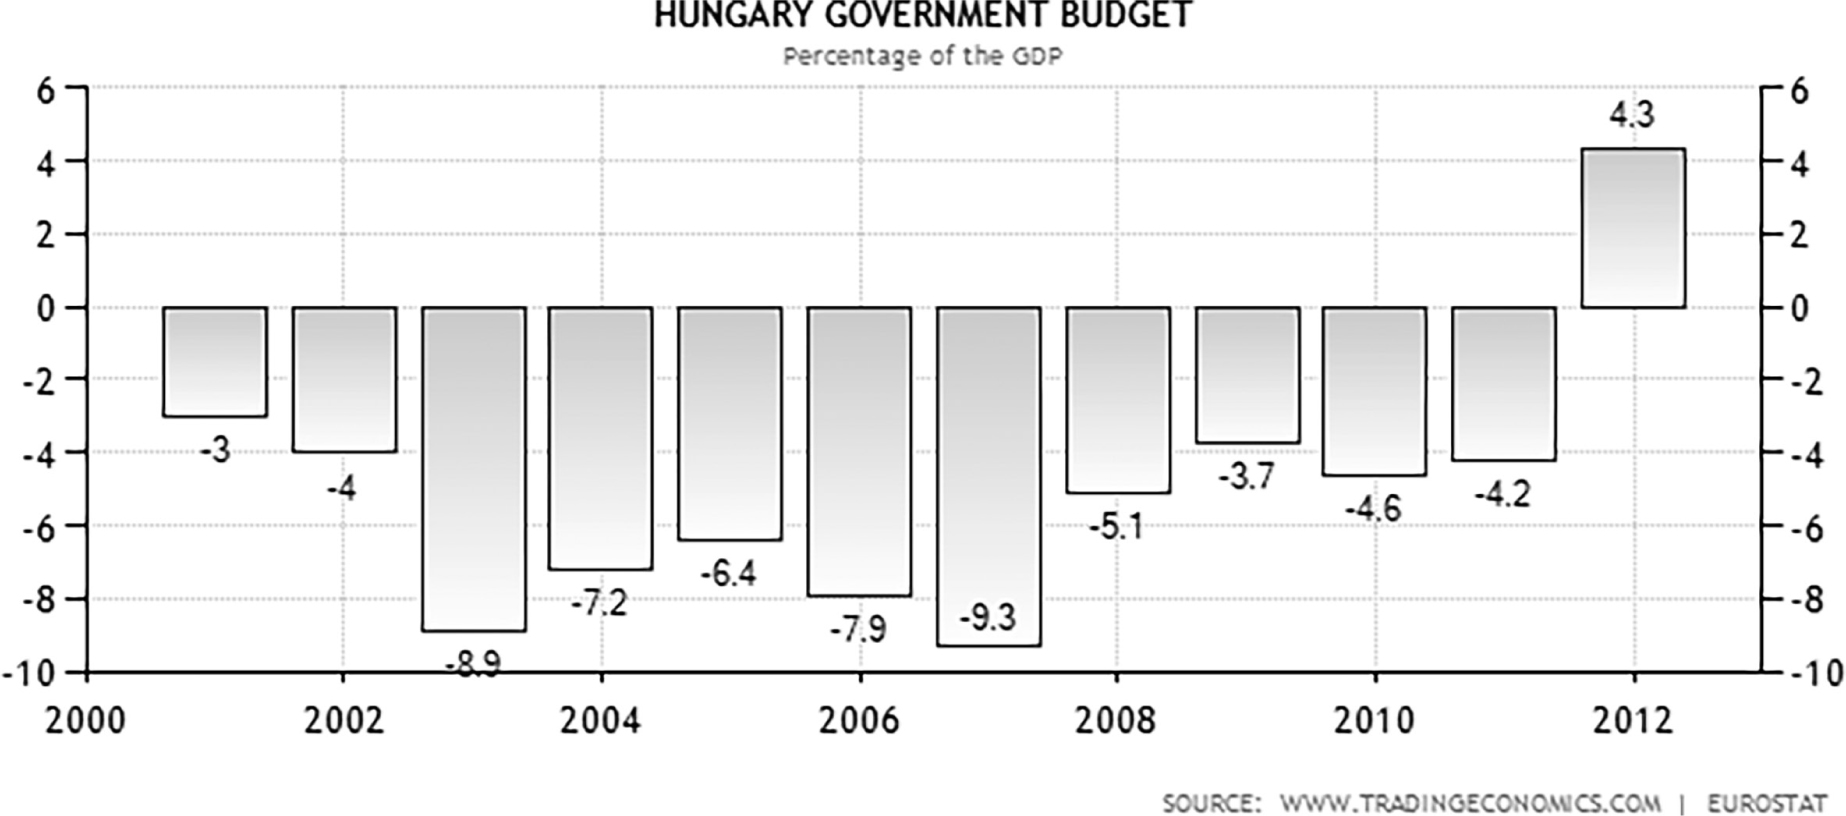
Figure 9.
Government budget.
Source: Trading Economics – Eurostat 2018.
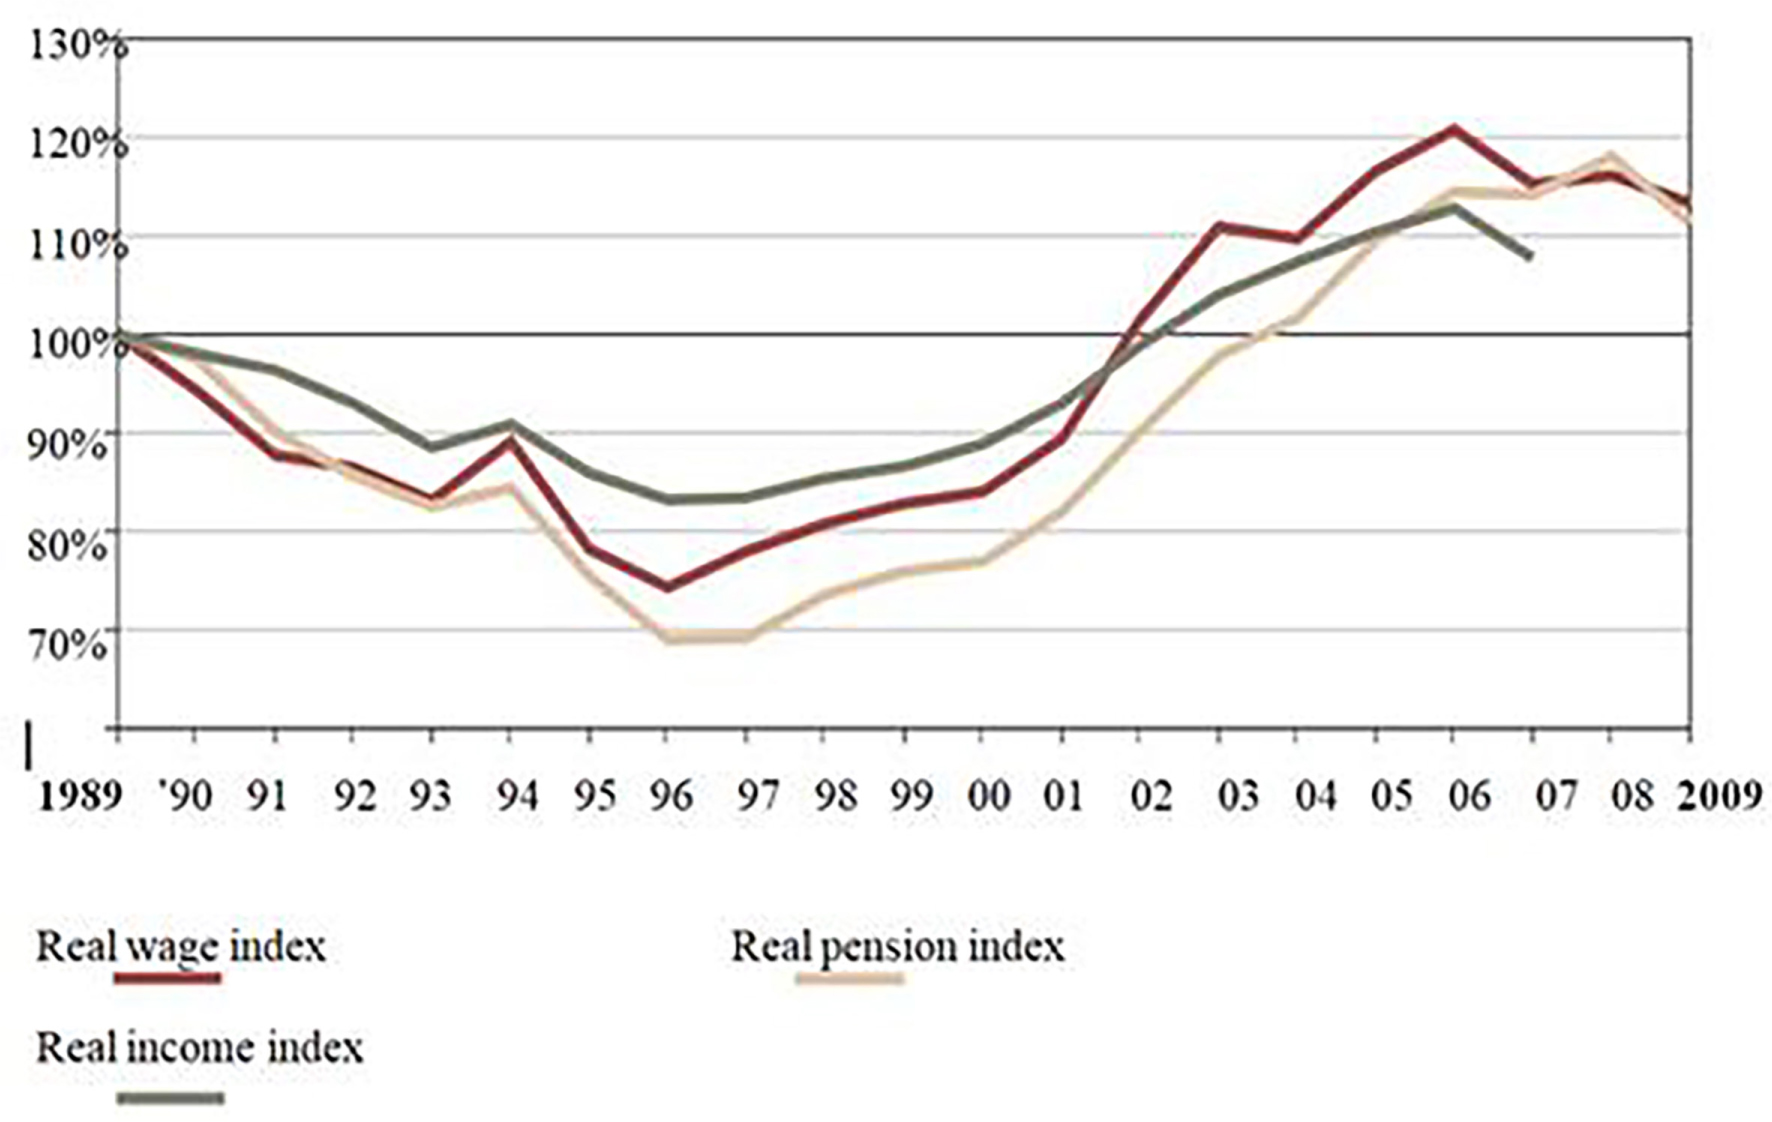
Figure 10.
Real wage index/Real pension index/Real income index 1989–2009.
Source: Trading Economics – Hungarian Central Statistical Office 2018.