
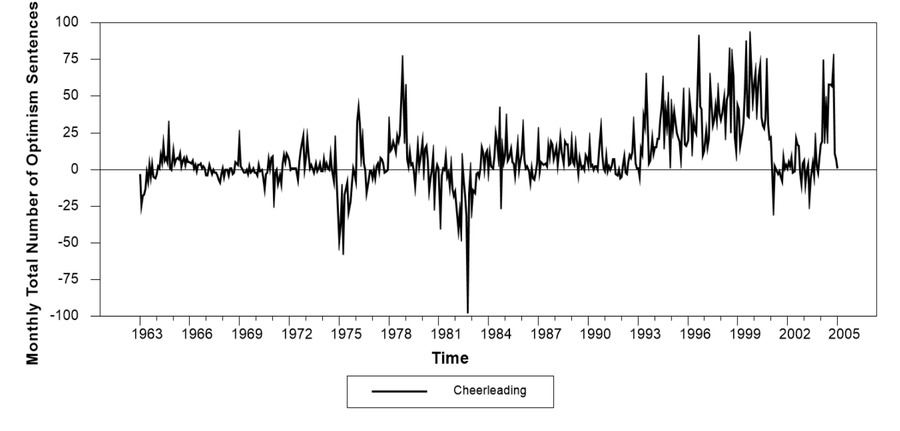
Figure 1
Monthly Time Series of Presidential Cheerleading Rhetoric
Source: Wood (2007)
Table 1
Engle-Granger Cointegration Diagnostic Test Results
| Model | Engle- Granger Test A | Engle- Granger Test B | Engle- Granger Test C | Engle- Granger Test D | Engle-Granger Test E |
|---|---|---|---|---|---|
| Hypothesis #1 Housing Units Started Model | # of lags: 5 test statistic: -2.77249 critical value .01: -4.68391 critical value .05: -4.12158 critical value .10: -3.82765 | # of lags: 6 test statistic: -2.76547 critical value .01: -4.68398 critical value .05: -4.12162 critical value .10: -3.82769 | # of lags: 7 test statistic: -2.66696 critical value .01: -4.68405 critical value .05: -4.12166 critical value .10: -3.82772 | # of lags: 8 test statistic: -2.71127 critical value .01: -4.68412 critical value .05: -4.12171 critical value .10: -3.82776 | # of lags: 9 test statistic: -2.54841 critical value .01: -4.68419 critical value .05: -4.12175 critical value .10: -3.82779 |
| Hypothesis #2 Housing Units Sold Model | # of lags: 1 test statistic: -3.45775 critical value .01: -4.68364 critical value .05: -4.12140 critical value .10: -3.82752 | # of lags: 2 test statistic: -3.16364 critical value .01: -4.68370 critical value .05: -4.12145 critical value .10: -3.82756 | # of lags: 3 test statistic: -2.86077 critical value .01: -4.68377 critical value .05: -4.12149 critical value .10: -3.82759 | # of lags: 4 test statistic: -2.81743 critical value .01: -4.68384 critical value .05: -4.12153 critical value .10: -3.82762 | # of lags: 5 test statistic: -2.75976 critical value .01: -4.68391 critical value .05: -4.12158 critical value .10: -3.82765 |
Table 2
Vector Autogression Granger Tests Results for Hypothesis #1
| Independent Variable | Dependent Variable | p-value (F-statistic) |
|---|---|---|
| Misery Index → | Misery Index | .00 (357.0578) |
| Presidential Approval → | .00 (3.2188) | |
| New Housing Units Started → | .00 (3.2894) | |
| Presidential Cheerleading | .51 (0.9114) | |
| Misery Index | Presidential Approval | .23 (1.3237) |
| Presidential Approval → | .00 (251.8371) | |
| New Housing Units Started → | .01 (2.5116) | |
| Presidential Cheerleading | .19 (1.4037) | |
| Misery Index → | New Housing Units Started | .01 (2.7764) |
| Presidential Approval | .89 (0.4550) | |
| New Housing Units Started → | .00 (131.2485) | |
| Presidential Cheerleading | .57 (0.8387) | |
| Misery Index | Presidential Cheerleading | .65 (0.7518) |
| Presidential Approval | .71 (0.6791) | |
| New Housing Units Started → | .03 (2.1219) | |
| Presidential Cheerleading → | .00 (11.4611) |
[i] Source: Original data analysis using WinRats Standard
Note: Arrows in table represent Granger-causality from the block of coefficients for the independent variable to the dependent variable using a .10 level of significance. The p-value results are from F-tests for a null hypothesis of no Granger-causality. The system includes a deterministic constant, as well as exogenous control indicators for recessions, the start of military conflicts in Lebanon, Grenada, Iraq in 1990, Iraq in 2003, the September 11th terrorist attacks, presidential and congressional midterm elections, and unique presidential administrations. For the sake of space and clarity, the results for the exogenous controls are not included here. Each of the independent variables in the endogenous system include eight monthly lags to control for the inertia of variables. Lag length is selected by Akaike Information Criterion.
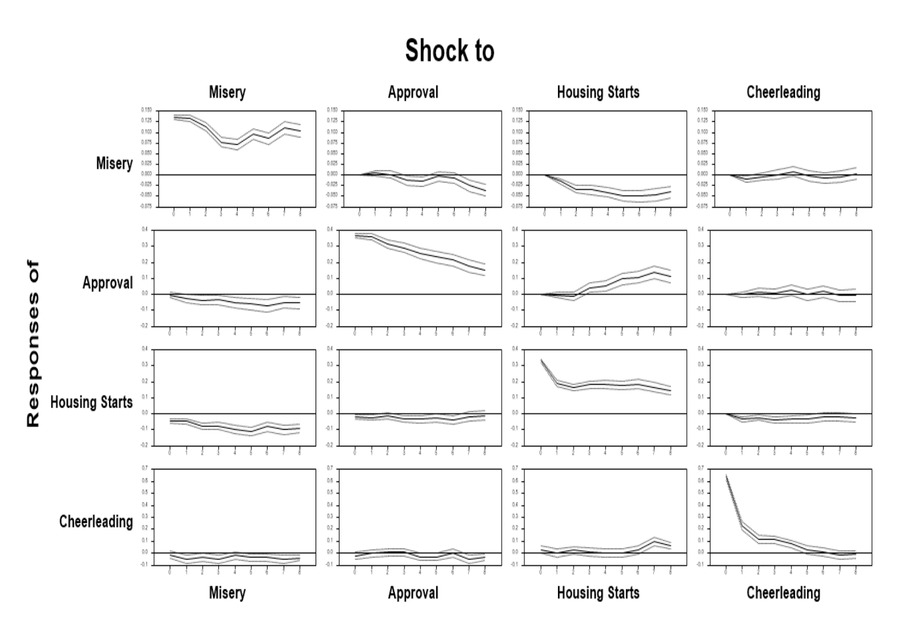
Figure 2
Moving Average Representation Responses for Hypothesis #1
Source: Original data analysis using WinRats Standard
Note: Dashed lines represent the 95% confidence interval, while the solid line inside the confidence interval represents the estimated standard deviation change in a variable.
Table 3
Vector Autogression Granger Tests Results for Hypothesis #2
| Independent Variable | Dependent Variable | p-value (F-statistic) |
|---|---|---|
| Misery Index → | Misery Index | .00 (1331.60) |
| Presidential Approval → | .01 (4.5617) | |
| New Housing Units Sold → | .08 (2.5886) | |
| Presidential Cheerleading | .33 (1.0988) | |
| Misery Index | Presidential Approval | .19 (1.6584) |
| Presidential Approval → | .00 (1035.14) | |
| New Housing Units Sold | .72 (0.3320) | |
| Presidential Cheerleading | .88 (0.1330) | |
| Misery Index → | New Housing Units Sold | .01 (4.7805) |
| Presidential Approval | .82 (0.1993) | |
| New Housing Units Sold → | .00 (511.4461) | |
| Presidential Cheerleading | .41 (0.8826) | |
| Misery Index | Presidential Cheerleading | .31 (1.1685) |
| Presidential Approval | .67 (0.3968) | |
| New Housing Units Sold → | .00 (6.0031) | |
| Presidential Cheerleading → | .00 (49.5154) |
[i] Source: Original data analysis using WinRats Standard
Note: Arrows in table represent Granger-causality from the block of coefficients for the independent variable to the dependent variable using a .10 level of significance. The p-value results are from F-tests for a null hypothesis of no Granger-causality. The system includes a deterministic constant, as well as exogenous control indicators for recessions, the start of military conflicts in Lebanon, Grenada, Iraq in 1990, Iraq in 2003, the September 11th terrorist attacks, presidential and congressional midterm elections, and unique presidential administrations. For the sake of space and clarity, the results for the exogenous controls are not included here. Each of the independent variables in the endogenous system include two monthly lags to control for the inertia of variables. Lag length is selected by Akaike Information Criterion.
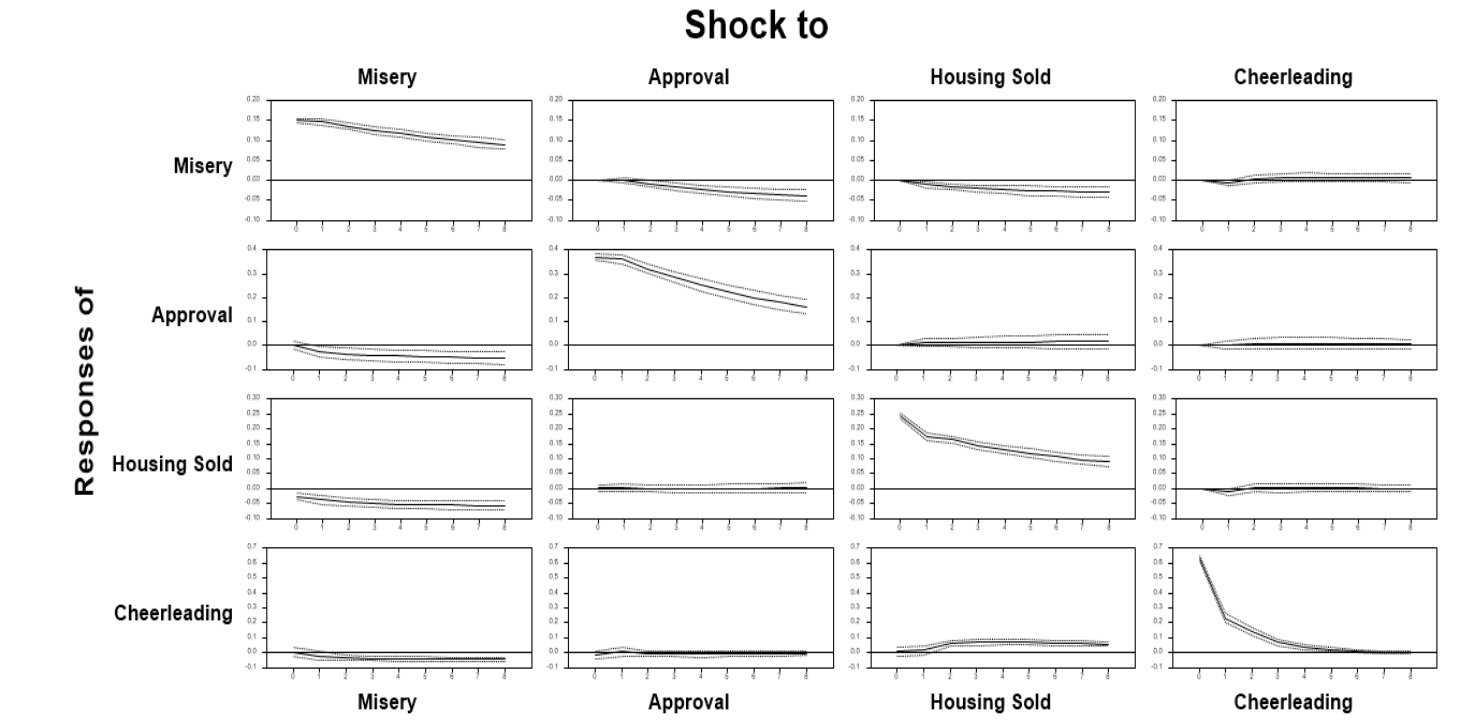
Figure 3
Moving Average Representation Responses for Hypothesis #2
Source: Original data analysis using WinRats Standard
Note: Dashed lines represent the 95% confidence interval, while the solid line inside the confidence interval represents the estimated standard deviation change in a variable.