
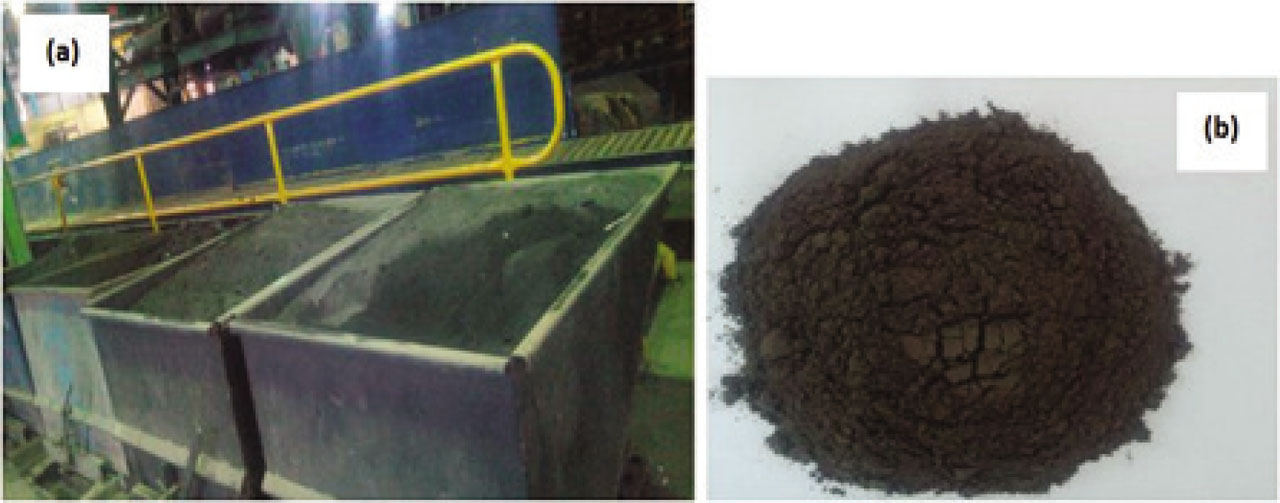
Figure 1:
Foundry sand wastes used in this work: (a) rejected zone, (b) FSW as sand.
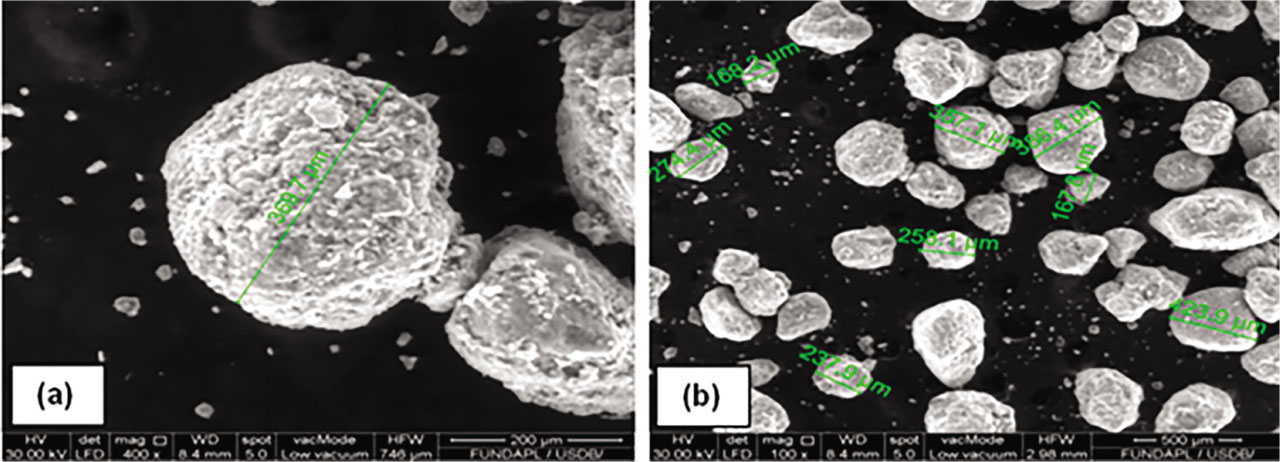
Figure 2:
SEM images of used foundry sand waste: (a) at 400x magnitude, (b) at 100x magnitude.
Table 1:
Chemical analysis of foundry sand wastes.
| Compounds | CaO | SiO2 | Al2O3 | Fe2O3 | SO3 | Na2O | K2O | MgO | P2O5 |
|---|---|---|---|---|---|---|---|---|---|
| (%) | 6.328 | 60.762 | 11.688 | 9.642 | 1.851 | 0.010 | 1.281 | 2.195 | 0.010 |
Table 2:
Physical properties of natural sand and foundry sand wastes.
| Natural Sand NS | Foundry Sand Wastes FSW | |
|---|---|---|
| Apparent density (kg/m3) | 3150 | 1240 |
| Specific gravity (kg/m3) | 2760 | 2400 |
| Fineness modulus | 2 | 2.47 |
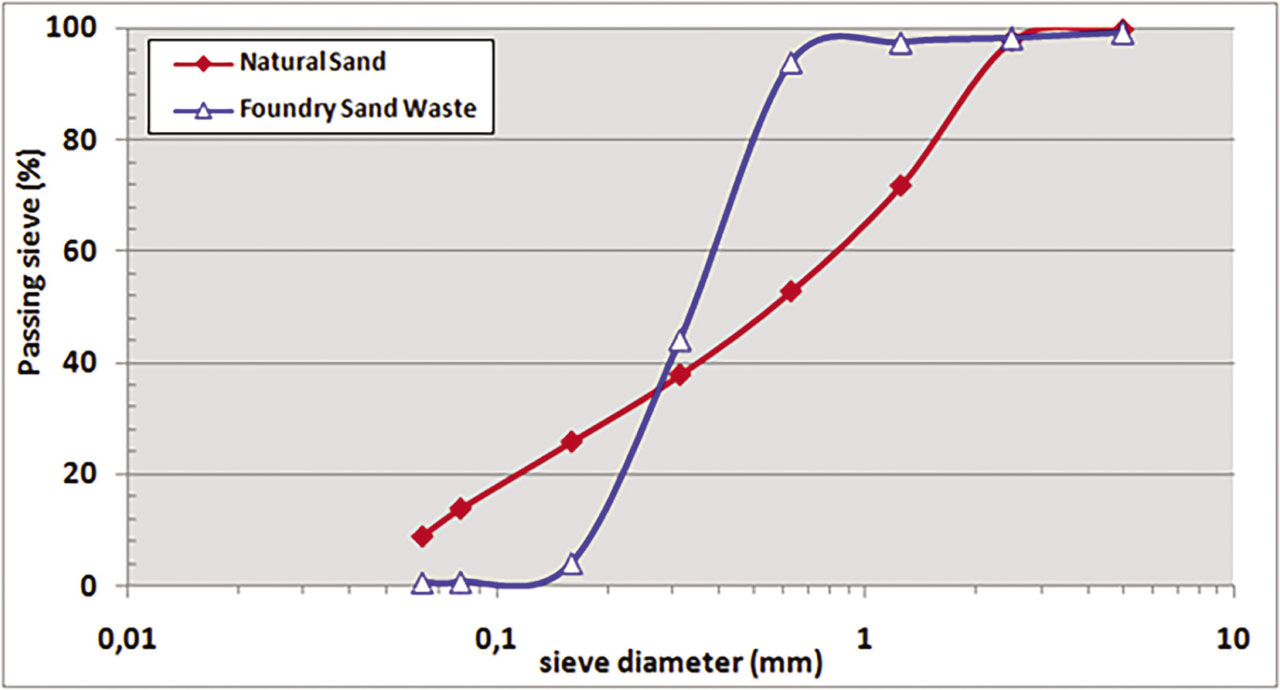
Figure 3:
Particle size distribution of natural sand and foundry sand wastes.
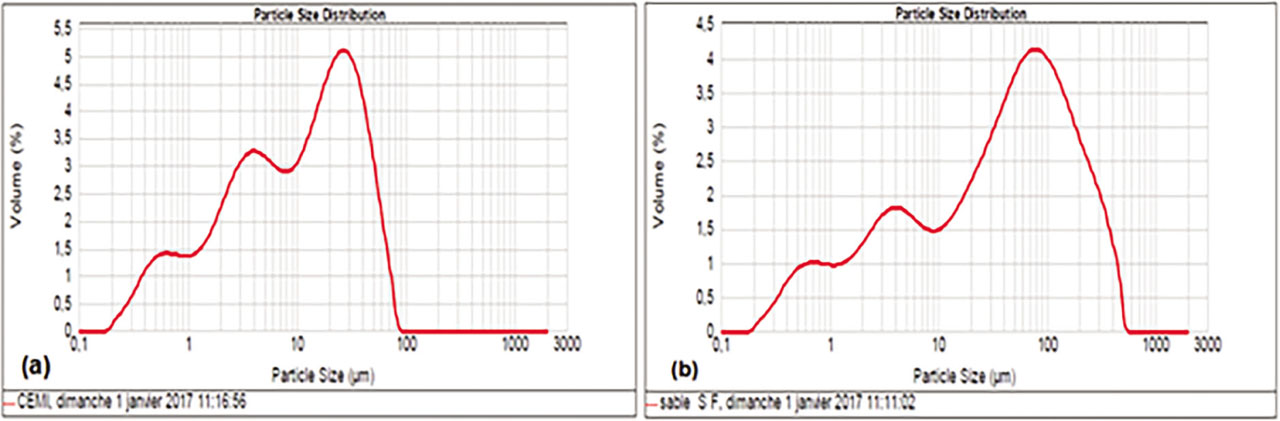
Figure 4:
Particle size distribution of cement and crushed foundry sand in volume fraction obtained by Laser Granulometry: (a) cement, (b) crushed foundry sand waste.
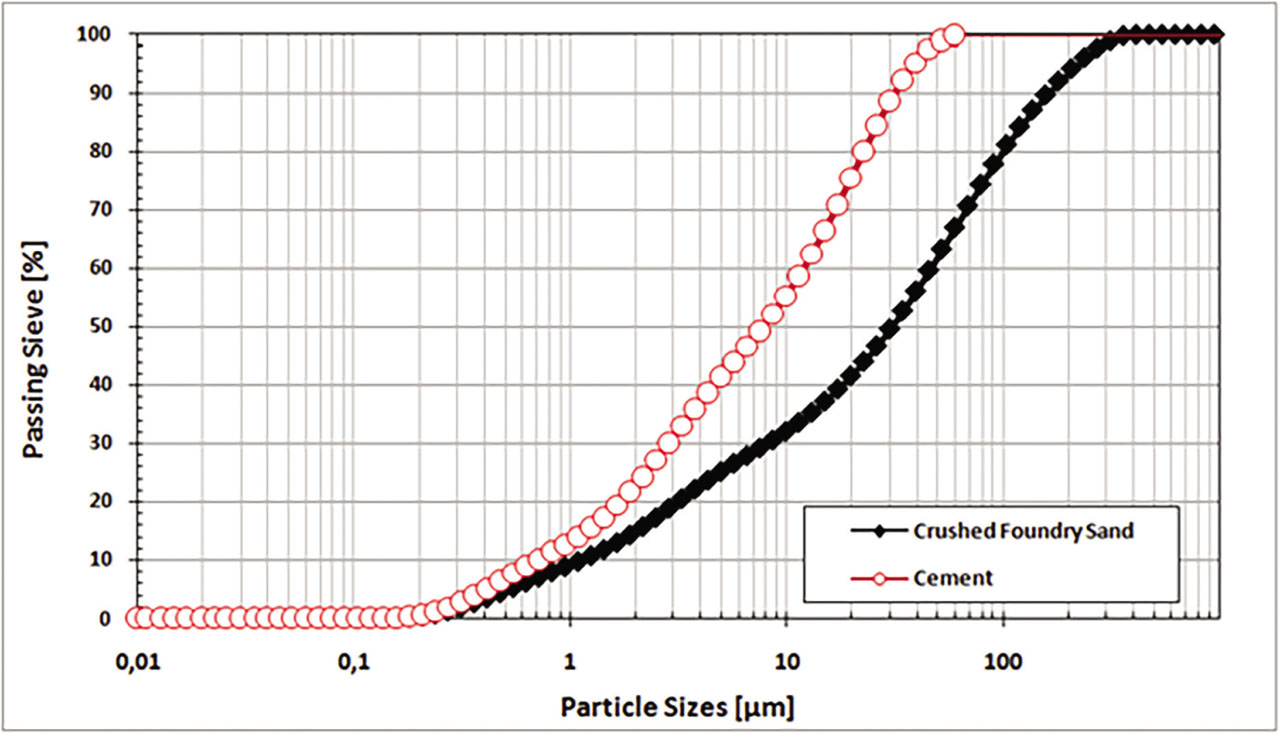
Figure 5:
Particle size distribution of cement and crushed foundry sand waste.
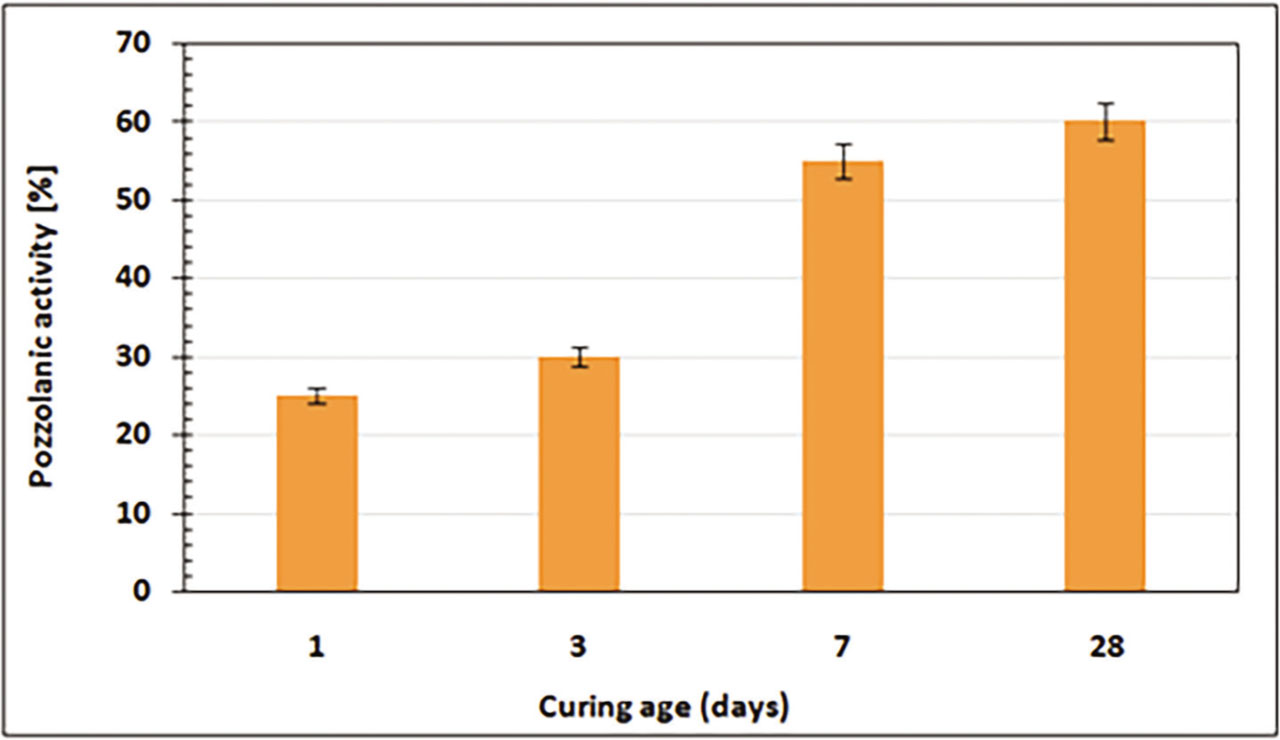
Figure 6:
Pozzolanic activity of FSW obtained by the saturated lime test.
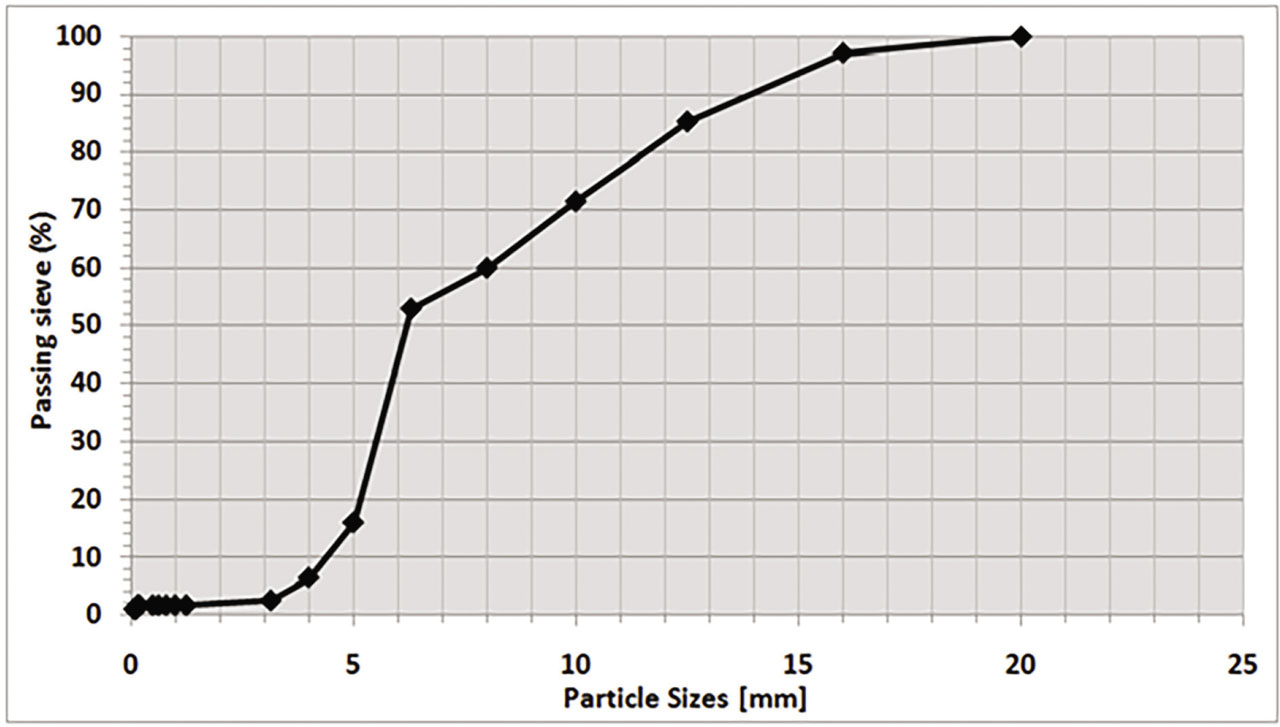
Figure 7:
Particle size analysis by sieving of gravel 8/16.
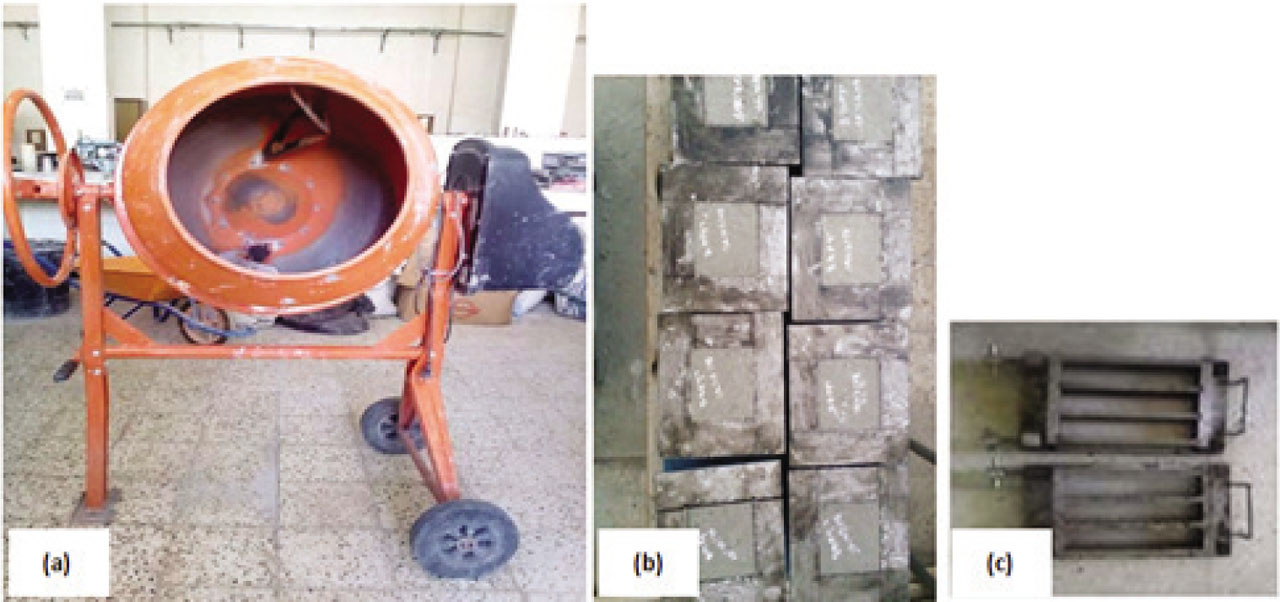
Figure 8:
Mixer and molds used for self-compacting concrete: (a) concrete mixer, (b) cubic samples (150×150×150 mm3), (c) prismatic samples (70×70×280 mm3).
Table 3:
Mixture details of self-compacting concrete (SCC).
Table 4:
Mixture details of self-compacting concrete (SCC): Cement substitution case.
| Component [Kg/m3] | SCC0 | SCC10 | SCC20 | SCC30 |
|---|---|---|---|---|
| Cement * | 500 | 450 | 400 | 350 |
| Crushed FSW | 0 | 50 | 100 | 150 |
| Limestone fillers | 118.1 | 118.1 | 118.1 | 118.1 |
| Natural sand | 844 | 844 | 844 | 844 |
| Water | 216 | 216 | 216 | 216 |
| Superplasticizer | 7.5 | 7.5 | 7.5 | 7.5 |
| Gravel 8/16 | 742.8 | 742.8 | 742.8 | 742.8 |
Table 5:
Mixture details of self-compacting concrete (CFS): Sand substitution case.
| Component [Kg/m3] | CFS0 | CFS10 | CFS30 | CFS50 |
|---|---|---|---|---|
| Cement | 500 | 500 | 500 | 500 |
| Limestone fillers | 118.1 | 118.1 | 118.1 | 118.1 |
| Natural sand** | 844 | 844 | 844 | 844 |
| Foundry sand waste | 0 | 84.4 | 168.8 | 253 |
| Water | 216 | 216 | 216 | 216 |
| Superplasticizer | 7.5 | 7.5 | 7.5 | 7.5 |
| Gravel 8/16 | 742.8 | 742.8 | 742.8 | 742.8 |
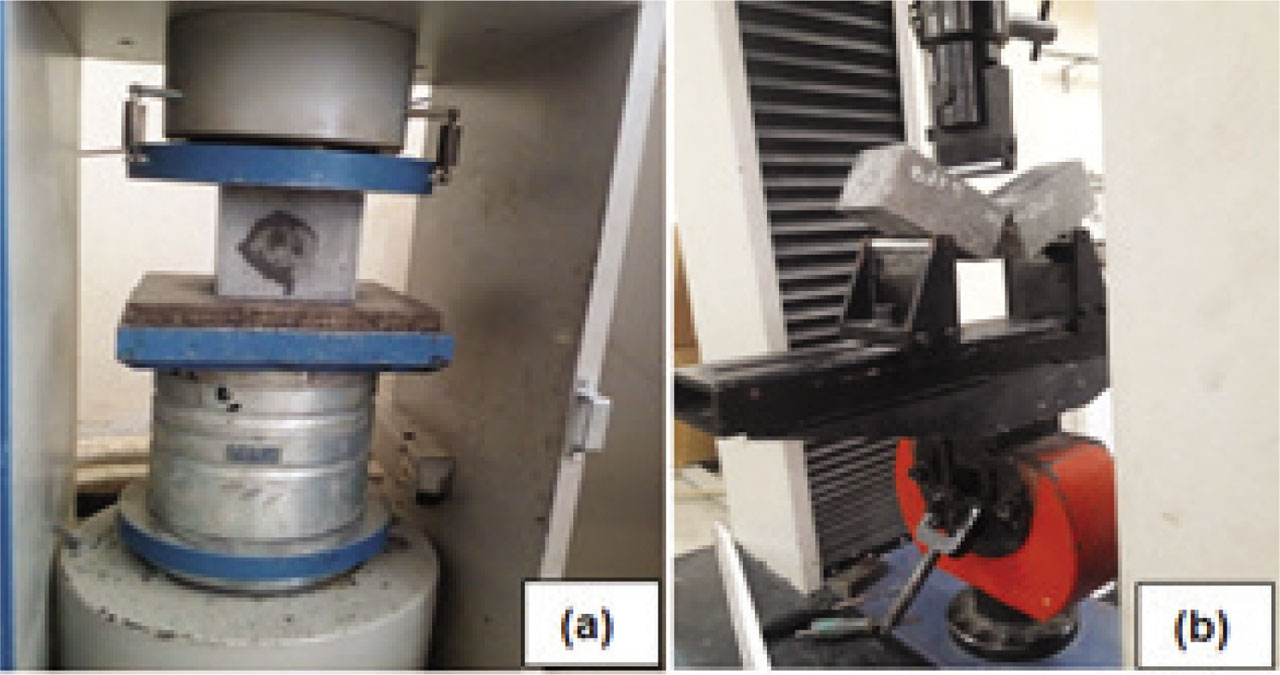
Figure 9:
Mechanical tests: (a) compressive, (b) flexural strength.
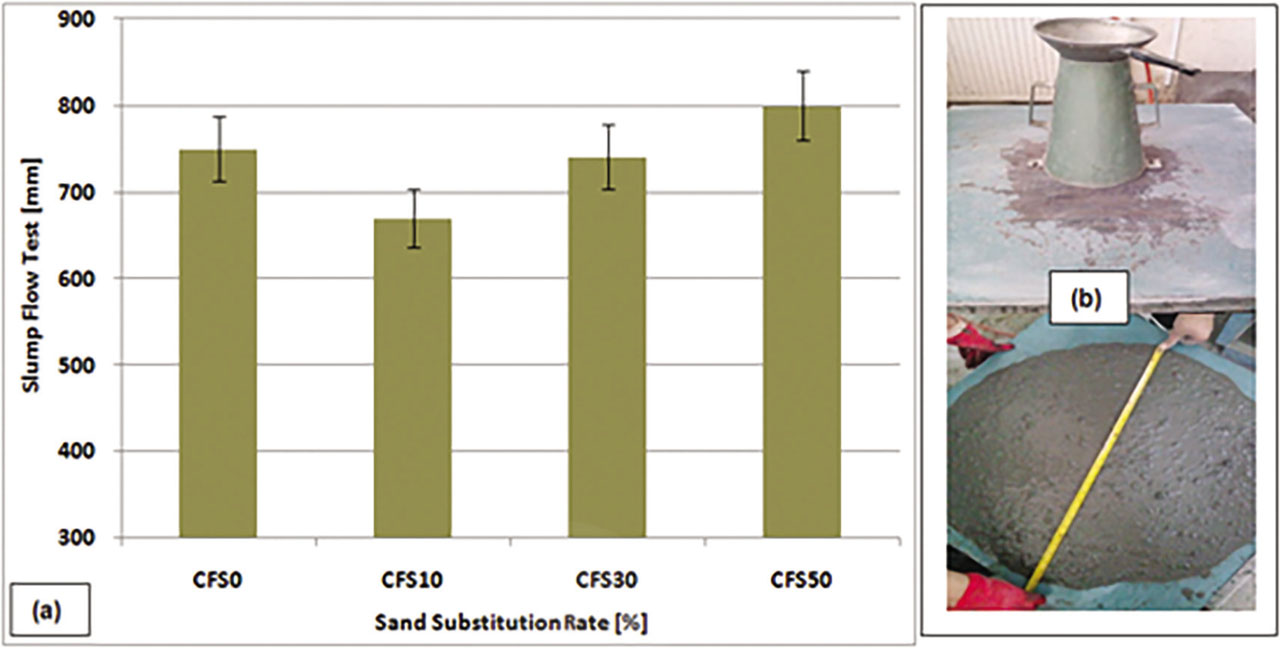
Figure 10:
Fluidity concretes studied by sand substitution: (a) obtained result, (b) practical flow test of concrete.
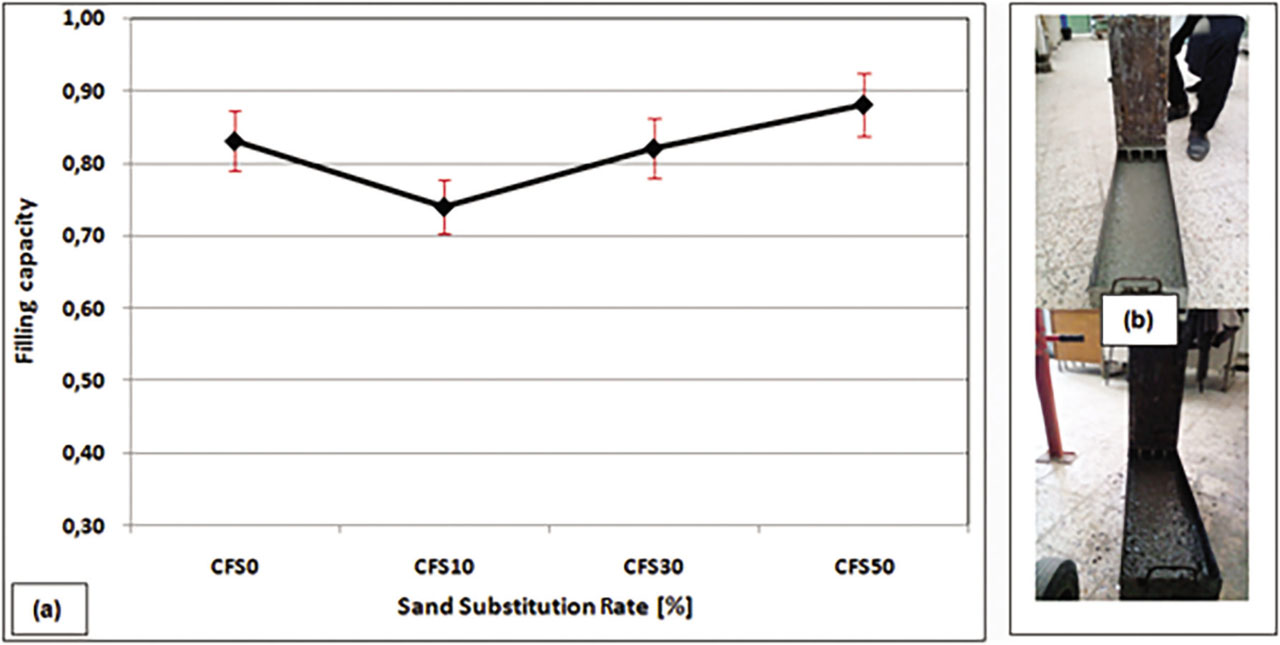
Figure 11:
Filling capacity of the concretes studied according to the rate of substitution of sand by FSW: (a) filling capacity of the concretes, (b) practical L-box test of self-compacting concrete.
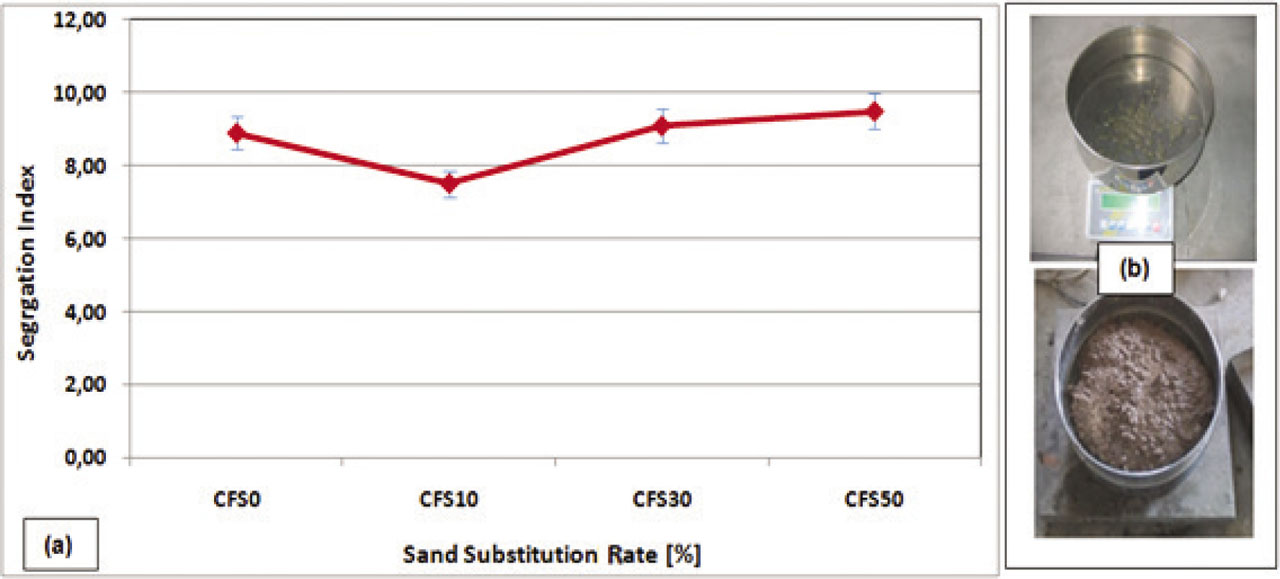
Figure 12:
Segregation index of the concretes studied according to the substitution rate of sand by FSW: (a) segregation index of the concretes, (b) segregation test of self-compacting concretes.
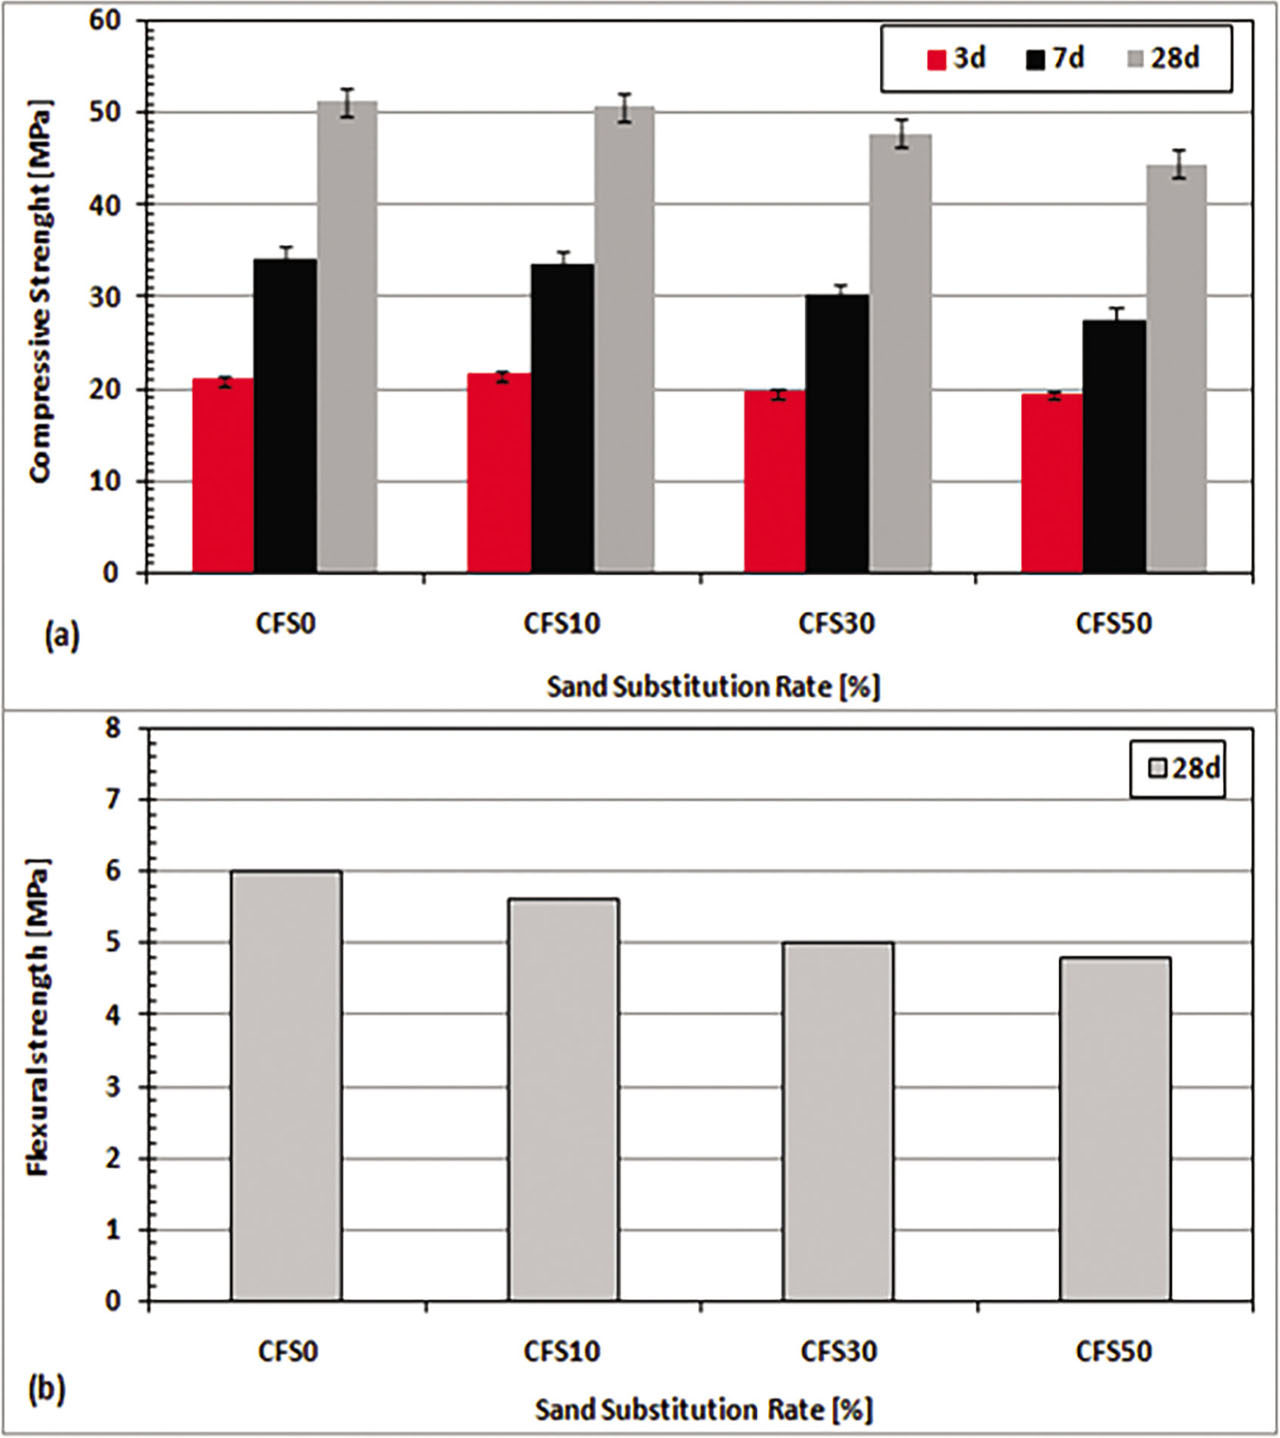
Figure 13:
Mechanical strength development of studied self-compacting concretes: (a) compressive strength, (b) flexural strength tested at 28d.
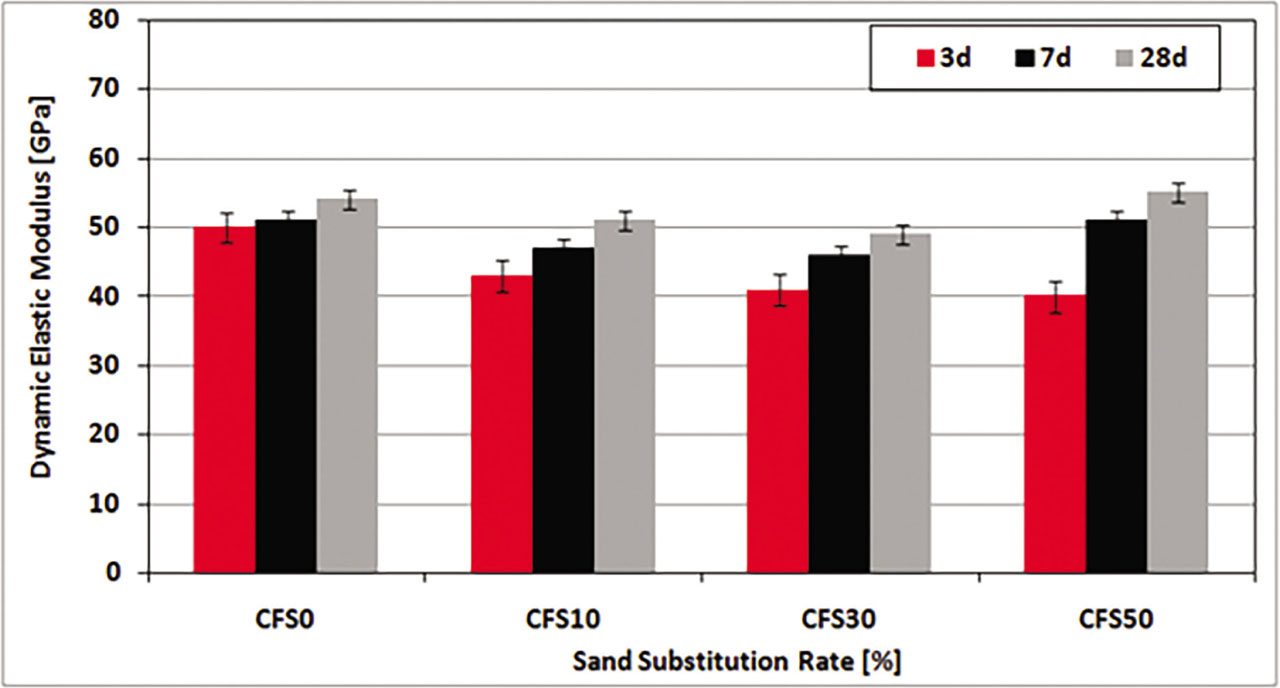
Figure 14:
Evolution of the dynamic elasticity coefficient of concretes according to the substitution rate of sand by FSW.
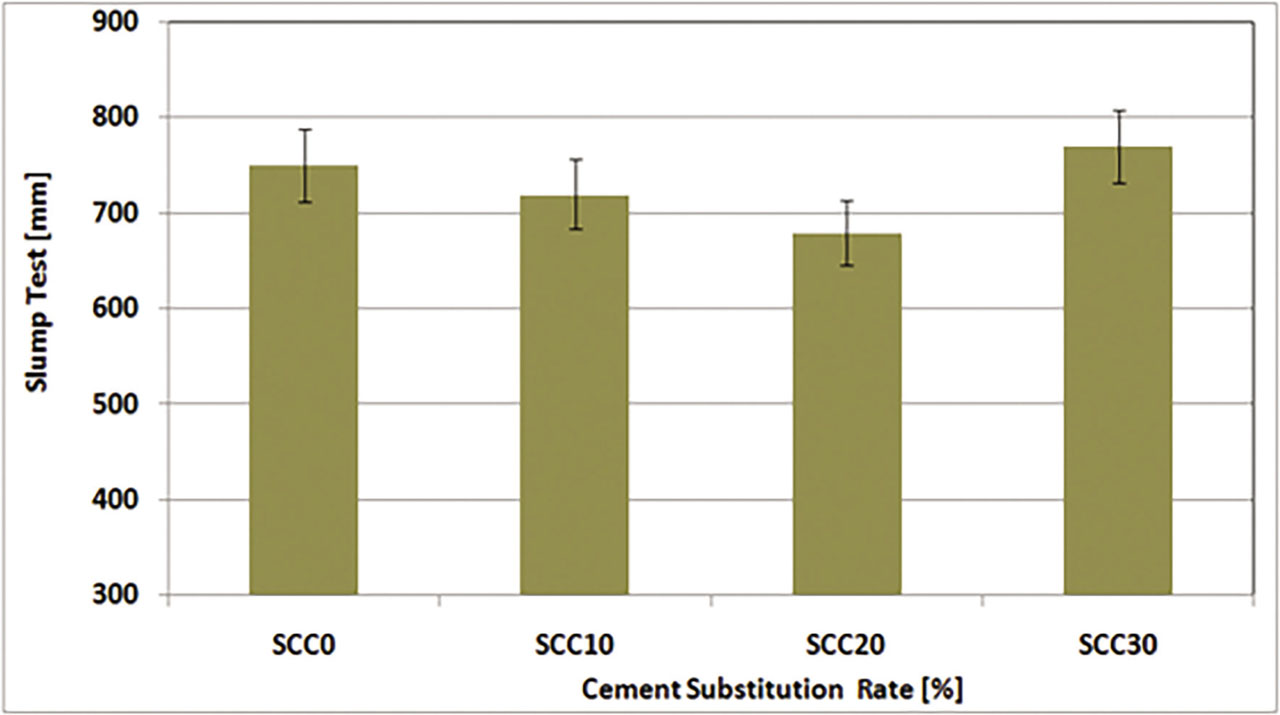
Figure 15:
Fluidity of concretes studied by cement substitution.
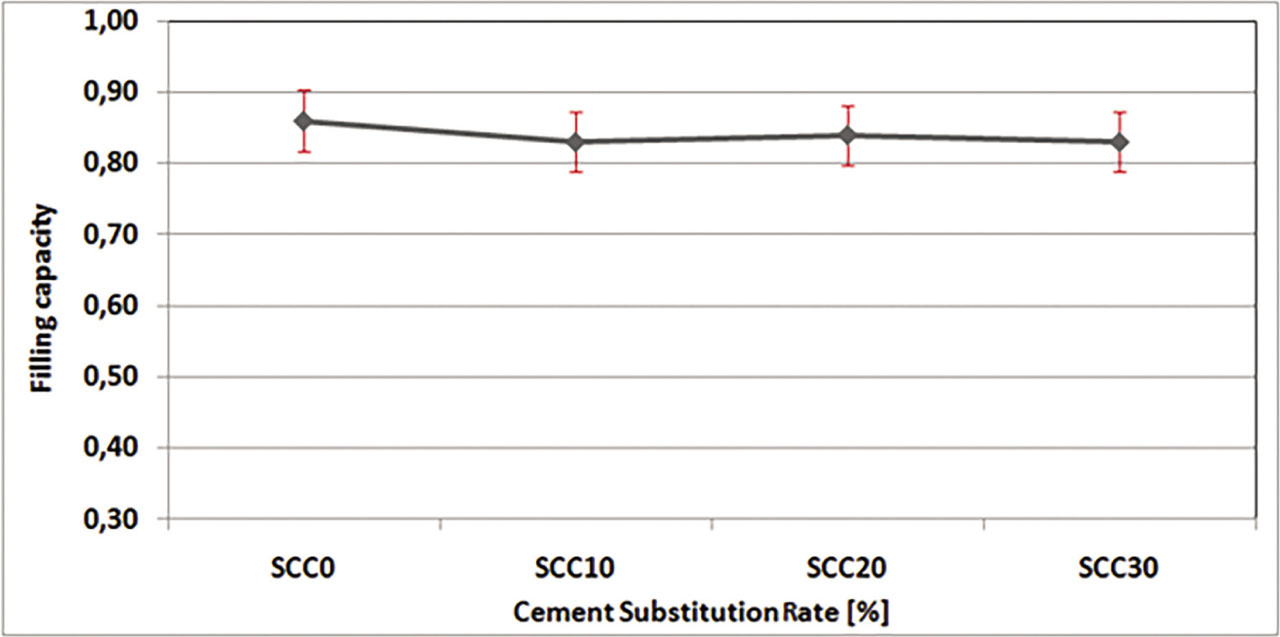
Figure 16:
Filling capacity of the concretes studied according to the substitution rate of cement by foundry sand waste.
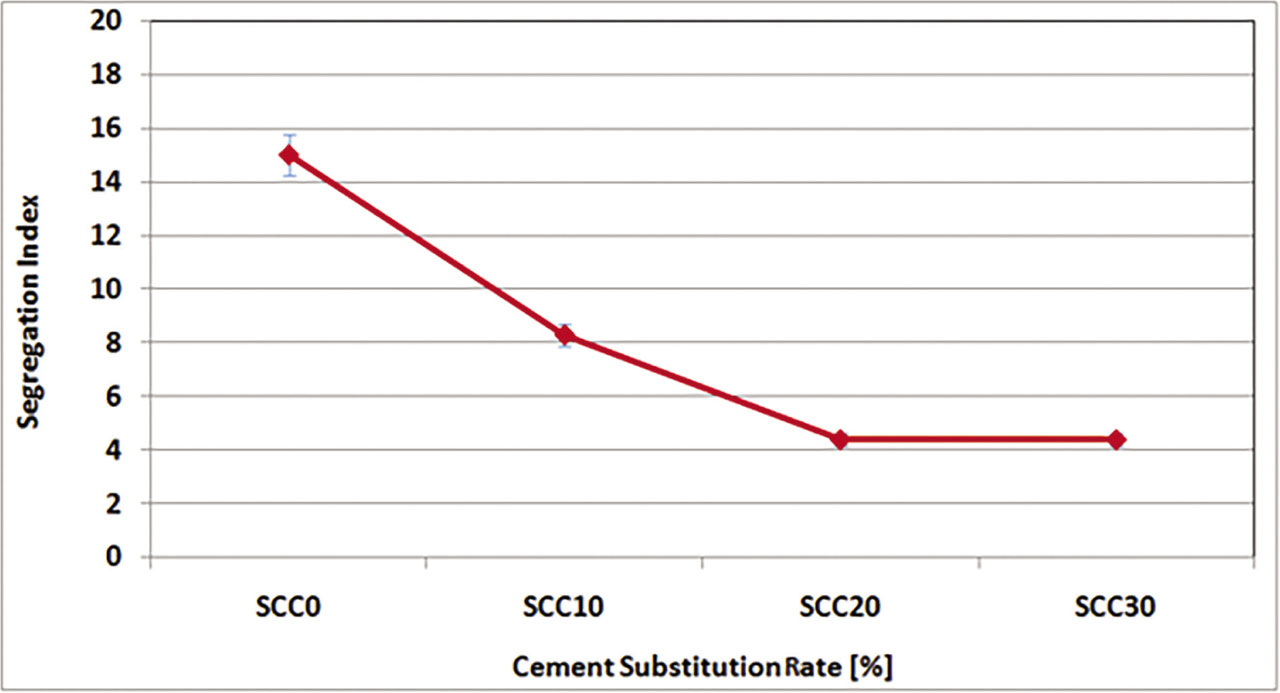
Figure 17:
Stability of concretes studied.
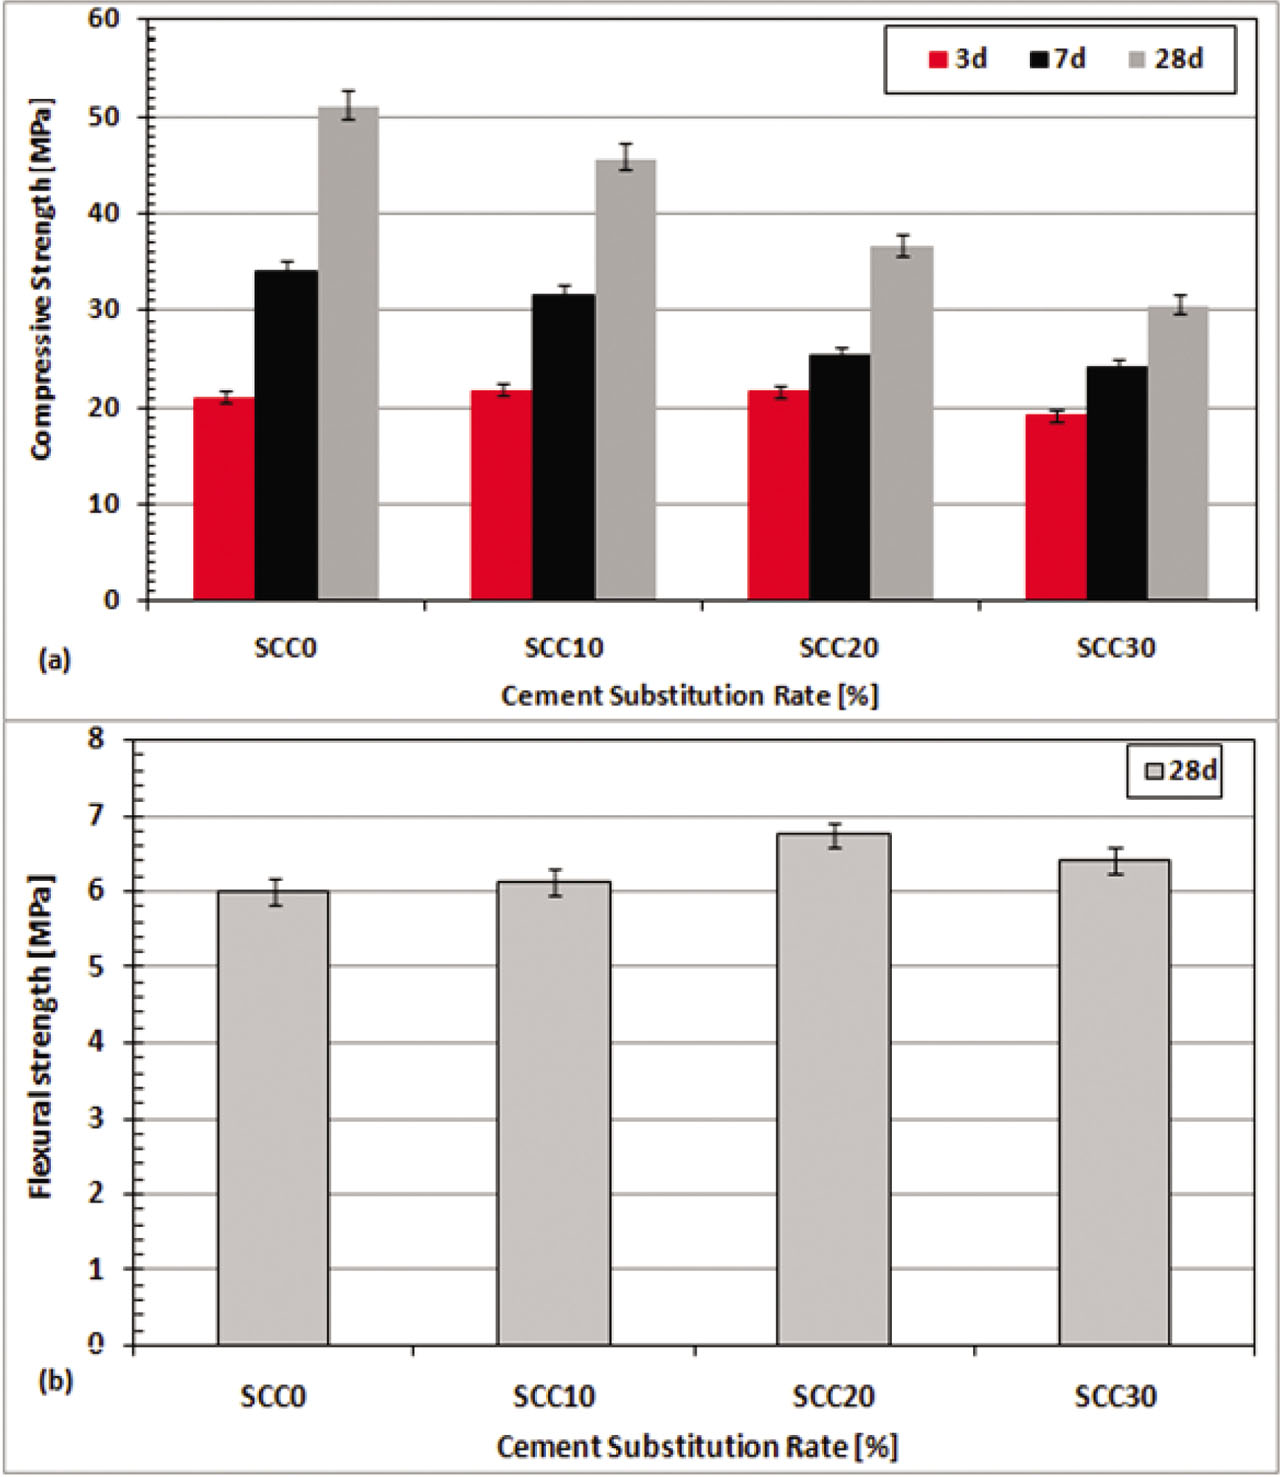
Figure 18:
Evolution of the mechanical strength of the concretes studied: (a) compressive strength, (b) flexural strength tested at 28d.
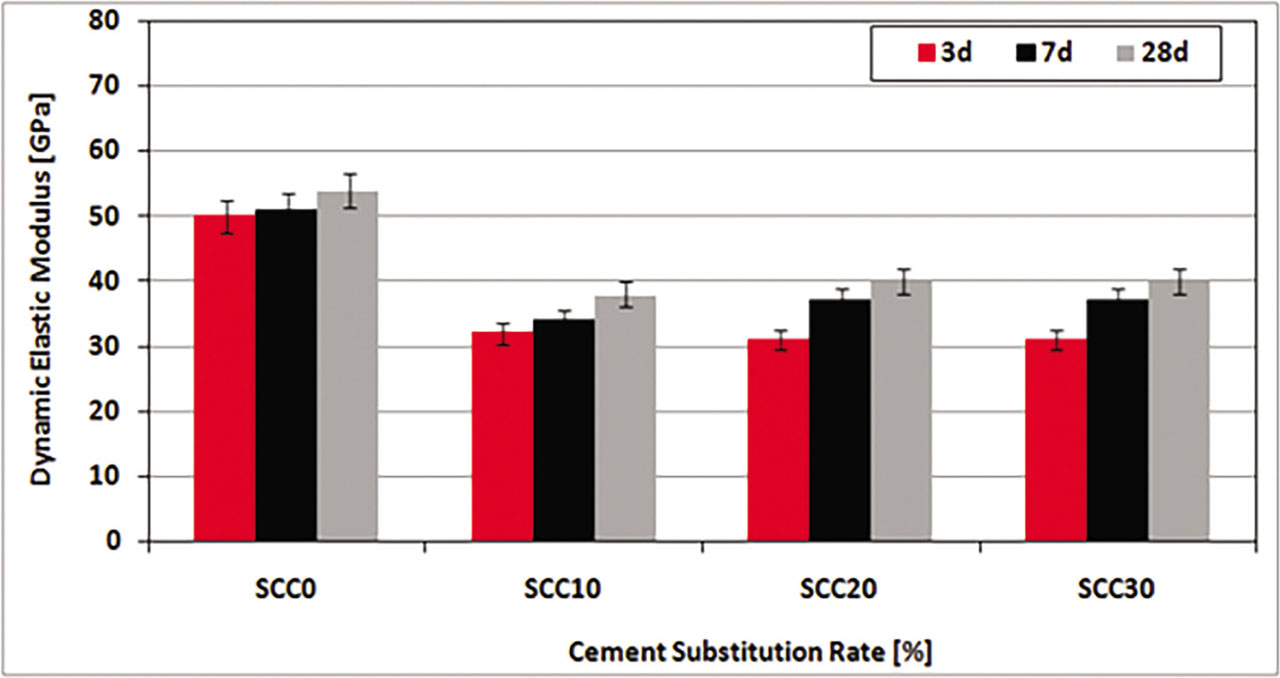
Figure 19:
Dynamic elastic modulus of the concretes studied.