
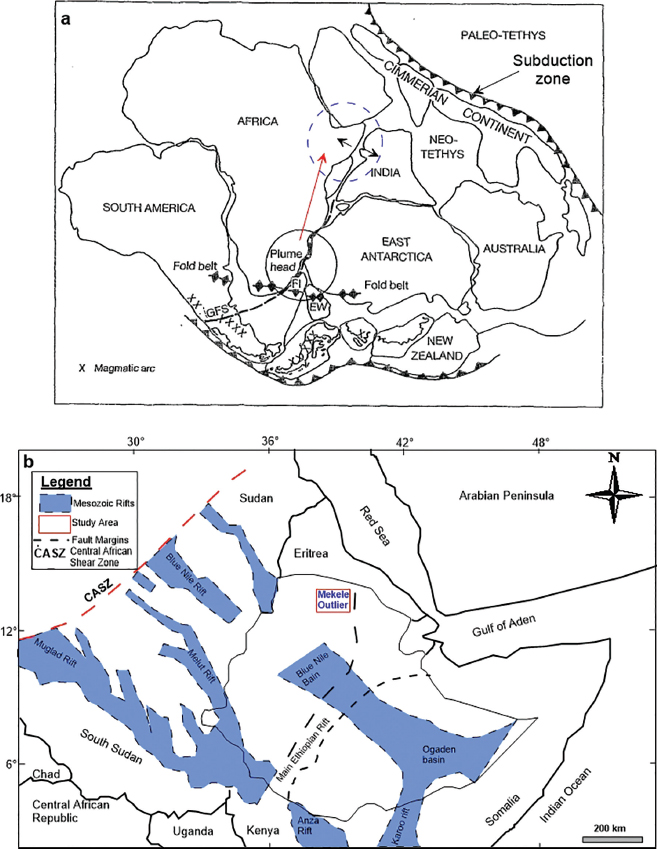
Figure 1:
(a) Map showing Gondwana breakup (after [18]); (b) Mesozoic rift basins of the Horn of Africa including Ethiopia (after [21]).
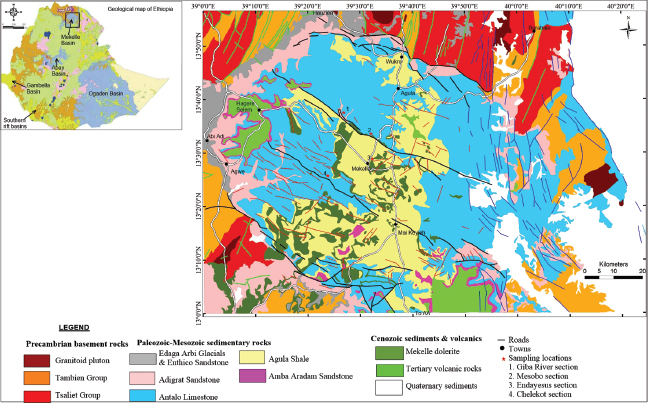
Figure 2:
Geological map of the Mekelle Basin with sampling locations (after [42]). The inset map is a simplified geological map of Ethiopia (after [43]).
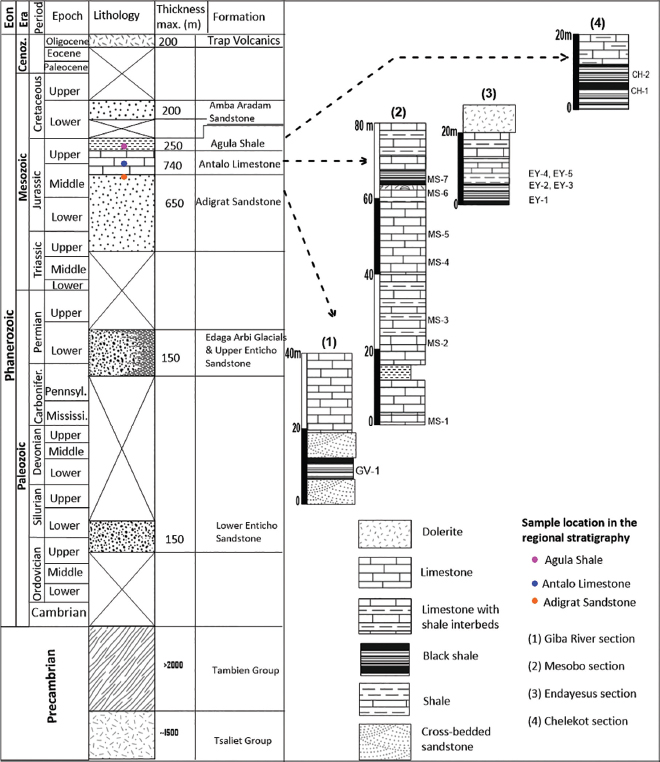
Figure 3:
Lithologic logs showing the locations of samples collected for source rock characterization.
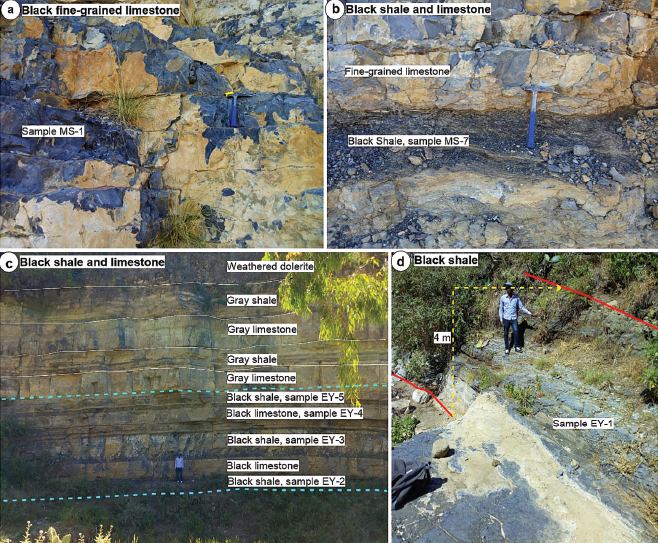
Figure 4:
Outcrop photographs showing black shale layers and limestone beds within the Antalo Limestone at the central part of the Mekelle Basin. (a) thickly bedded black fine-grained limestone (Mesobo section, sample MS-1); (b) black shale within black micritic limestone beds (sample MS-7); (c) 16 m thick stream-side cliff exposure comprising limestone and shale beds (samples EY-2 to EY-5) around Mekelle town (Endayesus section); (d) Black shale along stream at the bottom of Endayesus section (sample EY-1).
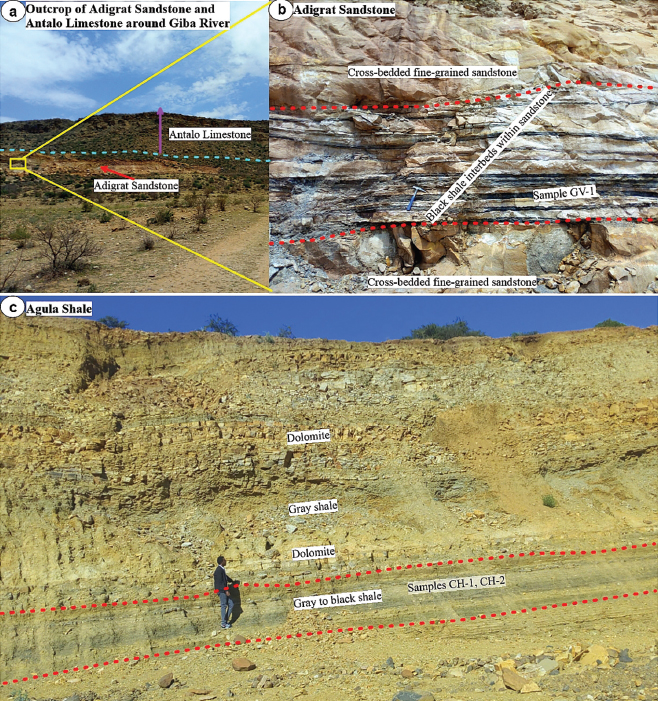
Figure 5:
Outcrop photographs showing black shale layers within the Adigrat Sandstone and Agula Shale, at the central part of the Mekelle Basin. (a) lower part of Antalo Limestone conformably overlies the upper part of Adigrat Sandstone at Giba River section; (b) about 5–10 cm thick oil shale beds (sample GV-1) from the upper part of Adigrat Sandstone; (c) Some part of the Agula Shale at Chelekot section (samples; CH-1, CH-2).
Table 1:
Outcrop samples collected for organic geochemical analyses.
| Sample no. | Sampling location | Sample type | Formation |
|---|---|---|---|
| CH-1 | 13°25’36’’, 39°23’39’’, 1912 m asl. | limestone | Agula Shale |
| CH-2 | shale | Antalo Limestone | |
| EY-1 | 13°29’26’’, 39°29’07’’, 2113 m asl. | shale | |
| EY-2 | shale | ||
| EY-3 | shale | ||
| EY-4 | limestone | ||
| EY-5 | shale | ||
| MS-1 | 13°33’23’’, 39°30’36’’, 2094 m asl. | limestone | |
| MS-2 | shale | ||
| MS-3 | shale | ||
| MS-4 | limestone | ||
| MS-5 | limestone | ||
| MS-6 | shale | ||
| MS-7 | shale | ||
| GV-1 | 13°37’55’’, 39°24’51’’, 1818 m asl. | shale | Adigrat Sandstone |
Table 2:
Rock-Eval pyrolysis data of the analyzed samples.
| Sample no. | Sample type | TOC (wt.%) | S1 | S2 | S3 | Tmax | HI | OI | PI | PP |
|---|---|---|---|---|---|---|---|---|---|---|
| CH-1 | limestone | 0.18 | 0.00 | 0.00 | 0.17 | 327 | 0 | 94 | -- | 0.00 |
| CH-2 | shale | 0.40 | 0.01 | 0.00 | 0.25 | 524 | 0 | 62 | 1.00 | 0.01 |
| EY-1 | shale | 0.25 | 0.00 | 0.00 | 0.26 | 498 | 0 | 106 | -- | 0.00 |
| EY-2 | shale | 0.77 | 0.01 | 0.01 | 0.20 | 485 | 1.3 | 26 | 0.50 | 0.02 |
| EY-3 | shale | 0.20 | 0.00 | 0.01 | 0.98 | 495 | 5 | 488 | 0.00 | 0.01 |
| EY-4 | limestone | 0.21 | 0.02 | 0.07 | 0.64 | 475 | 34 | 309 | 0.22 | 0.09 |
| EY-5 | shale | 0.23 | 0.00 | 0.00 | 0.26 | 496 | 0 | 111 | -- | 0.00 |
| MS-1 | limestone | 0.11 | 0.00 | 0.00 | 0.30 | -- | 0 | 275 | -- | 0.00 |
| MS-2 | shale | 0.50 | 0.00 | 0.02 | 0.39 | 493 | 4 | 78 | 0.00 | 0.02 |
| MS-3 | shale | 0.41 | 0.00 | 0.01 | 0.51 | 505 | 2.44 | 125 | 0.00 | 0.01 |
| MS-4 | limestone | 0.10 | 0.00 | 0.00 | 0.28 | 484 | 0 | 294 | -- | 0.00 |
| MS-5 | limestone | 0.22 | 0.00 | 0.00 | 0.26 | 484 | 0 | 119 | -- | 0.00 |
| MS-6 | shale | 0.20 | 0.00 | 0.00 | 0.39 | 491 | 0 | 194 | -- | 0.00 |
| MS-7 | shale | 0.92 | 0.02 | 0.02 | 1.10 | 519 | 2 | 119 | 0.50 | 0.04 |
| GV-1 | shale | 0.42 | 0.00 | 0.00 | 0.35 | 527 | 0 | 83 | -- | 0.00 |
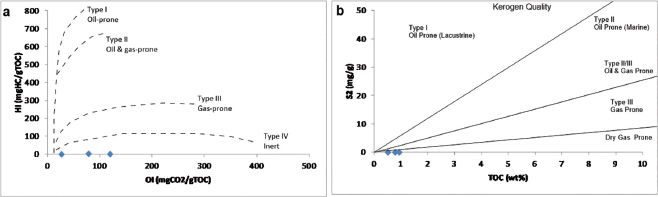
Figure 6:
(a) Oxygen index (OI) and hydrogen index (HI) cross plot for the recognition of kerogen types (after [57]); (b) Kerogen type based on TOC versus pyrolysis yield (S2) cross-plot, showing very poor quality organic matter for hydrocarbon generation (after [47]).
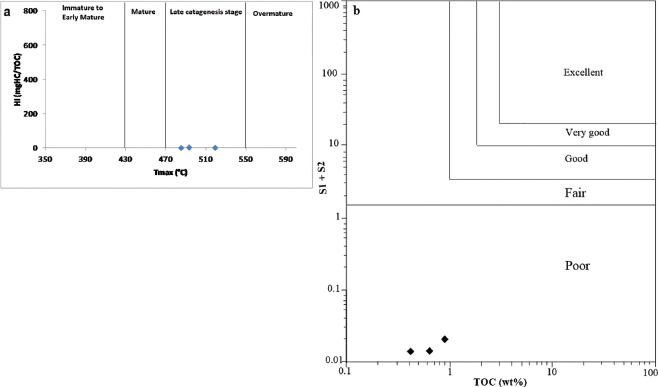
Figure 7:
(a) Rock-Eval Tmax versus hydrogen index (HI) plot showing the thermal maturity level of the organic matter (after [57]); (b) TOC versus (S1+ S2) cross-plot, indicating poor hydrocarbon generating potential (after [47]).