
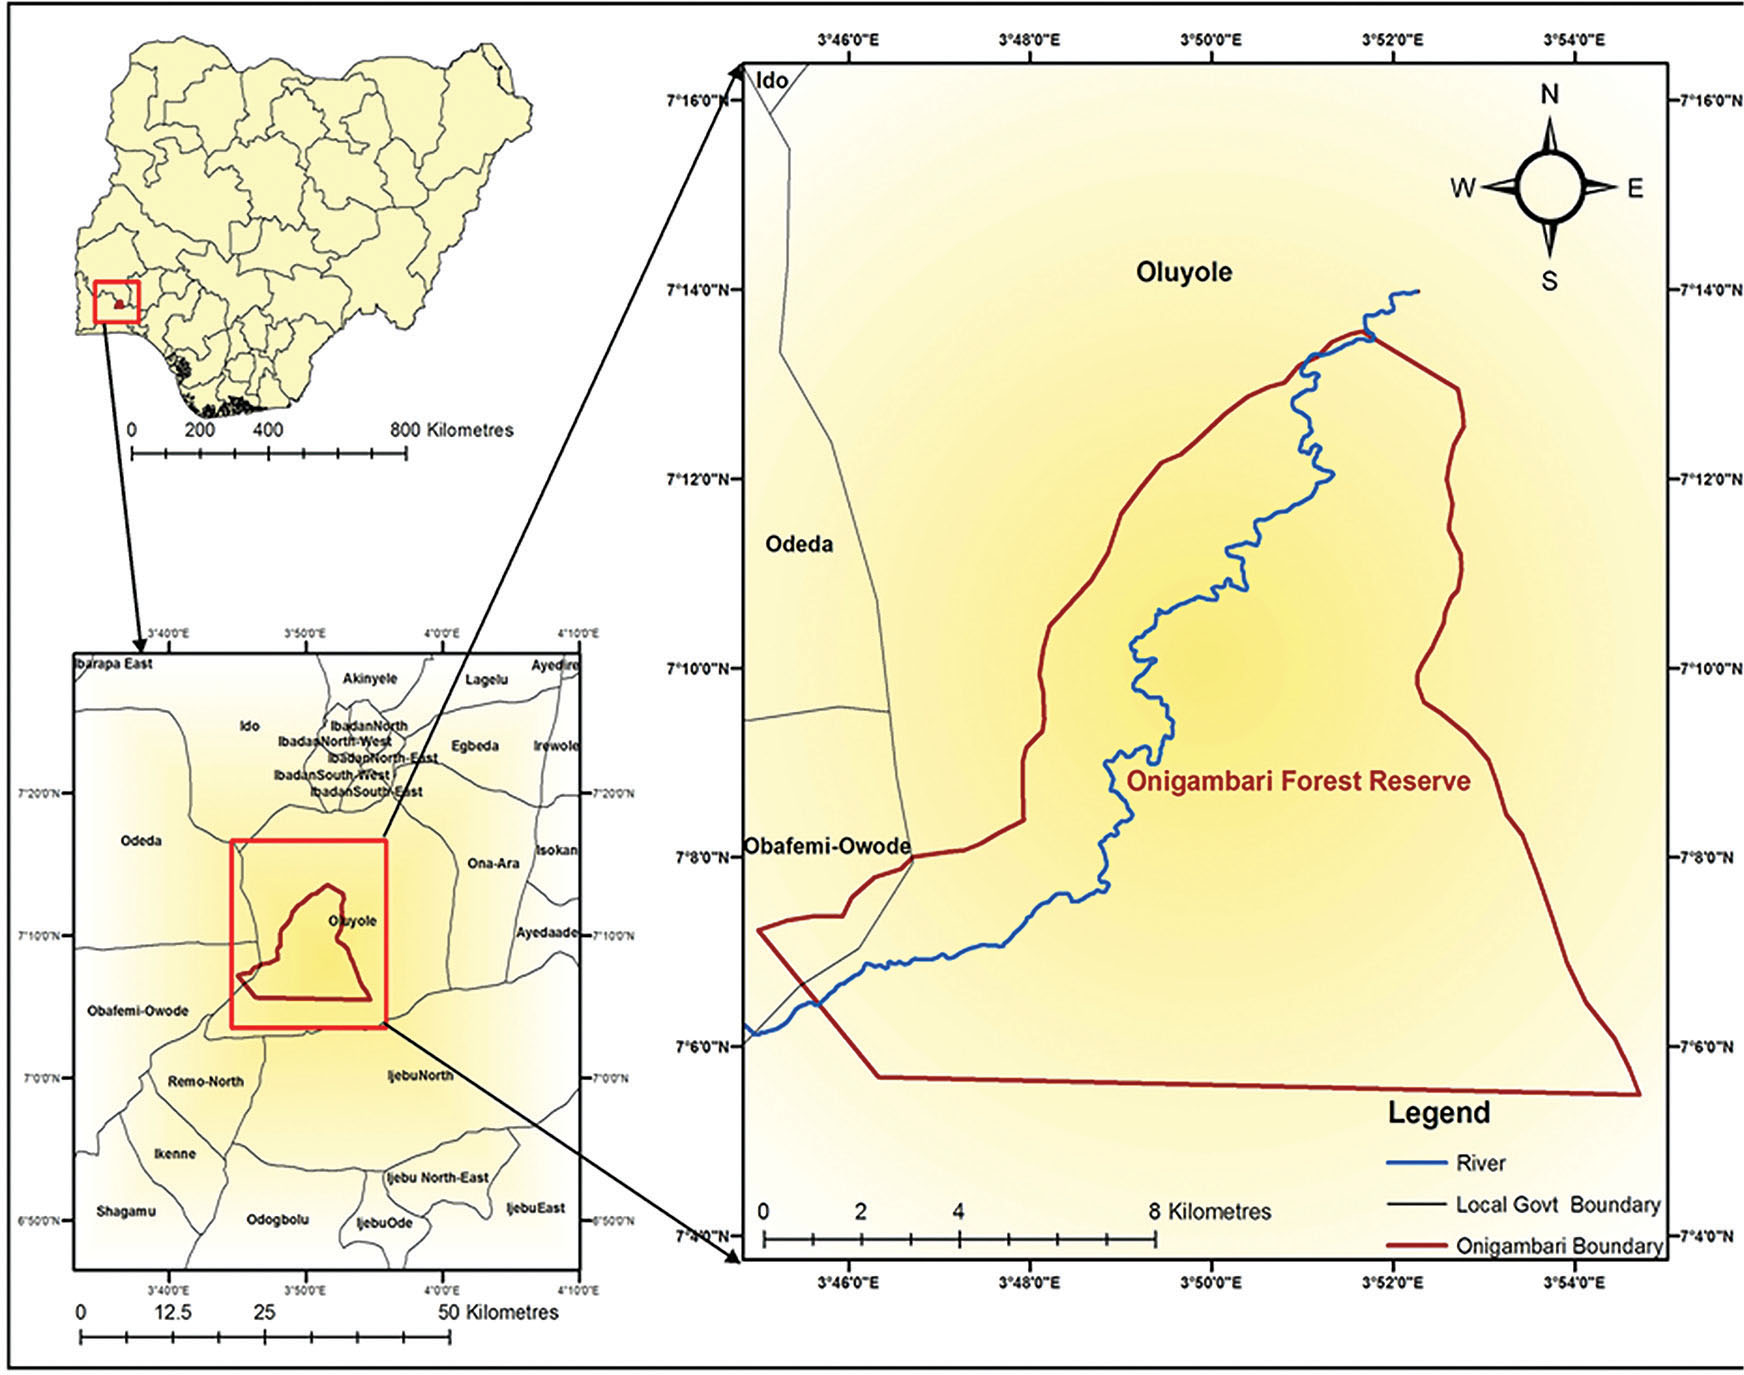
Figure 1:
Map of the study area (Gambari Forest Reserve).
Source: Adapted from the study by Adedeji et al. [18].
Table 1:
Data set acquired and its sources
| S/N | Data Sets | Resolution/ Scale | Year of Production | Date of Acquisition | Source |
|---|---|---|---|---|---|
| 1 | Landsat 5 | 30 M | 1984 | 18/12/1984 | USGS |
| 2 | Landsat 7 | 30 M | 2004 | 06/02/2004 | USGS |
| 3 | Landsat 8 OLI | 30 M | 2020 | 15/02/2020 | USGS |
| 4 | Gambari Forest Reserve boundary map | 1:50,000 | 2015 | 23/11/2018 | Adedeji et al. [18] |
Table 2:
LULC classification scheme
| S/N | Code | LULC Classification Category | Definition of Terms |
|---|---|---|---|
| 1 | DF | Dense forest | Area with dense intensity of forest with thick closed canopy |
| 2 | LF | Light forest | Area with low intensity of forest with light closed canopy |
| 3 | NF | Non-forest | Area covered with shrubs and grasses with no canopy |
Table 3:
LULC distribution of Gambari Forest in 1984 showing area (km2) of the LULC classes
| Classes | Area (%) | Area (km2) |
|---|---|---|
| Non-forest | 11.20 | 14.70 |
| Light forest | 65.40 | 79.20 |
| Dense forest | 23.40 | 31.70 |
| TOTAL | 100.00 | 125.60 |
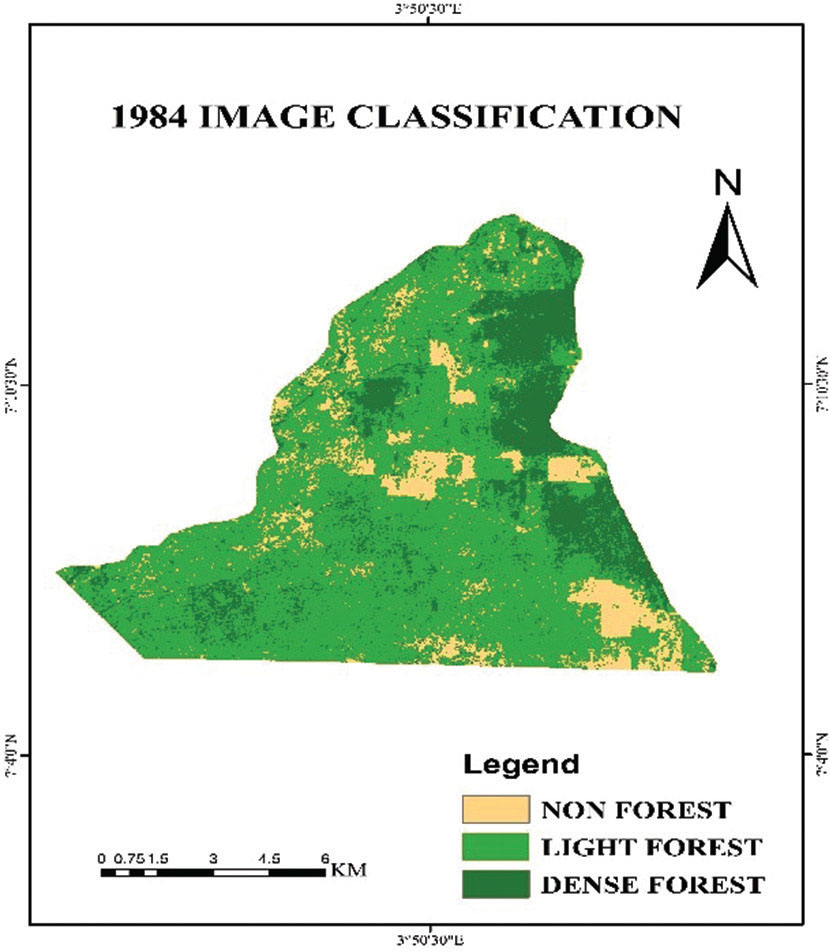
Figure 2:
Land-cover classification of Gambari Forest in 1984.
Table 4:
LULC distribution of Gambari Forest in 2004 showing area (km2) of the LULC classes
| Classes | Area (%) | Area (km2) |
|---|---|---|
| Non-forest | 25.10 | 37.80 |
| Light forest | 43.70 | 51.20 |
| Dense forest | 31.20 | 36.60 |
| TOTAL | 100.00 | 125.60 |
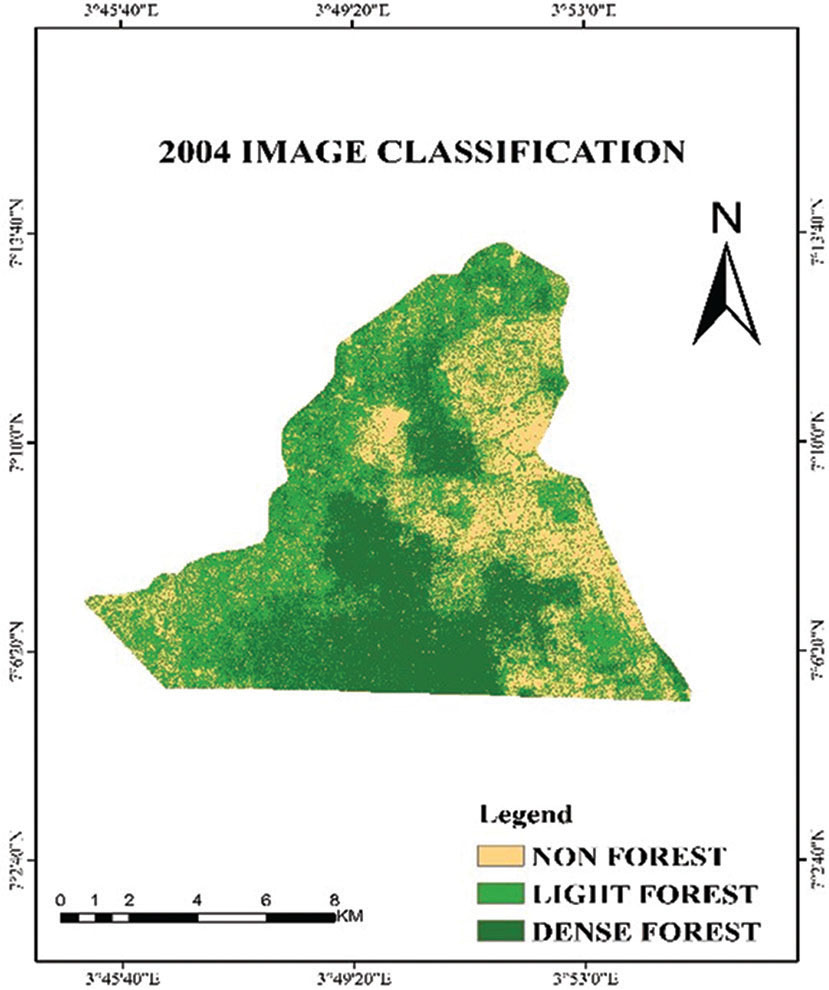
Figure 3:
Land-cover classification of Gambari Forest in 2004.
Table 5:
LULC distribution of Gambari Forest in 2020 showing area (km2) of the LULC classes
| Classes | Area (%) | Area (km2) |
|---|---|---|
| Non-forest | 4.10 | 2.60 |
| Dense forest | 54.40 | 72.80 |
| Light forest | 41.50 | 51.20 |
| TOTAL | 100.00 | 125.60 |
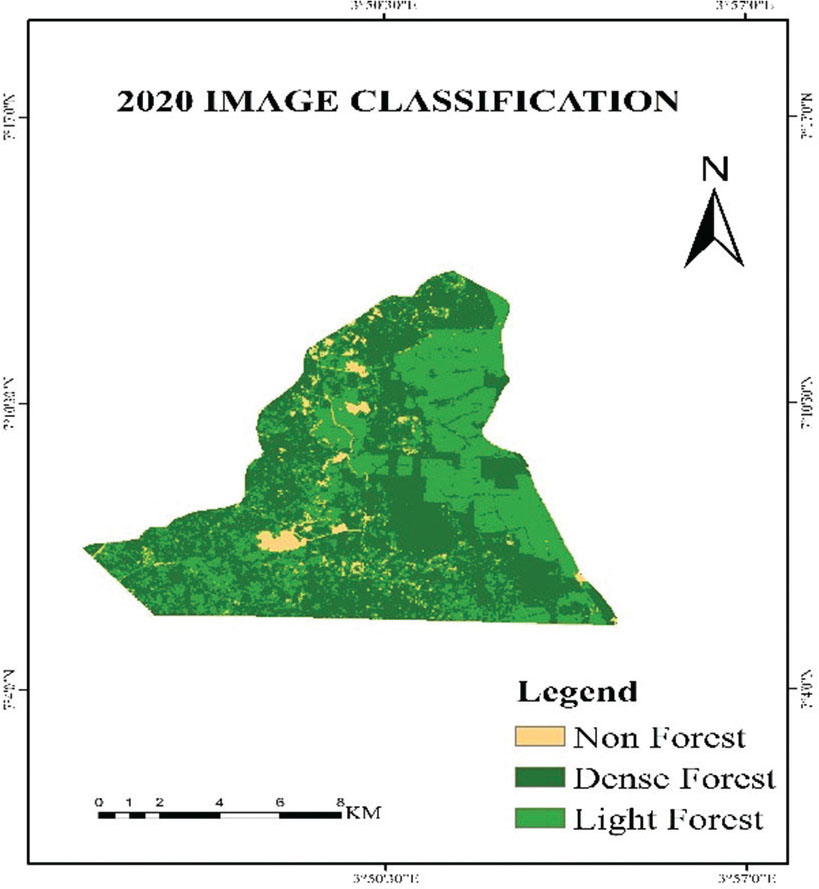
Figure 4:
Land-cover classification of Gambari Forest in 2020.
Table 6:
Changes in land cover of Gambari Forest Reserve from 1984 to 2004
| Classes | Area in 1984 (km2) | Area in 1984(%) | Area in 2004 (km2) | Area in 2004 (%) | Percentage Change from 1984–2004 |
|---|---|---|---|---|---|
| NF | 14.70 | 11.20 | 37.80 | 25.10 | 13.90 |
| LF | 79.20 | 65.40 | 51.20 | 43.70 | -21.70 |
| DF | 31.70 | 23.40 | 36.60 | 31.20 | 7.80 |