
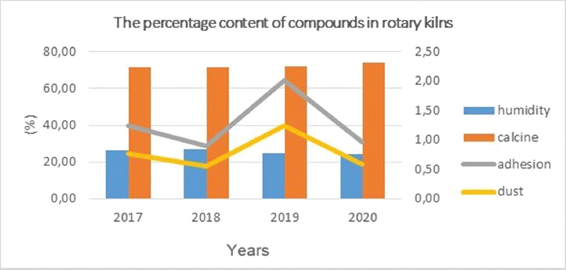
Figure 1:
Graphical representation of the amount of ores, moisture, calcine, adhesion, and dust in the product of rotary kilns.
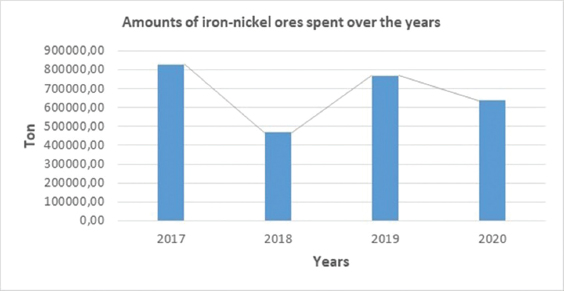
Figure 2:
Graphical representation of the amount of Fe-Ni ore used during the years 2017-2020.
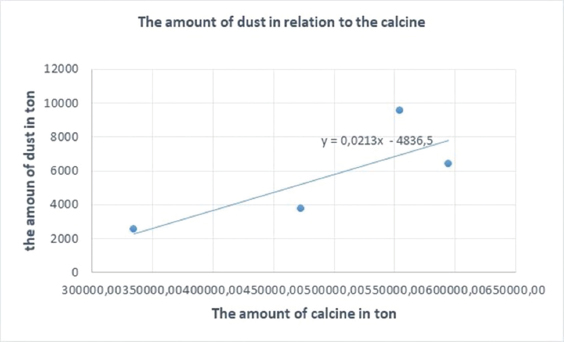
Figure 3:
The representation of the amount of dust in relation to calcine.