
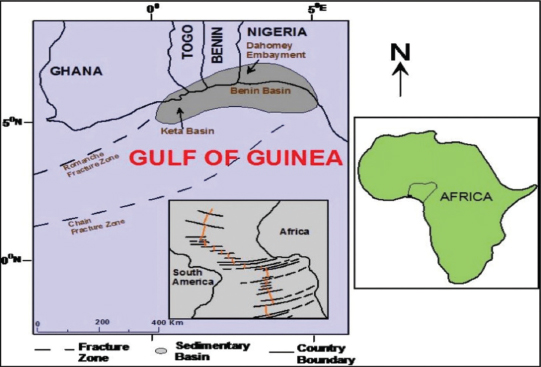
Figure 1:
Regional map of four countries showing the location of the Benin (Dahomey) Basin in the Gulf of Guinea [11].
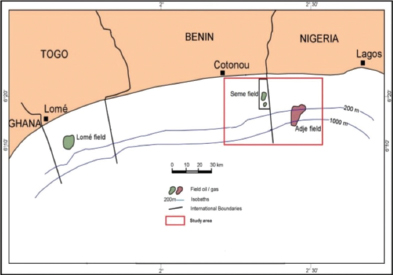
Figure 2:
Dahomey embayment showing the study area (after d’Almeida et al. [14]).
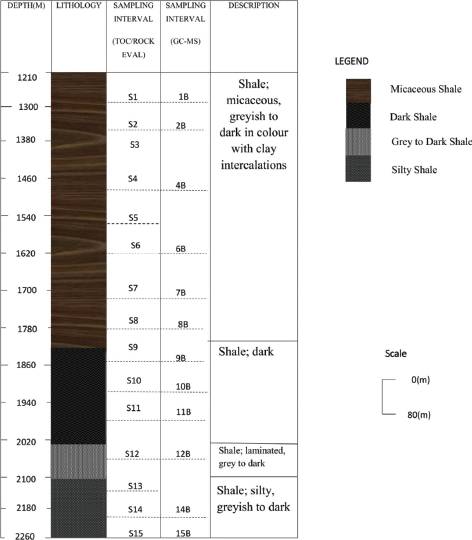
Figure 3:
Lithological log of the studied section of EE-1 Well.
Table 1:
Results of TOC and Rock-Eval Pyrolysis of the studied samples.
| Sample ID | Depth (m) | SOM (ppm) | TOC | S1 | S2 | S3 | Tmax | Calc. %Ro | GP (S1 + S2) | HI | OI | SOM/TOC | S1/TOC | PI |
|---|---|---|---|---|---|---|---|---|---|---|---|---|---|---|
| S1 | 1240 | 676.12 | 1.14 | 0.13 | 1.11 | 2.23 | 423 | 0.45 | 1.24 | 97 | 196 | 59.31 | 11 | 0.10 |
| S2 | 1340 | 2004.31 | 1.01 | 0.16 | 1.02 | 2.36 | 422 | 0.44 | 1.18 | 101 | 234 | 198.45 | 16 | 0.14 |
| S3 | 1410 | ND | 1.19 | 0.16 | 1.31 | 2.78 | 425 | 0.49 | 1.47 | 110 | 234 | ND | 13 | 0.11 |
| S4 | 1480 | 1417.71 | 1.41 | 0.19 | 1.93 | 2.55 | 428 | 0.54 | 2.12 | 137 | 181 | 100.55 | 13 | 0.09 |
| S5 | 1560 | ND | 0.96 | 0.15 | 1.15 | 2.51 | 429 | 0.56 | 1.3 | 120 | 262 | ND | 16 | 0.12 |
| S6 | 1620 | 2456.23 | 0.97 | 0.15 | 1.26 | 1.96 | 429 | 0.56 | 1.41 | 131 | 203 | 43.03 | 16 | 0.11 |
| S7 | 1700 | 2883.85 | 1.02 | 0.21 | 1.66 | 2.79 | 427 | 0.53 | 1.87 | 163 | 274 | 13.04 | 21 | 0.11 |
| S8 | 1760 | 1835.19 | 1.47 | 0.25 | 2.60 | 2.39 | 430 | 0.58 | 2.85 | 177 | 163 | 15.28 | 17 | 0.09 |
| S9 | 1830 | 1599.37 | 1.94 | 0.34 | 5.84 | 2.51 | 426 | 0.51 | 6.18 | 301 | 129 | 11.96 | 18 | 0.06 |
| S10 | 1906 | 1205.55 | 2.63 | 0.93 | 8.24 | 2.53 | 427 | 0.53 | 9.17 | 313 | 96 | 6.13 | 35 | 0.10 |
| S11 | 1965 | 2698.84 | 1.91 | 1.00 | 4.11 | 2.51 | 431 | 0.60 | 5.11 | 215 | 131 | 23.64 | 52 | 0.20 |
| S12 | 2040 | 1826.01 | 2.03 | 0.95 | 2.99 | 3.29 | 425 | 0.49 | 3.94 | 147 | 162 | 6.28 | 47 | 0.24 |
| S13 | 2118 | ND | 1.18 | 0.39 | 2.94 | 2.30 | 429 | 0.56 | 3.33 | 249 | 195 | ND | 33 | 0.12 |
| S14 | 2180 | 2143.91 | 1.15 | 0.63 | 3.25 | 2.79 | 422 | 0.44 | 3.88 | 283 | 243 | 186.43 | 55 | 0.16 |
| S15 | 2257.5 | 1978.45 | 8.92 | 1.35 | 43.18 | 3.15 | 426 | 0.51 | 44.53 | 484 | 35 | 22.18 | 15 | 0.03 |
1 TOC = weight percent organic carbon in rock, GP = petroleum genetic potential
Tmax = °C, HI = hydrogen index
S1+S2 = mg HC/g of rock, OI = oxygen index
S3 = mg CO2/g of rock, PI = production index = S1 / (S1+S2)
S1/TOC = normalized oil content, Calc. % Ro = Calculated vitrinite reflectance
SOM = Soluble Organic Matter, ND = Not done
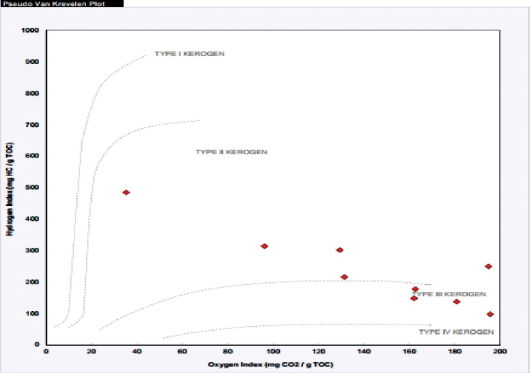
Figure 4:
A cross plot of hydrogen index (HI) versus oxygen index (OI) showing that the organic matter of the studied well is of types II and type III kerogen (Modified after Van Krevelen [29]).
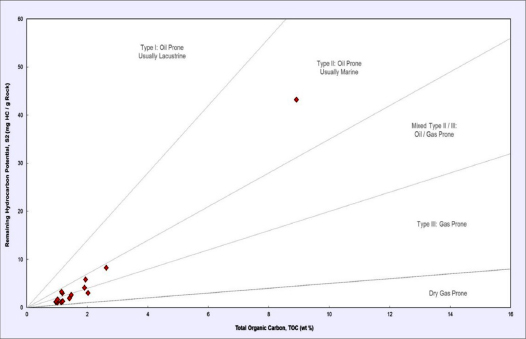
Figure 5:
A cross plot of remaining hydrocarbon potential (S2) against total organic content (TOC) showing the organic matter type and origin (after Jackson et al. [30]).
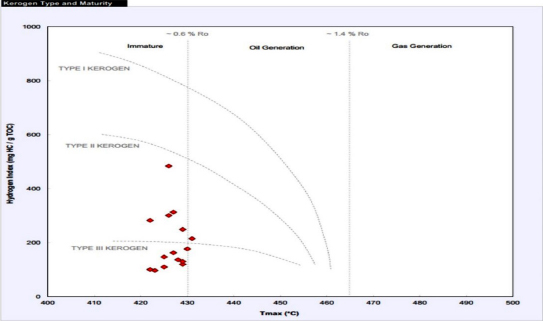
Figure 6:
Plot of hydrogen index (HI) against Tmax showing that the kerogen is in the immature window [33].
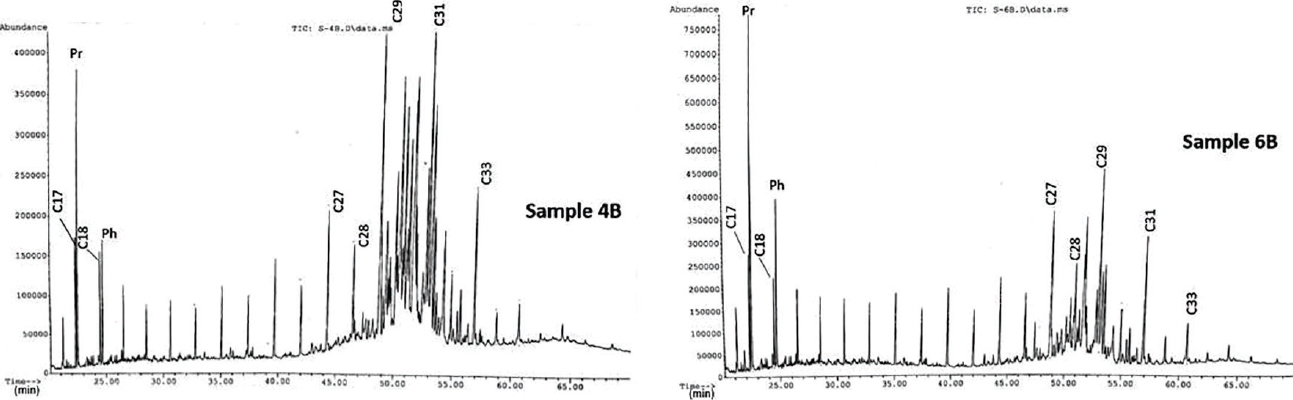
Figure 7:
Total ion chromatograms showing the distribution of the saturated hydrocarbon fraction of representative Samples 4B and 6B from the study well.
Table 2:
Data showing values of isoprenoids, isoprenoids/n-alkane ratios and other parameters for EE-1 well.
| Sample ID | Pr/Ph | Pr/n-C17 | Ph/n-C18 | CPI | OEP-1 | OEP-2 |
|---|---|---|---|---|---|---|
| 1B | 1.47 | 0.98 | 0.62 | 1.93 | 0.51 | 0.83 |
| 2B | 1.74 | 1.20 | 0.90 | 1.66 | 0.45 | 0.76 |
| 4B | 2.38 | 2.41 | 1.08 | 1.70 | 0.51 | 0.8 |
| 6B | 2.05 | 2.99 | 1.83 | 1.51 | 0.46 | 0.62 |
| 7B | 3.20 | 2.42 | 1.40 | 1.67 | 0.53 | 0.7 |
| 8B | 2.33 | 1.58 | 0.76 | 1.23 | 0.39 | 0.51 |
| 9B | 1.49 | 2.31 | 1.55 | 1.27 | 0.47 | 0.49 |
| 10B | 1.78 | 1.24 | 0.63 | 1.01 | 0.35 | 0.41 |
| 11B | 2.20 | 0.99 | 0.51 | 1.12 | 0.39 | 0.44 |
| 12B | 1.65 | 0.92 | 0.54 | 1.04 | 0.37 | 0.4 |
| 14B | 1.94 | 0.60 | 0.46 | 0.37 | 0.4 | 0.08 |
| 15B | 1.80 | 0.80 | 0.42 | 1.12 | 0.41 | 0.42 |
1 Abbreviations: Pr/Ph, pristane/phytane; Pr/nC17, pristane/normal-C17 alkane; Ph/nC18, phytane/normal-C18 alkane; CPI, carbon preference index, 2 (C23 + C25 + C27 + C29) / (C22 + 2 C24 + C26 + C28) + C30); OEP-1, (C21 + C23 + C25) / (4C22 + 4C24); OEP-2, (C25 + C27 + C29) / (4C26 + 4C28); OEP, odd-to-even predominance.
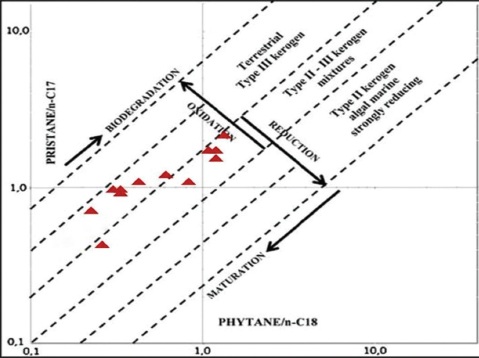
Figure 8:
Cross plot of Pr/n-C17 versus Ph/n-C18 showing the sources of organic matter and the depositional environment (Modified after Cortes et al. [39]).
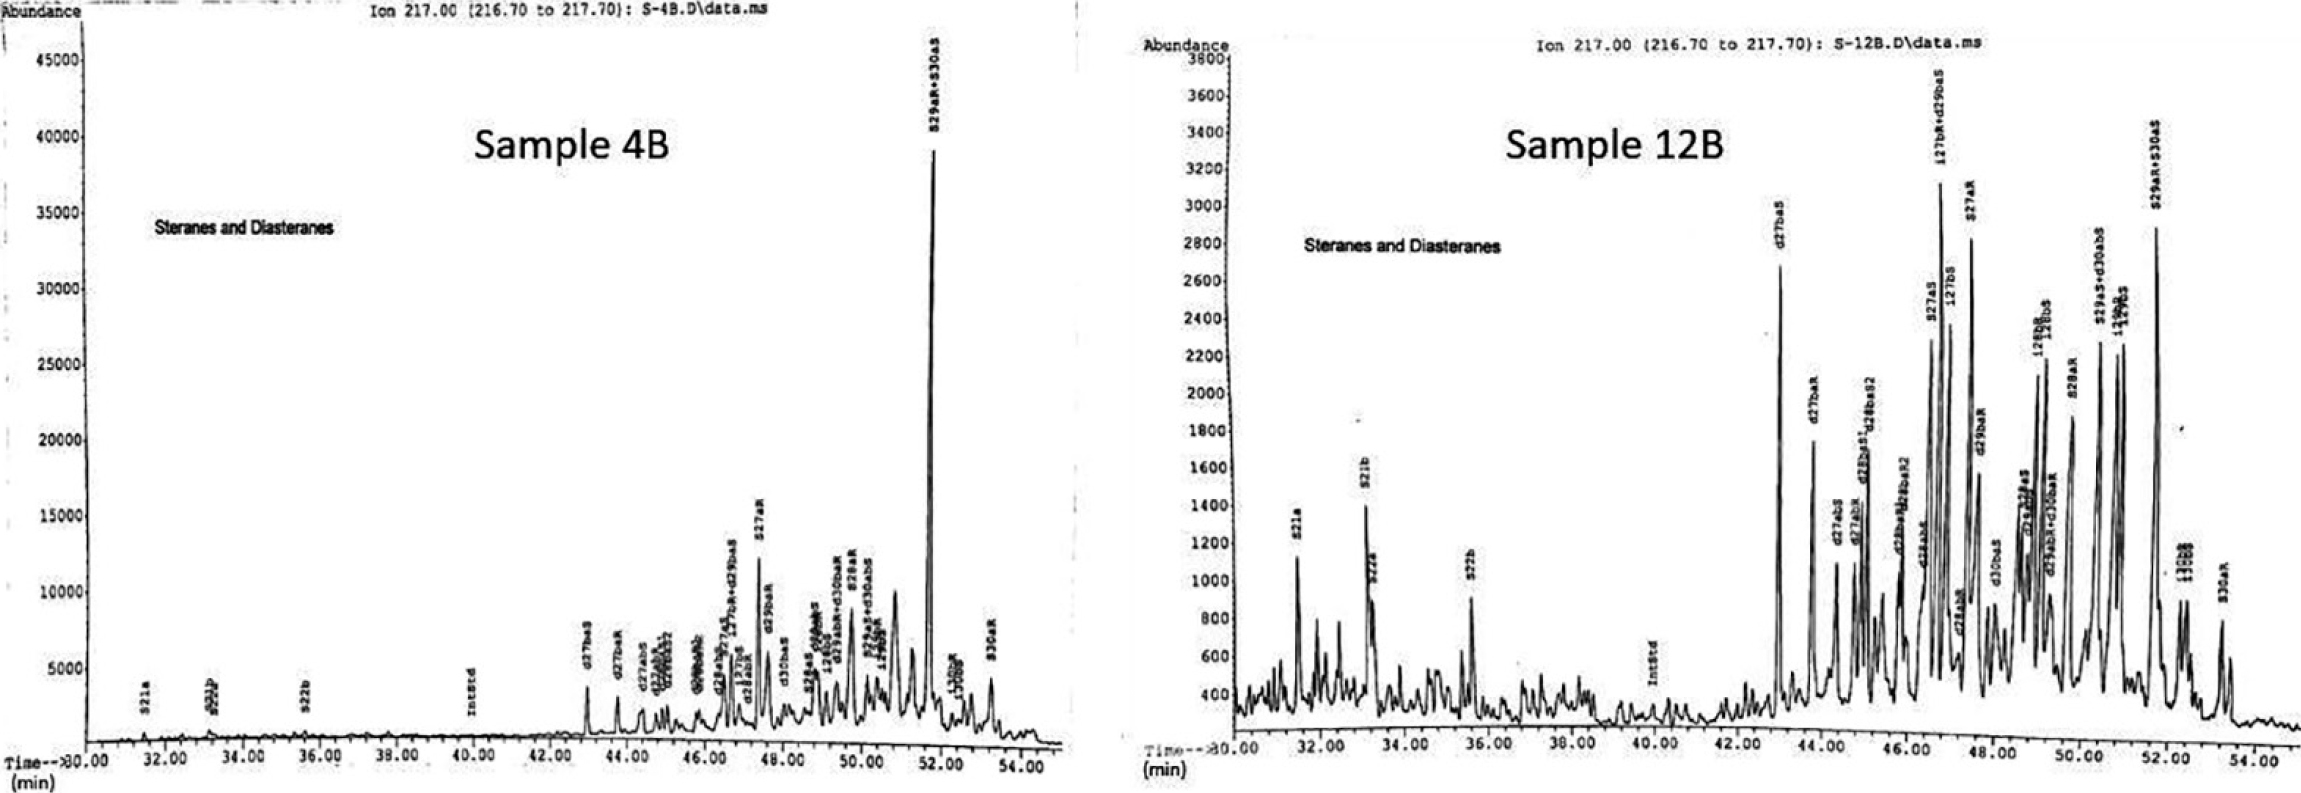
Figure 9:
m/z 217 mass chromatograms showing the distribution of steranes and diasteranes in the selected samples 4B and 12B.
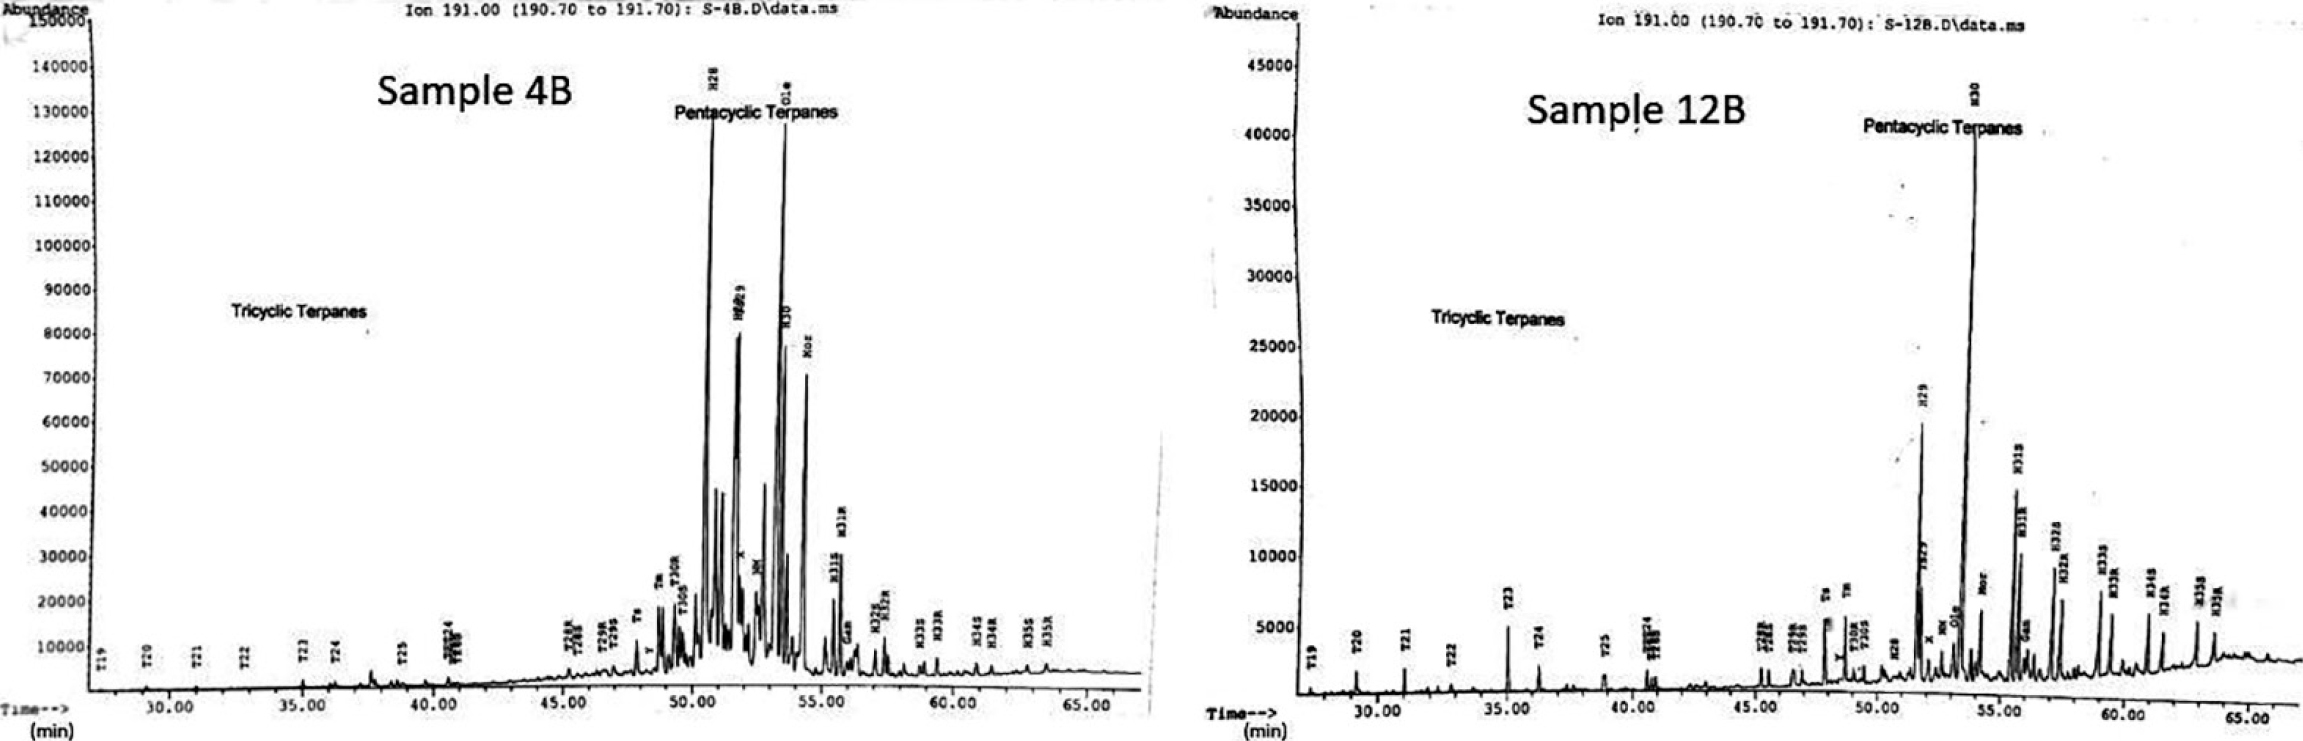
Figure 10:
m/z 191 mass chromatograms showing the distribution of terpanes and hopanes in the EE-1 Well samples 4B and 12B.12B.
Table 3:
Biomarker maturity parameters computed for the studied well samples.
| Sample ID | Ts /Tm | Mor / Hop | αββ/αββ+ααα C29 Sterane | 22S/22S+22R | MPI-1 | DMN | TMN-1 | MDBT |
|---|---|---|---|---|---|---|---|---|
| 1B | 0.22 | 0.26 | 0.28 | 0.37 | 1.72 | 3.56 | 0.89 | 2.98 |
| 2B | 0.25 | 0.26 | 0.25 | 0.34 | 1.46 | 2.96 | 0.73 | 3.35 |
| 4B | 0.35 | 0.48 | 0.06 | 0.40 | 1.75 | 4.19 | 0.91 | 2.83 |
| 6B | 0.32 | 0.29 | 0.21 | 0.38 | 1.37 | 4.04 | 1.13 | 3.11 |
| 7B | 0.27 | 0.22 | 0.24 | 0.42 | 1.41 | 3.53 | 0.97 | 6.21 |
| 8B | 0.34 | 0.18 | 0.23 | 0.46 | 1.35 | 2.25 | 1.06 | 1.81 |
| 9B | 0.32 | 0.16 | 0.18 | 0.48 | 1.48 | 3.74 | 1.05 | 1.98 |
| 10B | 0.35 | 0.14 | 0.30 | 0.57 | 1.12 | 3.01 | 1.17 | 0.82 |
| 11B | 0.48 | 0.13 | 0.34 | 0.60 | 1.16 | 3.33 | 0.79 | 1.07 |
| 12B | 0.50 | 0.11 | 0.44 | 0.58 | 1.01 | 3.25 | 0.67 | 1.51 |
| 14B | 0.44 | 0.14 | 0.35 | 0.58 | 1.28 | 4.96 | 1.11 | 2.19 |
| 15B | 0.45 | 0.10 | 0.42 | 0.59 | 1.32 | 4.36 | 0.79 | 1.47 |
1 Abbreviations: Ts/(Ts+Tm), trisnorneohopanes/trisnorhopanes ratio; Mor/Hop, 17β, 21α (H)Mortane/17 α, 21β (H) hopane ratio; 22S/22S+22R, 22S/22S+22R extended hopanes ratio; MPI-1 - methyl – phenanthrene index, 1,5 (2MP + 3MP) / (P + 1MP + 9MP); DMN – dimethyl naphthalene ratio, 2, 6 DMN + 2,7 DMN)/1,5 DMN; TMN-1 – trimethyl naphthalene ratio, (1,3,7 TMN)/ (1,3,7 TMN + 1,2,5 TMN); MDBT – methyl-dibenzothiopene ratio, 4MDBT/1MDBT.
Table 4:
Source and depositional environment parameters computed from the saturate biomarkers of the EE-1 well.
| Sample ID | %C27 Sterane | %C28 Sterane | %C29 Sterane | C21T/C23T | C23T/C24T | Hop/Ster | dia/reg | Ole/Hop | Gam/Hop | C24 Tet/(C26 (S+R) + C24 Tet) | C25/C26 (S+R) | C35/C31-C35Hom |
|---|---|---|---|---|---|---|---|---|---|---|---|---|
| 1B | 33.50% | 19.68% | 46.82% | 0.58 | 1.49 | 4.13 | 0.18 | 0.1 | 0.08 | 0.52 | 0.69 | 0.06 |
| 2B | 34.79% | 22.11% | 43.10% | 0.8 | 1.59 | 2.99 | 0.15 | 0.11 | 0.1 | 0.49 | 0.54 | 0.14 |
| 4B | 27.36% | 19.31% | 53.33% | 0.49 | 1.33 | 1.98 | 0.28 | 0.62 | 0.04 | 0.6 | 0.48 | 0.05 |
| 6B | 33.10% | 20.73% | 46.18% | 0.82 | 1.66 | 1.62 | 0.21 | 0.42 | 0.05 | 0.62 | 0.89 | 0.05 |
| 7B | 33.35% | 20.97% | 45.68% | 0.78 | 1.39 | 3.65 | 0.27 | 0.29 | 0.04 | 0.67 | 0.48 | 0.05 |
| 8B | 36.81% | 21.02% | 42.17% | 0.62 | 1.73 | 4.1 | 0.23 | 0.33 | 0.04 | 0.64 | 0.41 | 0.05 |
| 9B | 36.85% | 25.19% | 37.96% | 0.55 | 1.98 | 1.53 | 0.13 | 0.21 | 0.04 | 0.6 | 0.44 | 0.07 |
| 10B | 40.18% | 25.85% | 33.97% | 0.33 | 3.45 | 6.04 | 0.33 | 0.07 | 0.04 | 0.52 | 0.69 | 0.09 |
| 11B | 38.09% | 24.36% | 37.55% | 0.39 | 3.1 | 11.45 | 0.42 | 0.04 | 0.03 | 0.72 | 0.67 | 0.06 |
| 12B | 38.86% | 27.19% | 33.95% | 0.36 | 2.57 | 16.11 | 0.48 | 0.06 | 0.04 | 0.45 | 0.67 | 0.09 |
| 14B | 36.49% | 23.80% | 39.71% | 0.46 | 1.91 | 6.27 | 0.35 | 0.14 | 0.06 | 0.5 | 0.56 | 0.11 |
| 15B | 37.53% | 41.63% | 45.42% | 0.37 | 1.92 | 6.91 | 0.38 | 0.08 | 0.09 | 0.45 | 0.63 | 0.17 |
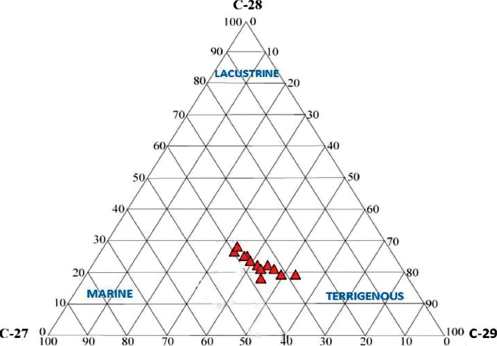
Figure 11:
Ternary plot showing distribution of C27, C8 and C9 steranes for EE-1 Well. (After Huang and Meinschein [49]).