
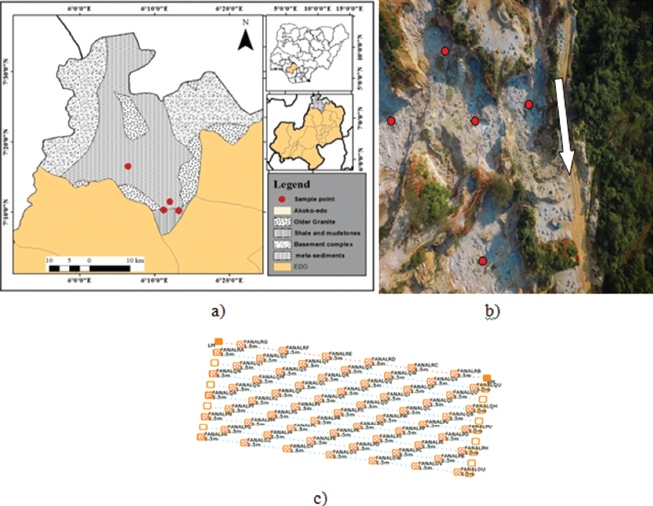
Figure 1:
a) Geological map of Akoko Edo, showing case study area. b) Quarry face showing the sampling points marked with red circles. c) Quarry scheme of the drilling patterns.
Table 1:
Explosive data and information about the quarry
| Parameter | Pit 1 | Pit 2 | Pit 3 | Pit 4 | Pit 5 | Pit 6 |
|---|---|---|---|---|---|---|
| Charge length (m) | 0.65-0.7 | 0.67-0.76 | 0.6-0.76 | 0.6-0.7 | 0.6-0.78 | 0.6-0.8 |
| Type of explosive | Dynogel | Dynogel | Dynogel | Dynogel | Dynogel | Dynogel |
| Density of ANFO (kg/m3) | 820 | 820 | 820 | 820 | 820 | 820 |
| Density of explosive (kg/m3) | 1190 | 1190 | 1190 | 1190 | 1190 | 1190 |
| Powder factor (kg/m3) | 0.8-0.0.9 | 0.0.7-0.8 | 0.5-0.6 | 0.5-0.86 | 0.6-1.0 | 0.7-0.85 |
| RWS | 1.45 | 1.45 | 1.45 | 1.45 | 1.45 | 1.45 |
| VOD (m/s) | 5250 | 5250 | 5250 | 5250 | 5250 | 5250 |
| Explosive strength | 1.45 | 1.45 | 1.45 | 1.45 | 1.45 | 1.45 |
Table 2:
Blast design parameters for the quarry
| Parameter | Pit 1 | Pit 2 | Pit 3 | Pit 4 | Pit 5 | Pit 6 |
|---|---|---|---|---|---|---|
| Burden(m) | 0.7 | 0.82 | 0.85 | 0.85 | 0.7 | 0.85 |
| Spacing (m) | 0.85 | 0.96 | 1.10 | 1.1 | 1.0 | 1.1 |
| Hole depth (m) | 1.25 | 1.3 | 1.35 | 1.3 | 1.35 | 1.35 |
| Drill pattern | staggered | Staggered | staggered | staggered | staggered | square |
| Hole diameter (m) | 0.04 | 0.04 | 0.04 | 0.04 | 0.04 | 0.04 |
| Drill hole depth (m) | 1.25 | 1.3 | 1.35 | 1.3 | 1.35 | 1.3 |
| Stemming (m) | 0.65 | 0.7 | 0.66 | 0.66 | 0.7 | 0.6 |
| Drilling accuracy | 0.054 | 0.054 | 0.054 | 0.054 | 0.054 | 0.054 |
| Charge length (m) | 0.65-0.7 | 0.67-0.76 | 0.6-0.76 | 0.6-0.7 | 0.6-0.78 | 0.6-0.8 |
| Charge weight (kg) | 0.96-1.02 | 0.80-0.95 | 0.9-1.14 | 0.8-0.85 | 0.6-0.8 | 0.65-0.85 |
| Crusher gap (m) | 0.28 | 0.28 | 0.28 | 0.28 | 0.28 | 0.28 |
Table 3:
Summary of the rock characterization of Golden Girl Quarry
| Parameter | Pit 1 | Pit 2 | Pit 3 | Pit 4 | Pit 5 | Pit 6 |
|---|---|---|---|---|---|---|
| Uniaxial compressive strength (MPa) | 173.75 | 178.75 | 171.25 | 167.75 | 168.75 | 186.25 |
| Joint spacing (m) | 0.76 | 0.26 | 0.64 | 0.20 | 0.32 | 0.28 |
| Dip direction (0) | 298 | 312 | 260 | 034 | 312 | 064 |
| Dip angle (0) | 58 | 30 | 74 | 42 | 48 | 78 |
| Rock density (kg/m3) | 2804 | 2790 | 2886 | 2760 | 2860 | 2800 |
| Young modulus (GPa) | 60 | 75 | 75 | 68.5 | 60 | 75 |
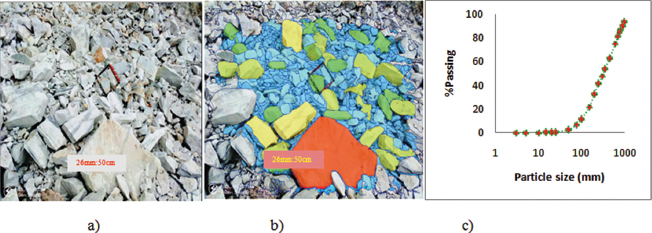
Figure 2:
a) Blast image with 1 m by 1 m scaling frame and image scale, b) Delineated image with scale, and c) WipFrag result particle size distribution curve.
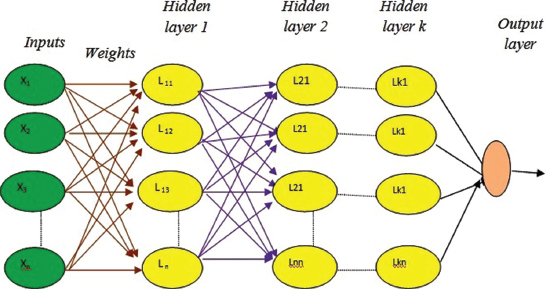
Figure 3:
ANN connection network structure.
Table 4:
Input parameters and their symbols
| Parameter | Symbol | Range | Parameter | Symbol | Range |
|---|---|---|---|---|---|
| UCs | U | 160-186.25Mpa | % oversize | Q | 23.3%-70% |
| Density | M | 2800-2886 kg/m3 | % undersize | Y | 32%-72.1% |
| Spacing | S | 0.8-1.1 m | Mean size (mm) | V | 220%--480 mm |
| Hole depth | D | 1.25-1.35 m | |||
| Stemming length | T | 0.6-0.7 m | |||
| Hole diameter | H | 0.04 m | |||
| Powder factor | K | 0.6-1.0 kg/m3 | |||
| Charge weight | W | 0.6-0.96 kg | |||
| Burden | B | 0.7-0.85 m |
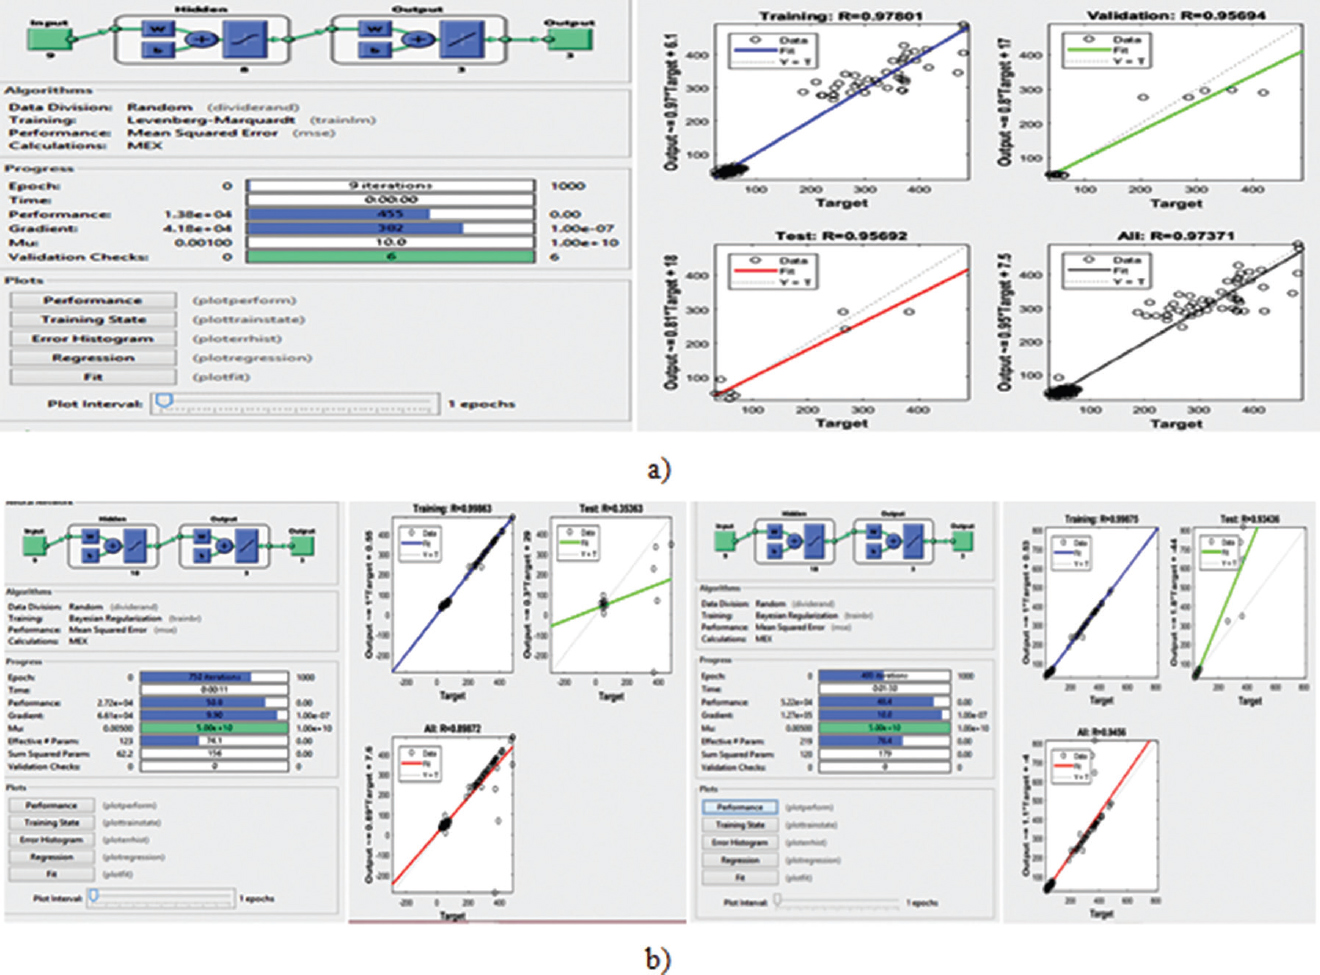
Figure 4:
a) Levenberg-Marquardt models architecture and network regression curves, b) Bayesian regularization algorithm models architecture and network regression curves.
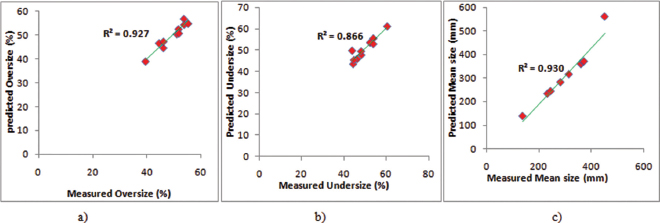
Figure 5:
Relationship between predicted and measured a) percent oversize; b) percent undersize; c) mean size using ANN.
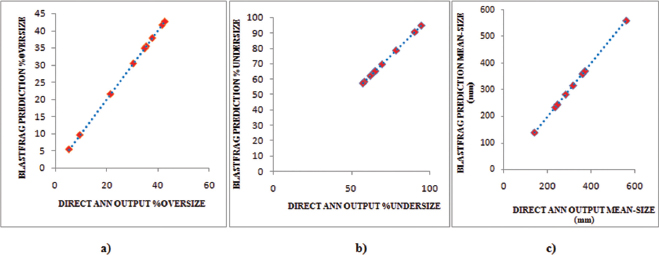
Figure 6:
Comparison of the ANN simulation input with the software (a) %oversize; (b) %undersize; (c) mean size.
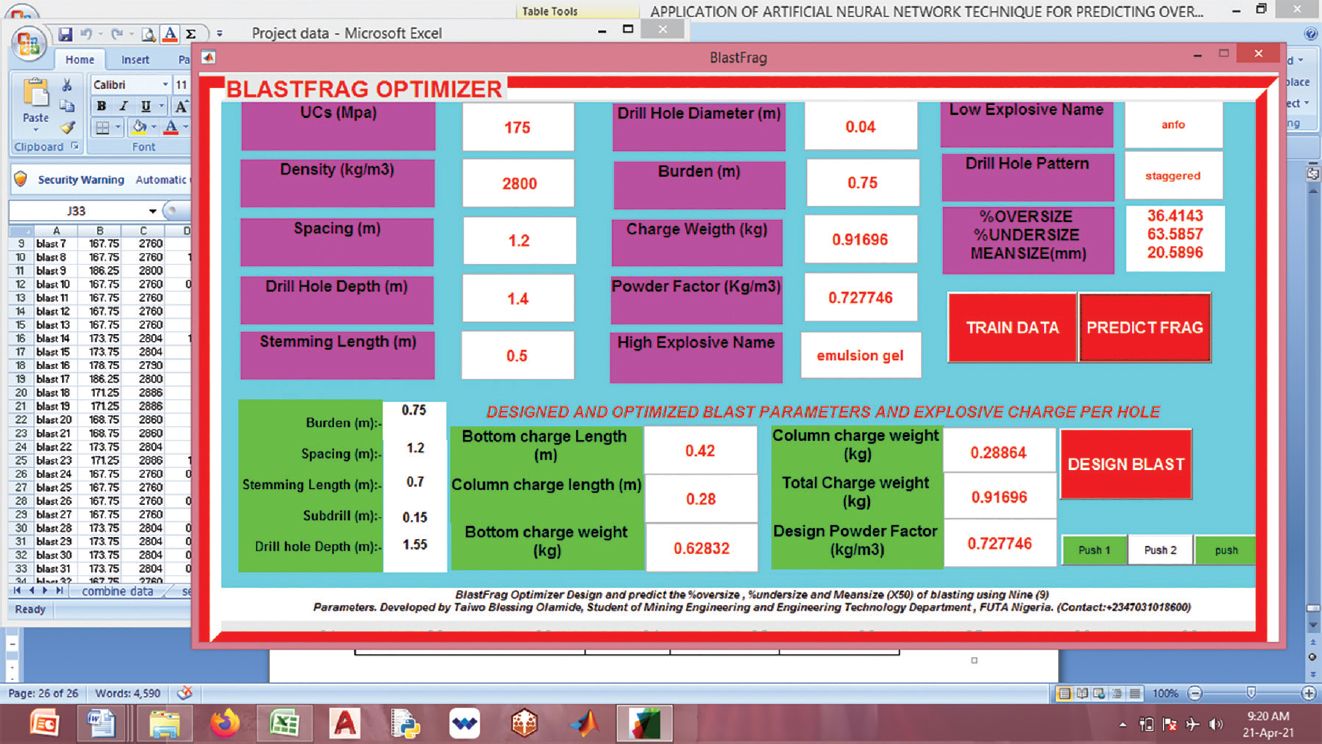
Figure 7:
BlastFrag optimizer user interface.
Table 6:
Computed RMSE and R2 for comparing ANN and modified KUZ-RAM models
| Models | Blasting Parameters | R2 | RMSE |
|---|---|---|---|
| ANN model | Oversize (%) | 0.927 | 1.09 |
| Undersize (%) | 0.866 | 1.14 | |
| Mean-size (mm) | 0.930 | 3.46 | |
| Modified | Oversize (%) | 0.111 | 4.48 |
| Kuz-Ram model | Undersize (%) | 0.073 | 4.58 |
| Mean-size (mm) | 0.157 | 14.03 |
Table 7:
Blasting output statistics and cost per hole blast
| Blast parameters | Blast before ANN model design | Blast with BlastFrag model design |
|---|---|---|
| Diameter (mm) | 0.04 | 0.04 |
| Burden (m) | 0.7 | 0.8 |
| Spacing (m) | 1.1 | 1.2 |
| Drill hole length (m) | 1.3 | 1.4 |
| Rock average specific gravity | 2.8 | 2.8 |
| Production per hole blasted (Tonnes) | 2.59 | 3.76 |
| Percent oversize | 68.4% | 27.83% |
| Percent undersize | 50% | 72.17% |
| Mean size (mm) | 418.0 | 101.6 |
| Profit from blast per hole (Naira) | 10,360 | 15,040 |
| Cost per hole charge (Naira) | 1000 | 950 |