
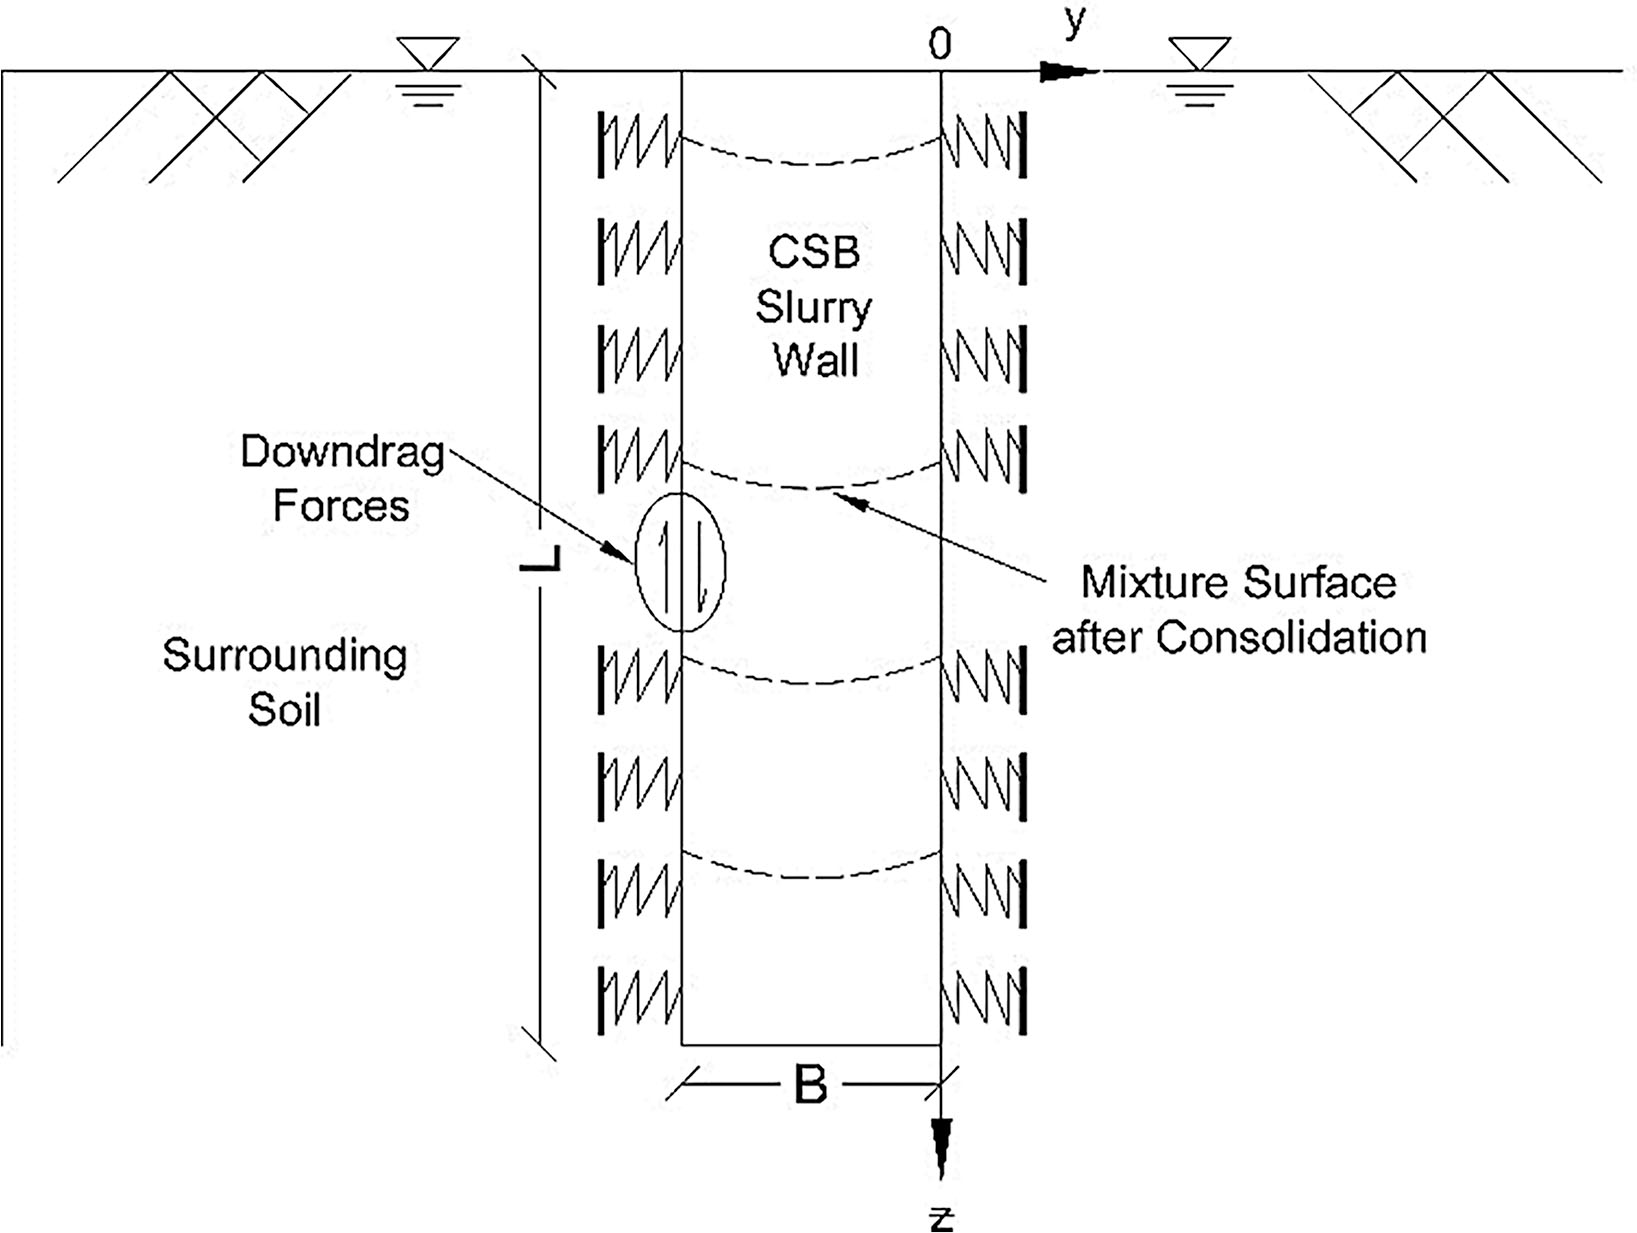
Figure 1:
Schematic of the sidewall friction on the stress distribution in a CSB slurry wall.
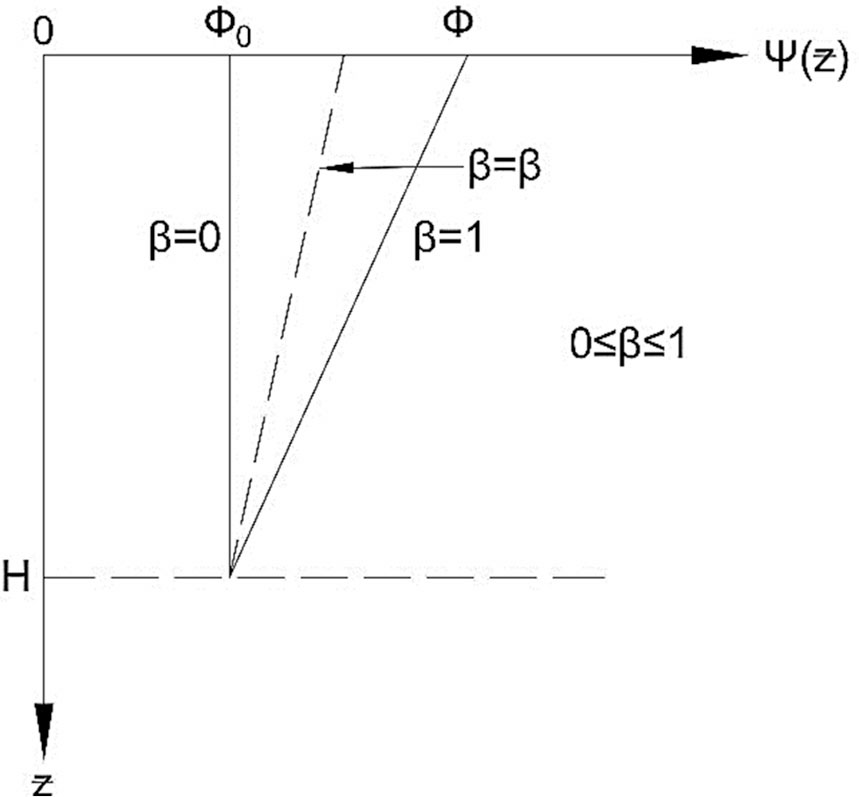
Figure 2:
Transition of ψ(z) from Ø 0 to Ø with depth [10].
Table 1.
Consolidation and index properties.
| Parameter | Unit | C50-S50-B5 | C50-S45-L5-B9 | ||||
|---|---|---|---|---|---|---|---|
| Curing age (days) | |||||||
| 7 | 28 | 7 | 28 | ||||
| Value | |||||||
| Gs | / | 2.76 | 2.70 | ||||
| LL | % | 42 | 62 | ||||
| PI | % | 15 | 38 | ||||
| Clay Size | % | 17 | 17 | ||||
| Silt Size | % | 67 | 73 | ||||
| Sand Size | % | 16 | 10 | ||||
| Cv | cm2/s | 2.03×10⁻³ | 1.24×10⁻³ | 3.34×10⁻⁴ | 3.0×10⁻³ | ||
| (qu) | kPa | 78 | 380 | 80 | 505 | ||
Table 2.
Geometric and mixture properties.
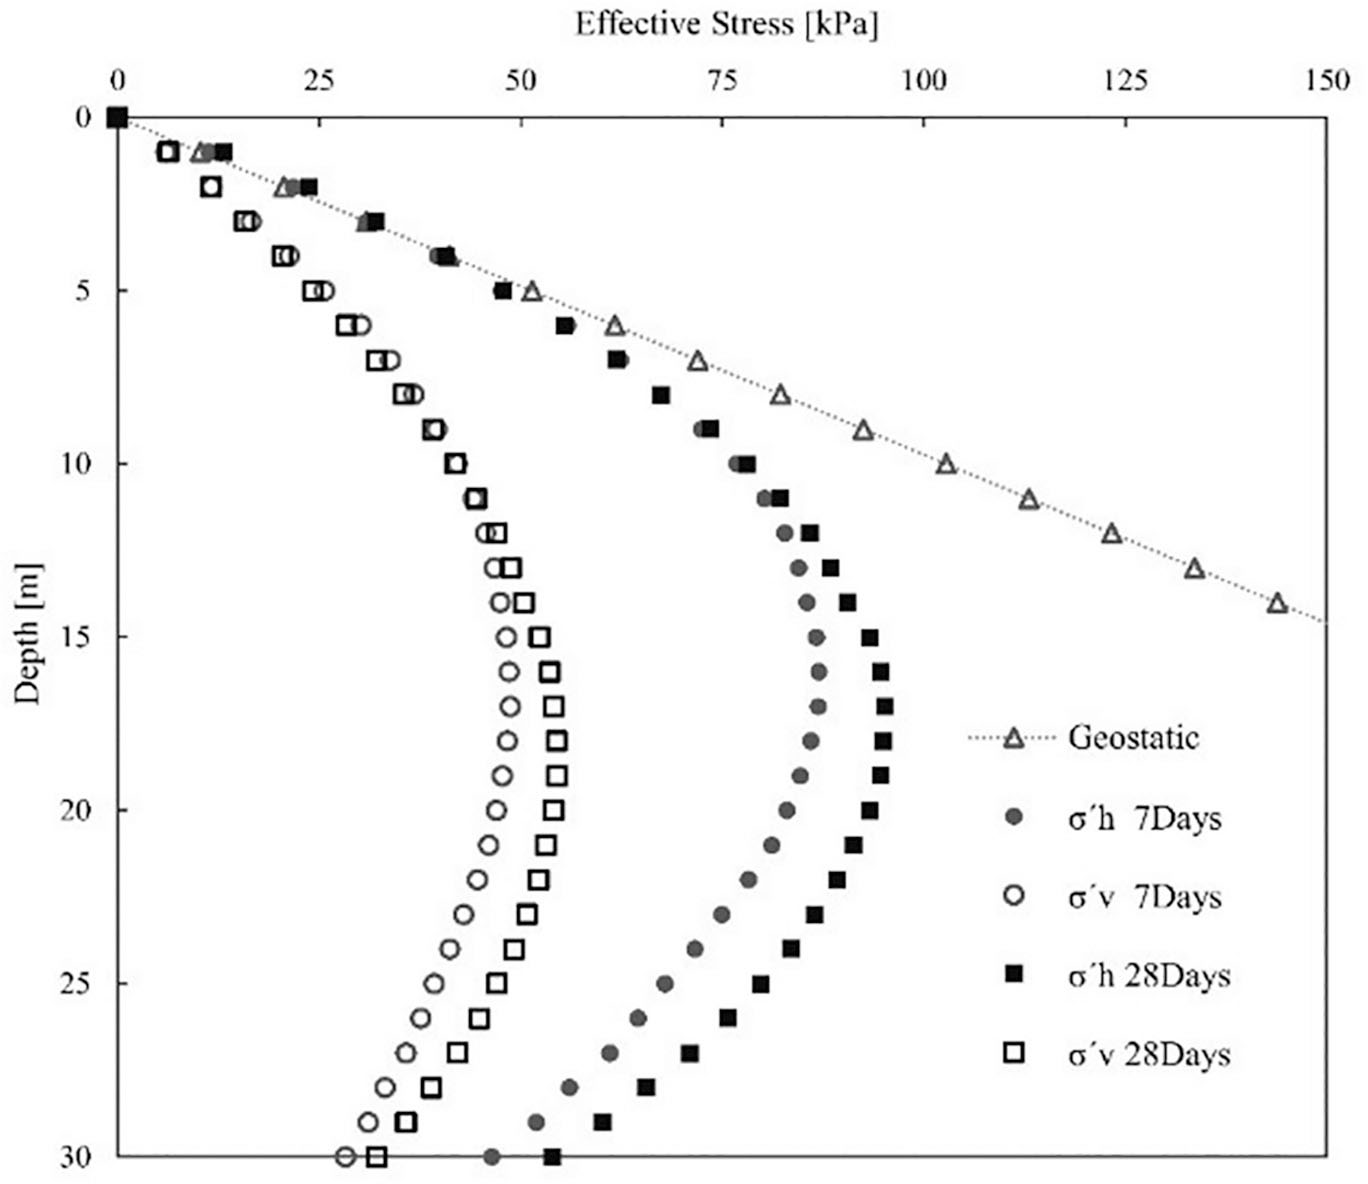
Figure 3:
Effective stress values for the C50-S50-B5 mixture.
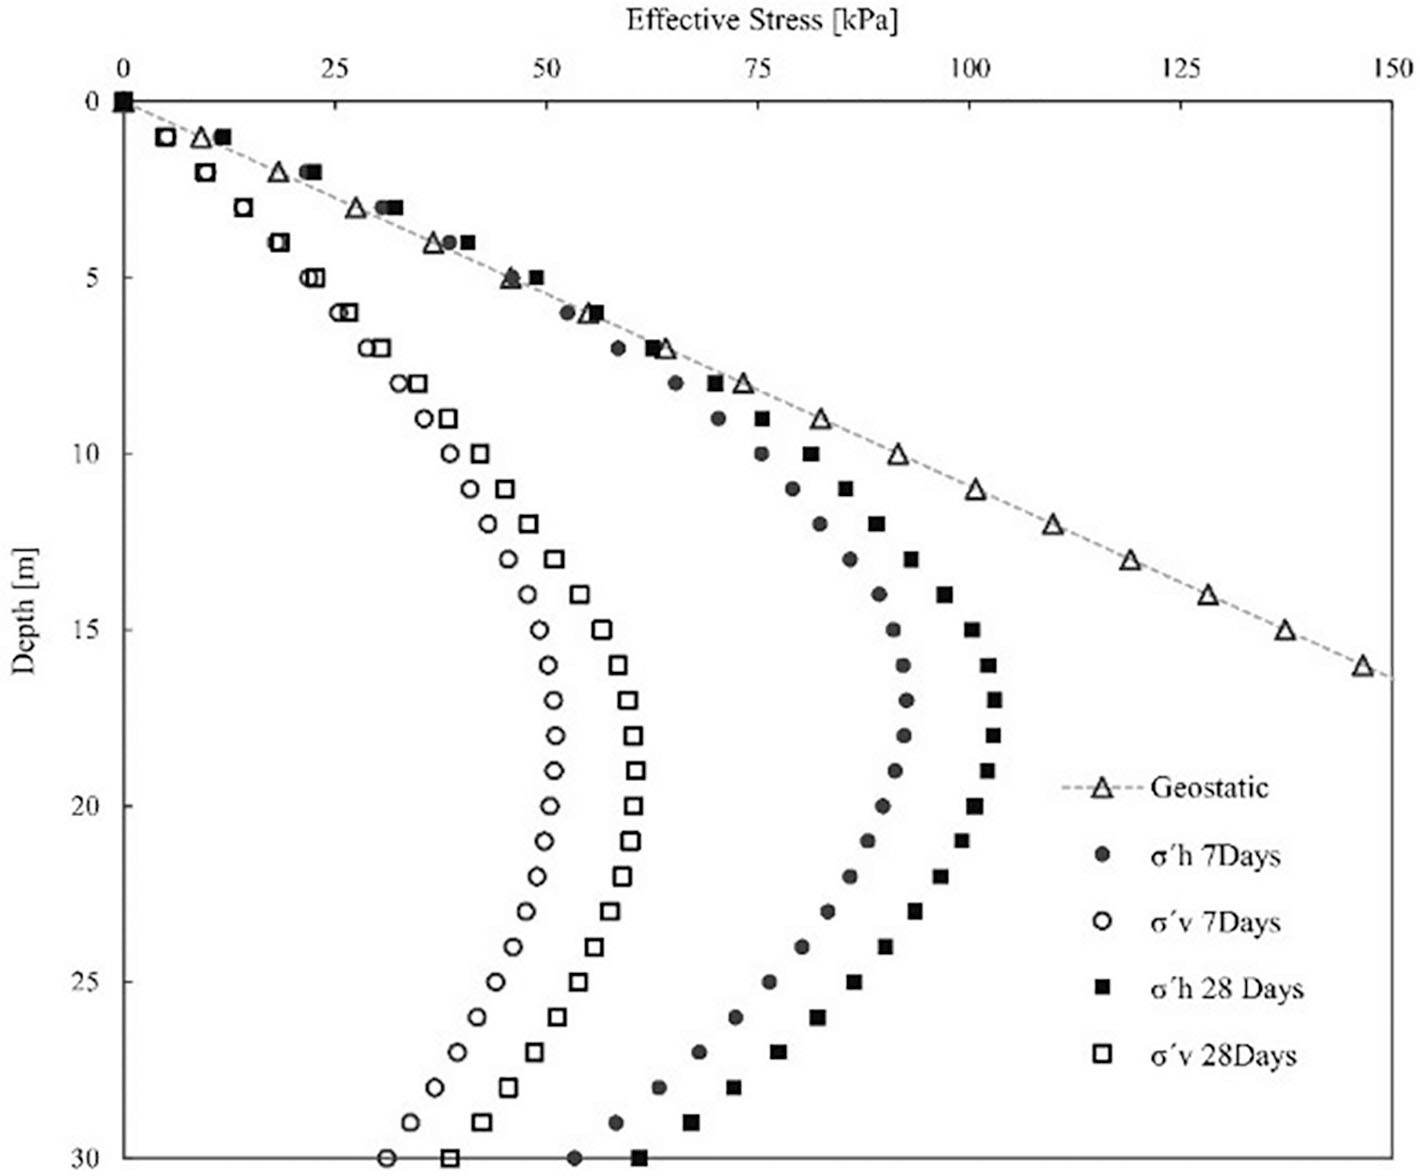
Figure 4:
Effective stress values for the C50-S45-L5-B9 mixture.
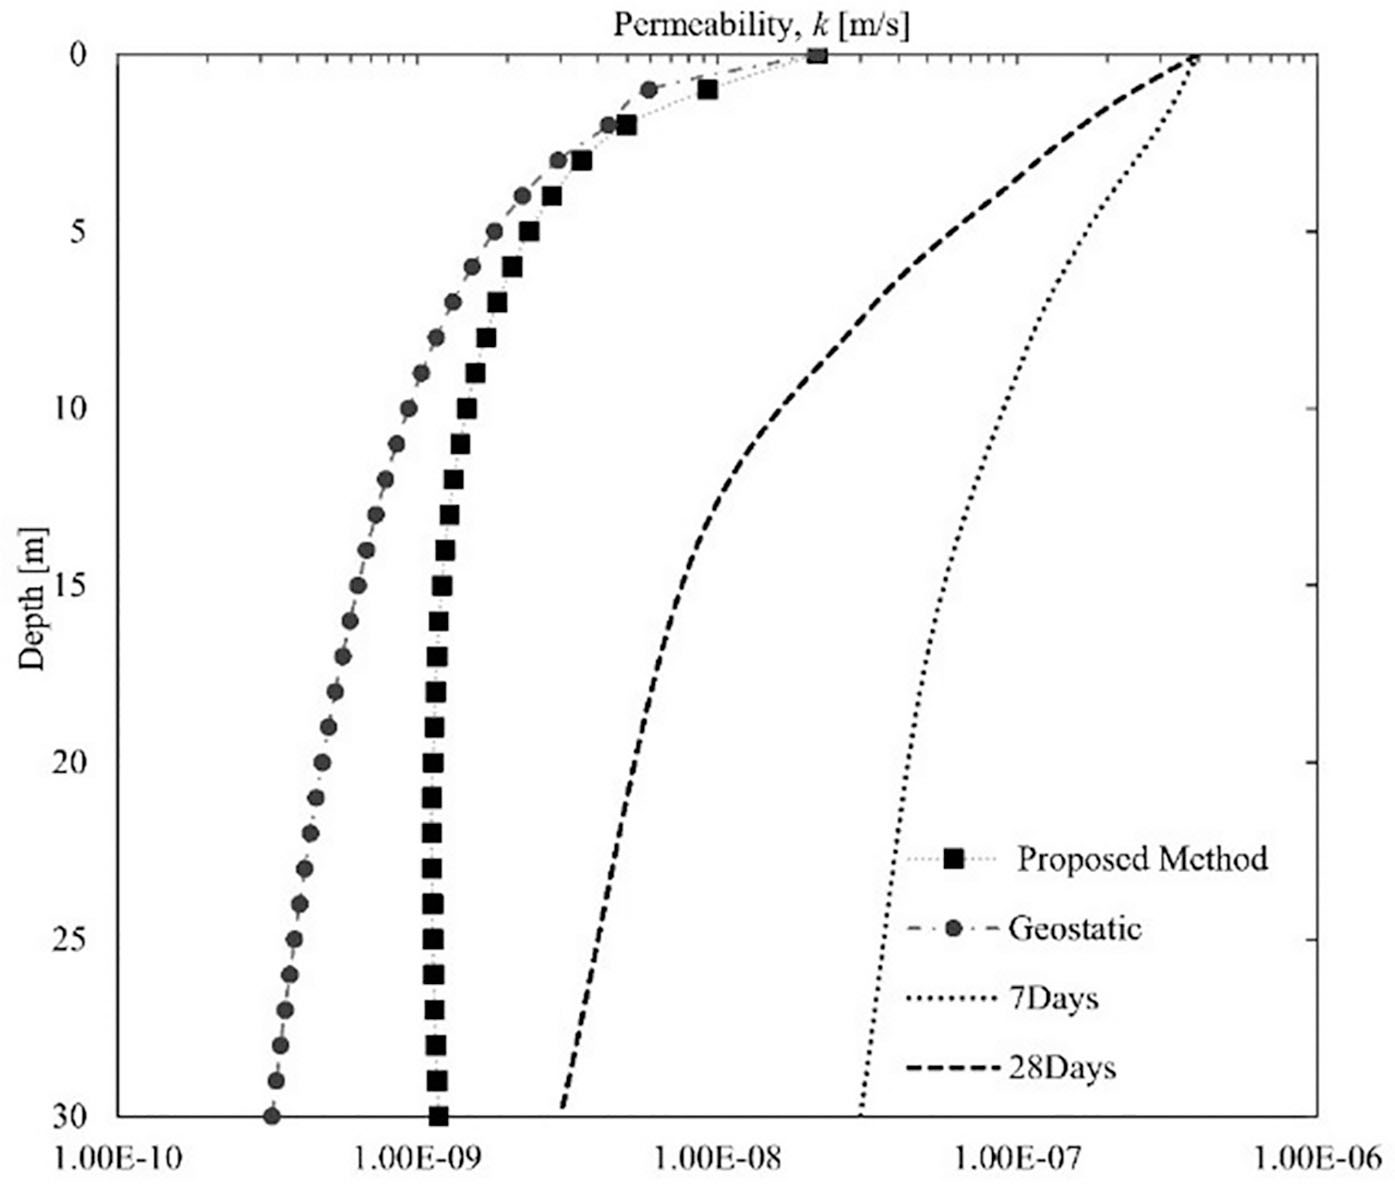
Figure 5:
Estimated permeability and laboratory test results for the C50-S50-B5 mixture.
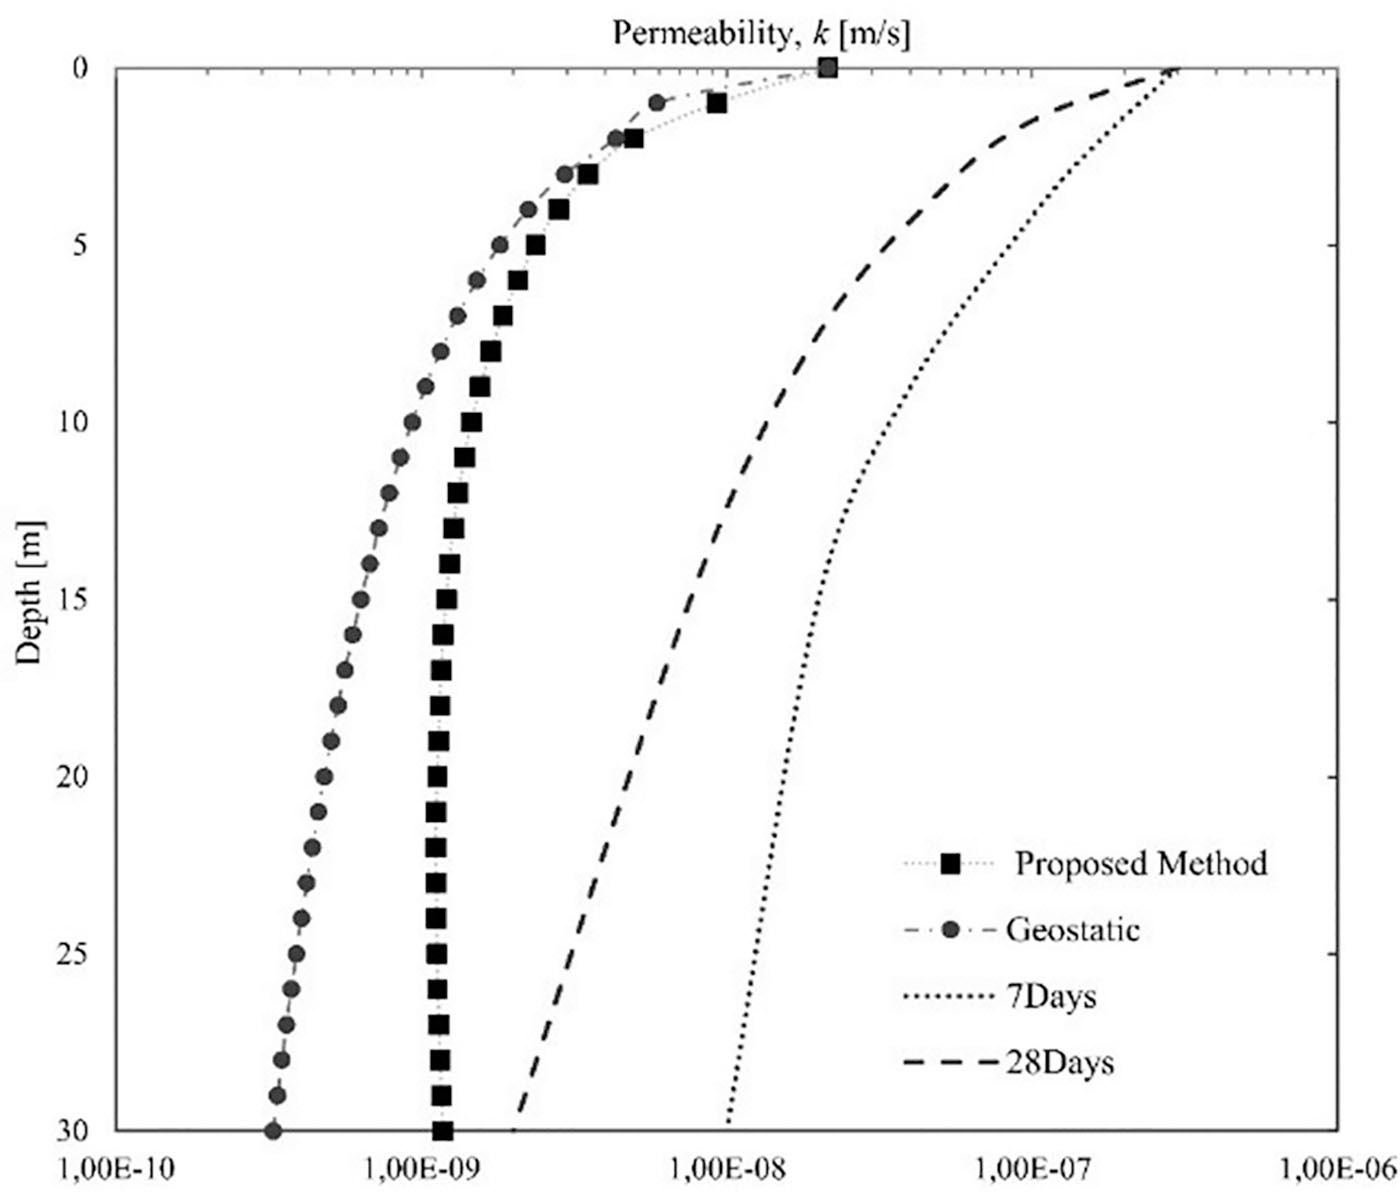
Figure 6:
Estimated permeability and laboratory test results for the C50-S45-L5-B9 mixture.