
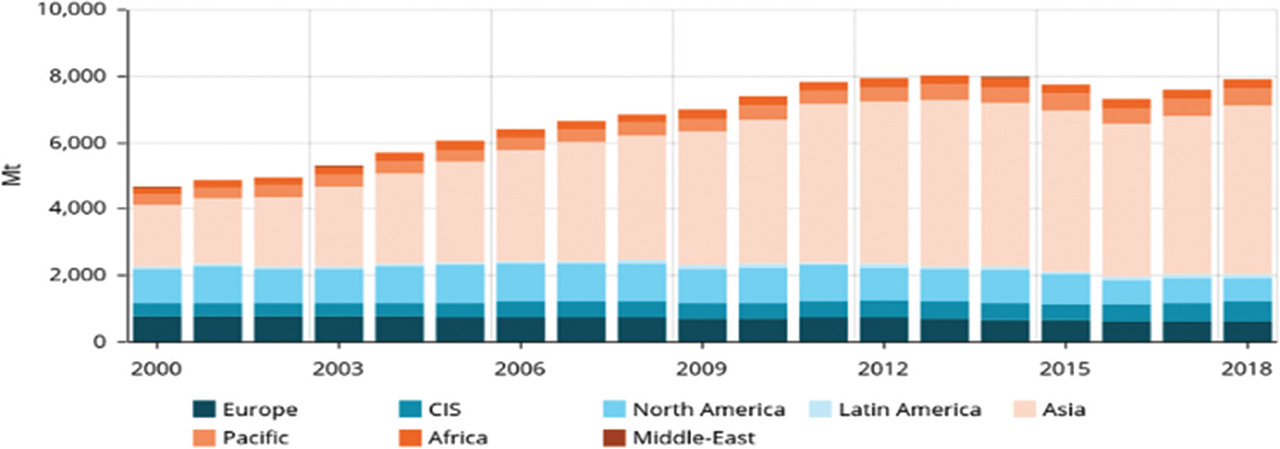
Figure 1:
Worldwide coal consumption [1].
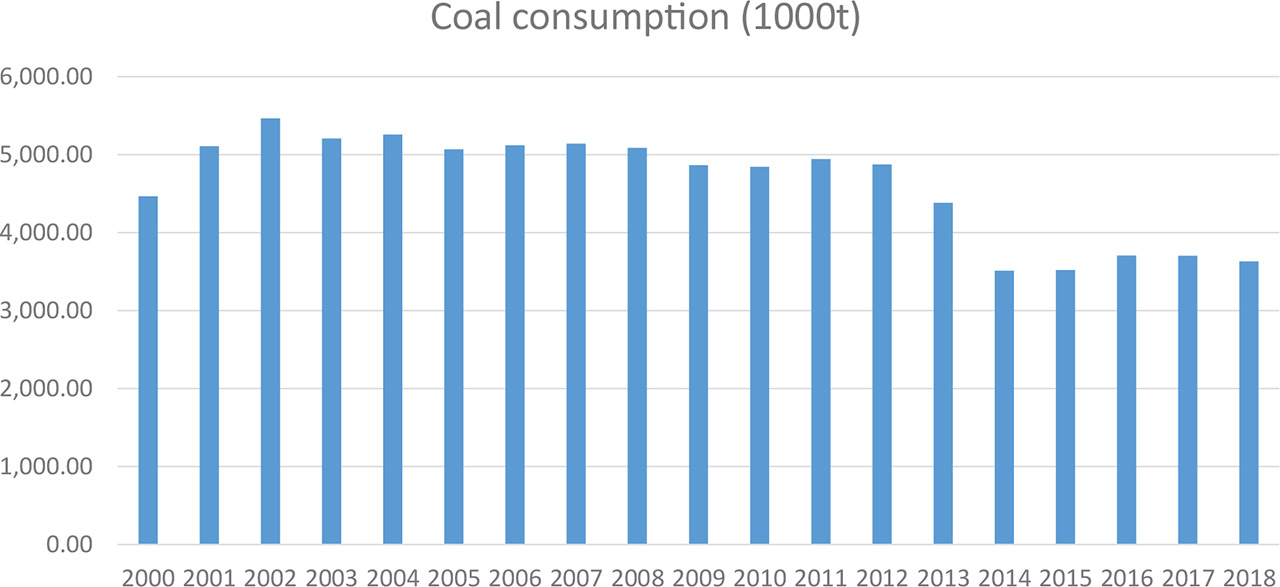
Figure 2:
Coal consumption in Slovenia [7].
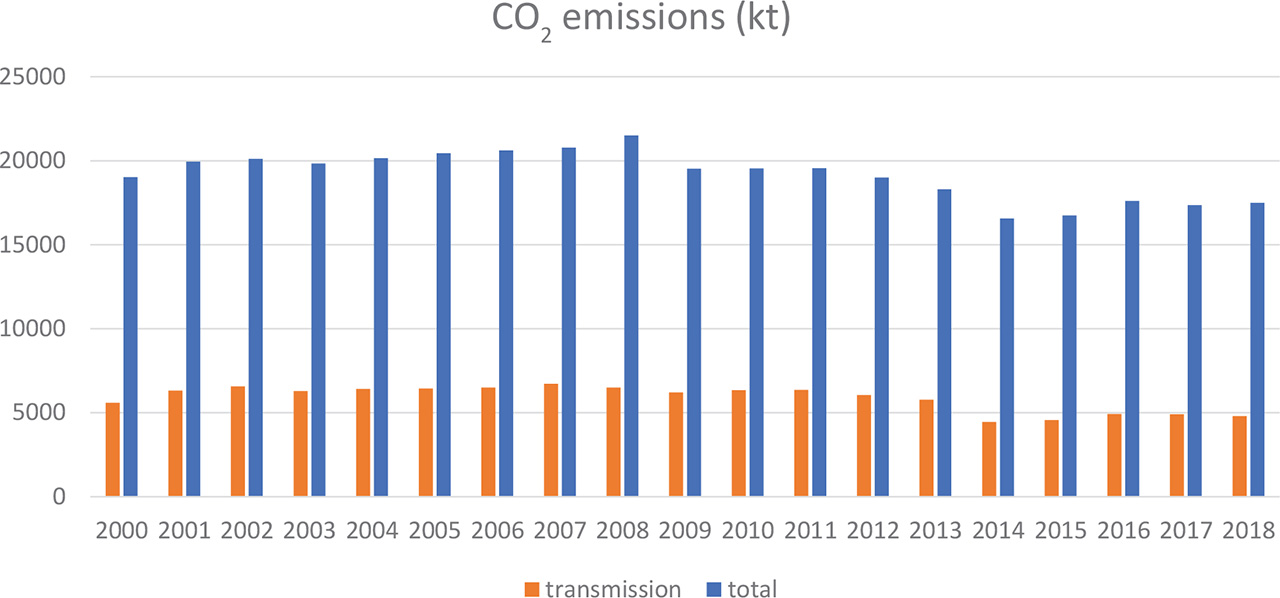
Figure 3:
Amount of CO2 emissions [3].
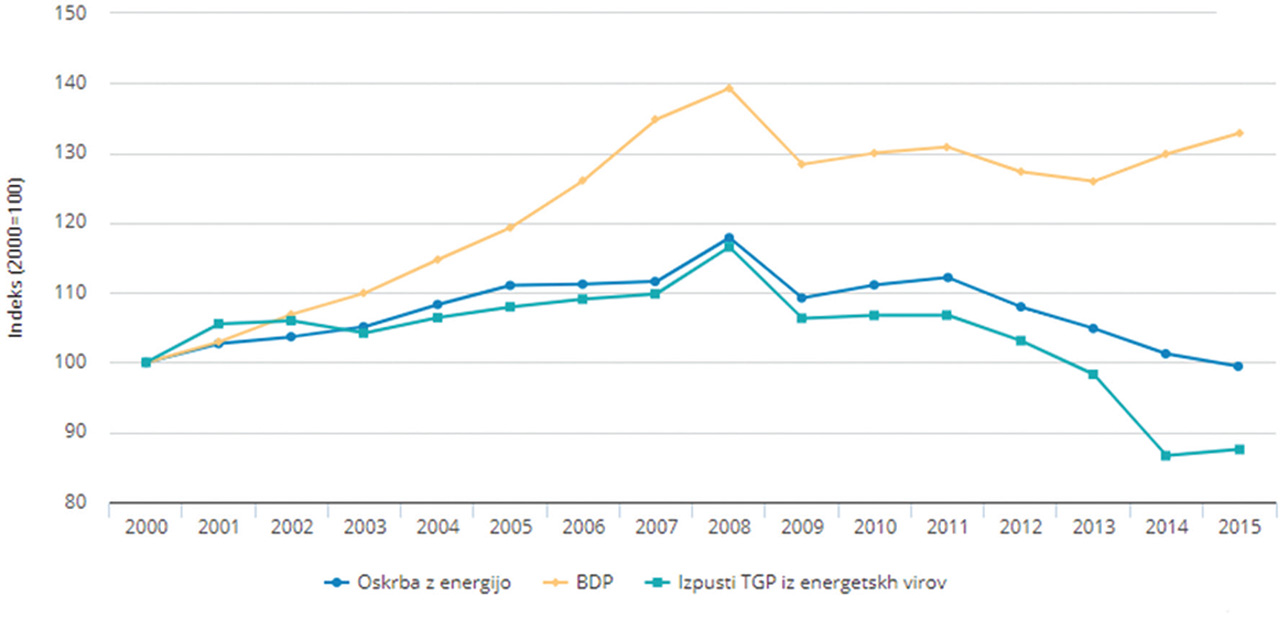
Figure 4:
Trends in GHG emissions from energy sources, gross domestic product and energy supply in the period 2000–2015 [3].
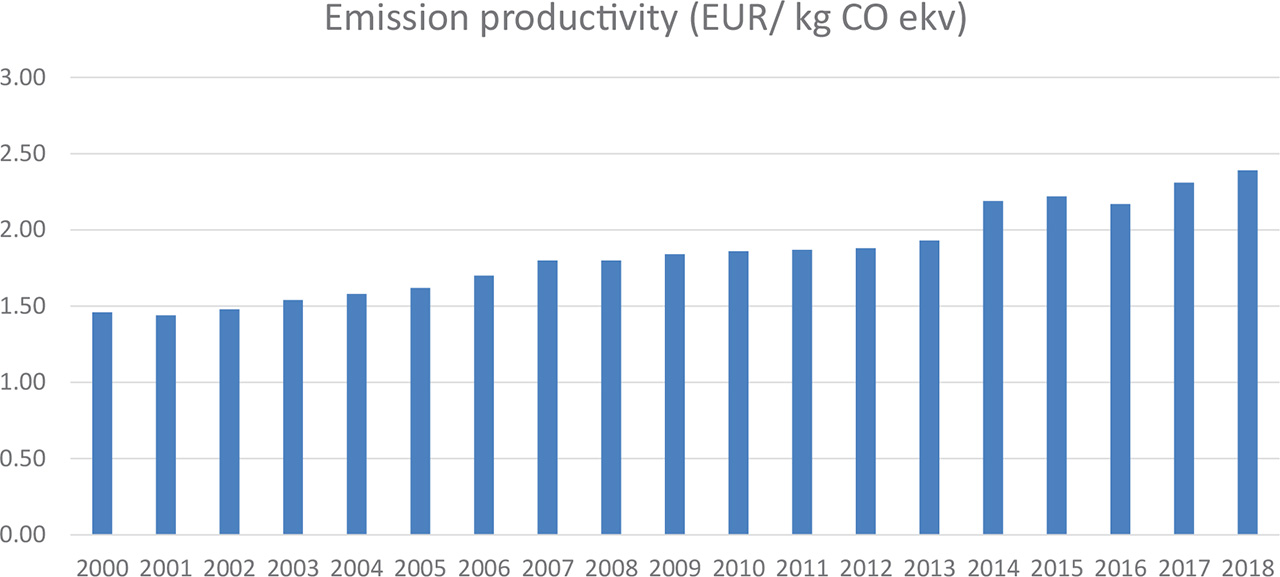
Figure 5:
Emission productivity in Slovenia [3].
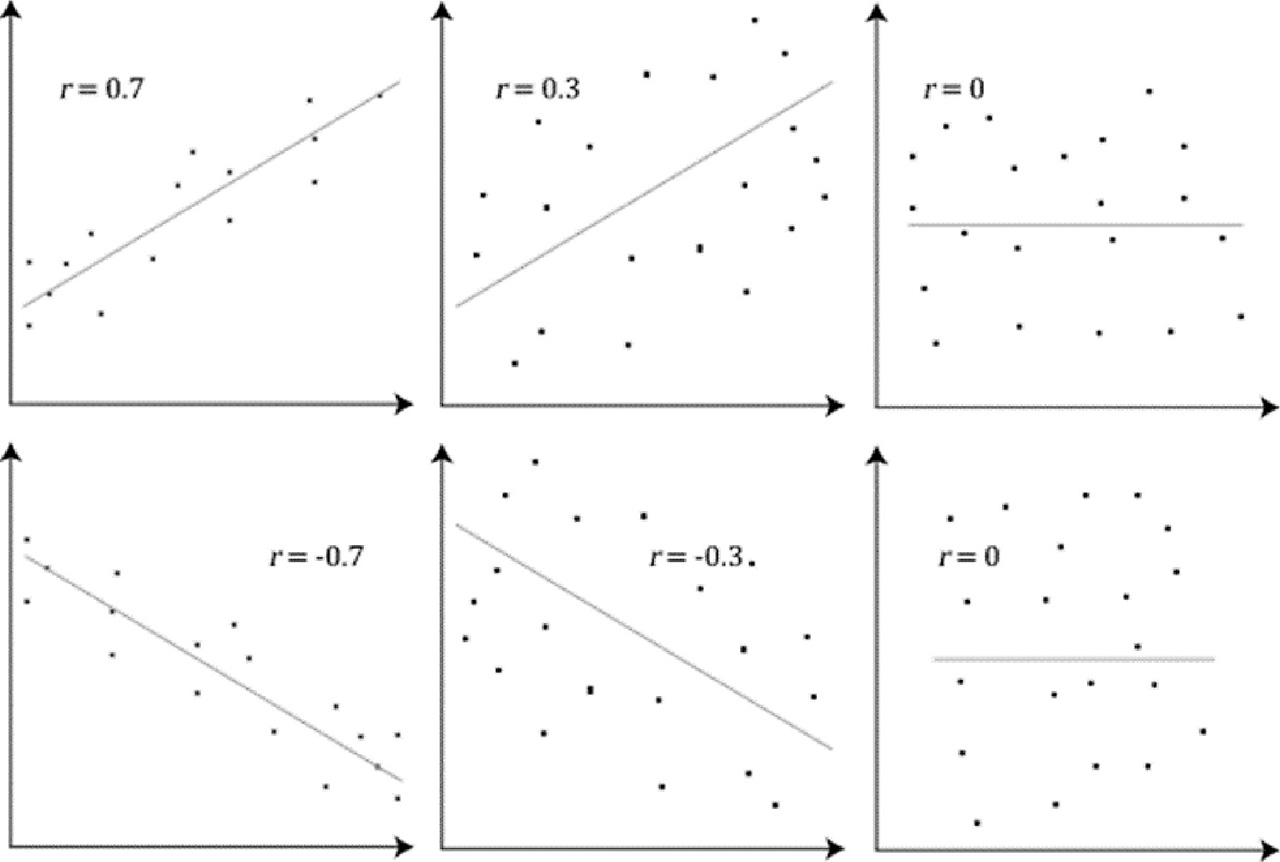
Figure 6:
Correlation coefficient strength [10].
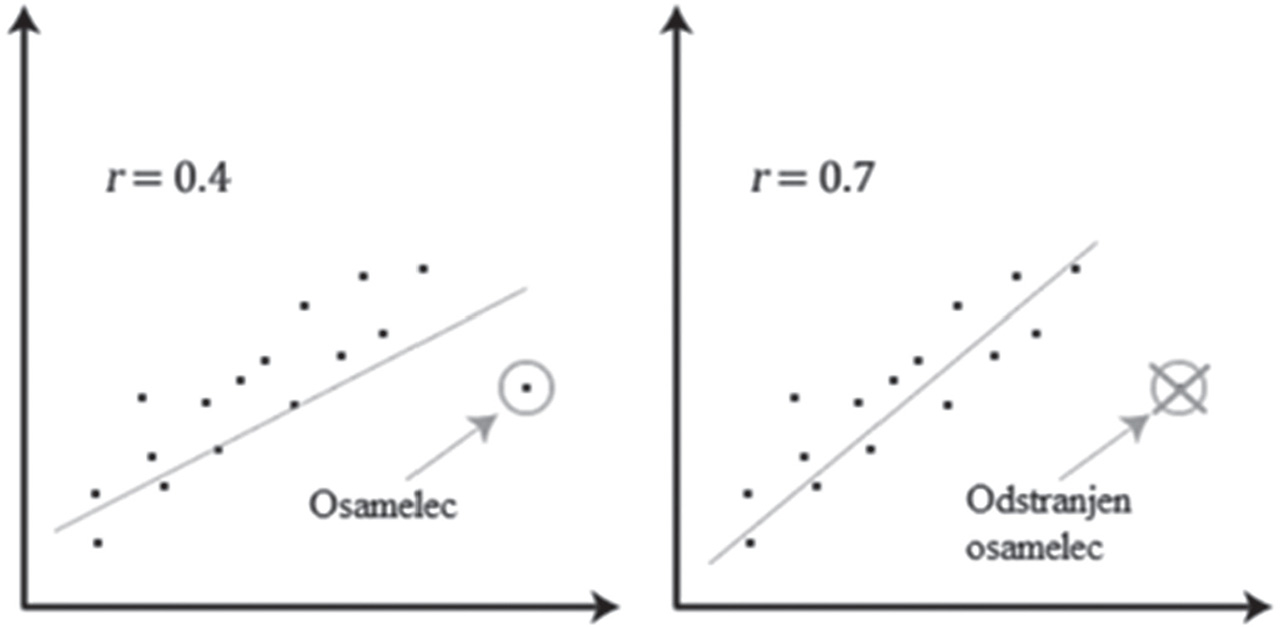
Figure 7:
Removing the outlier [11].
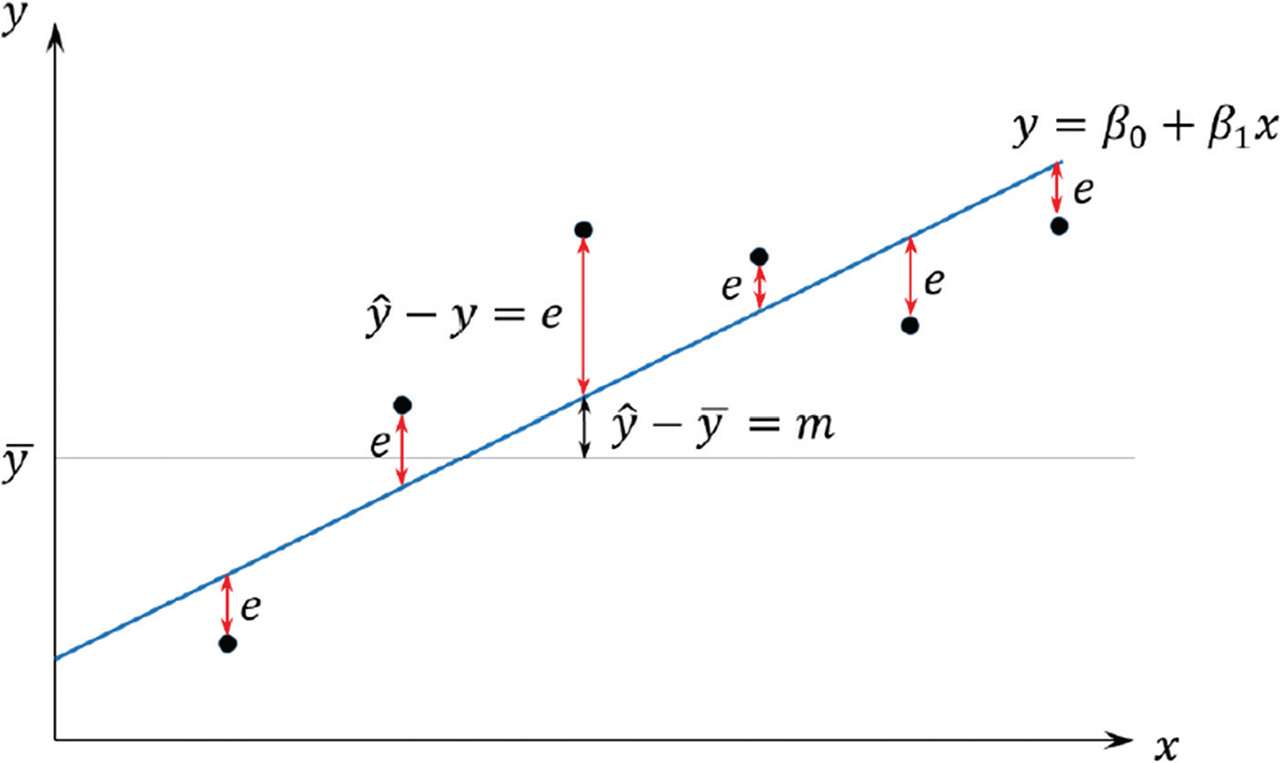
Figure 8:
Deviations of points from the line and deviation of the line from the mean [10].
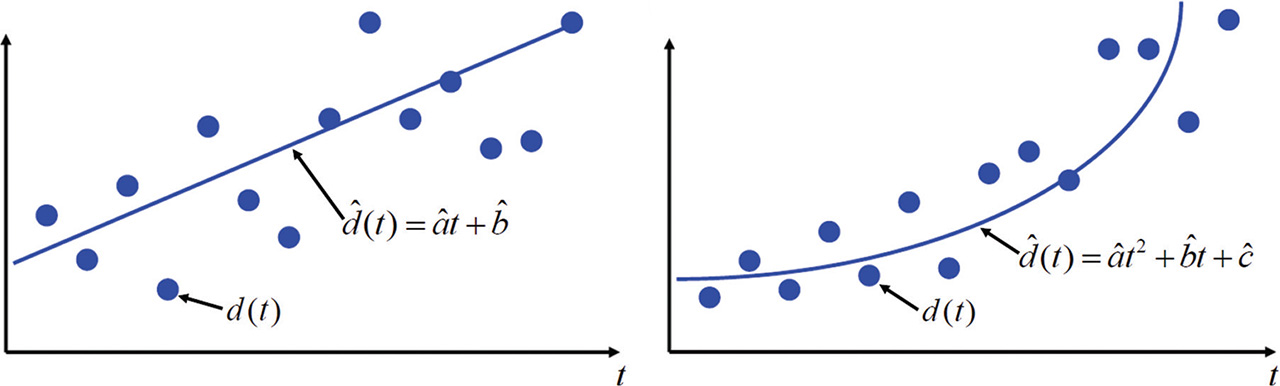
Figure 9:
1st- and 2nd-order linear regressions [10].
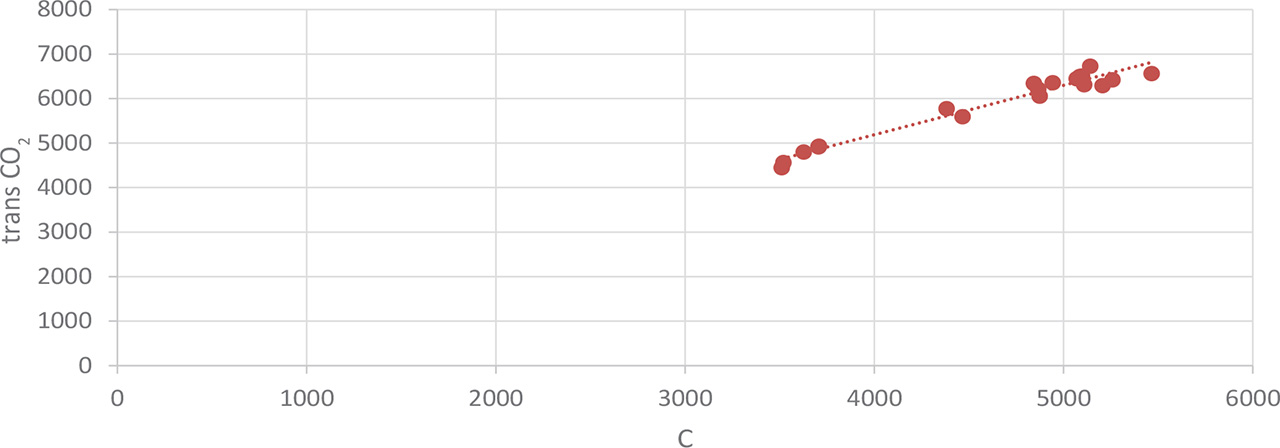
Figure 10:
Emissions of transmission depending on the use of coal.
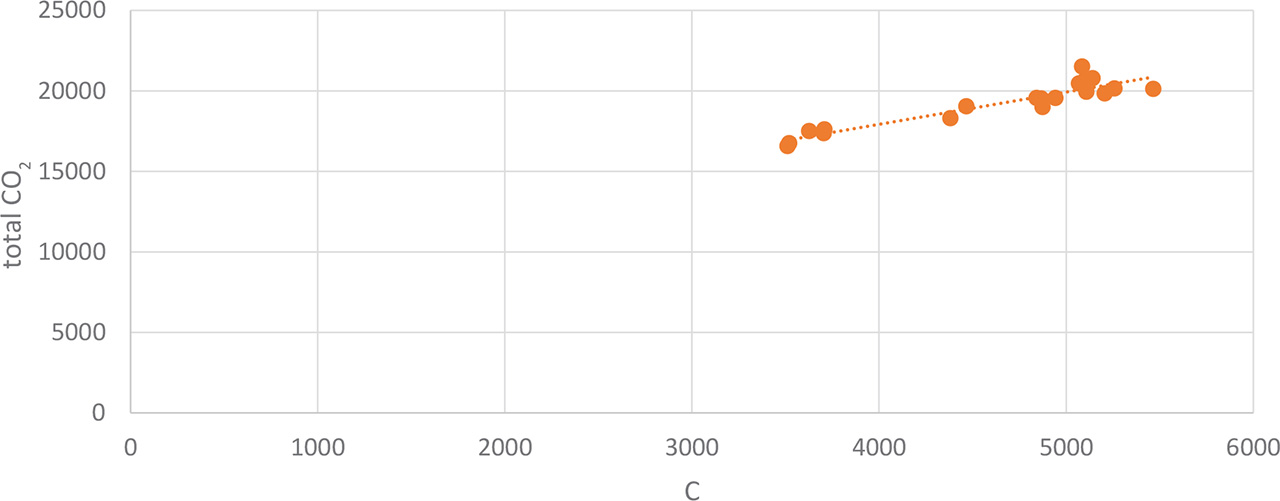
Figure 11:
Total emissions depending on coal consumption.
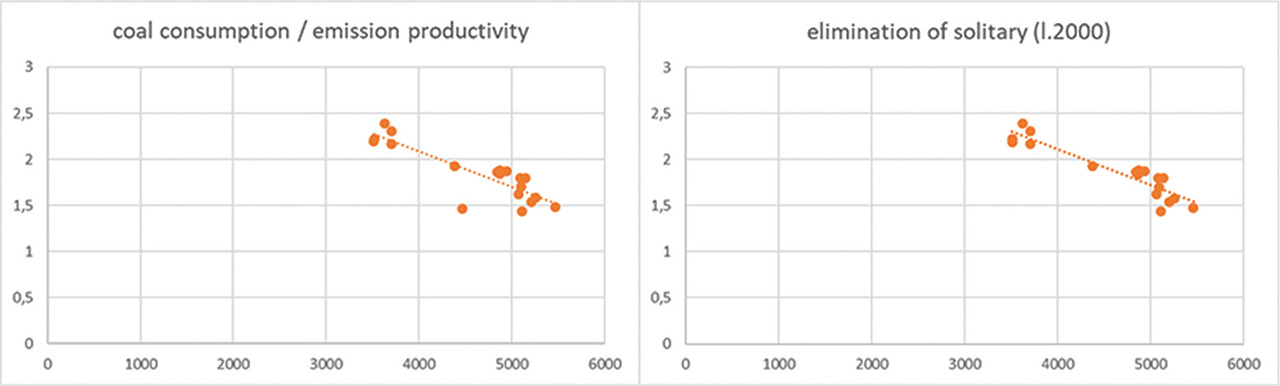
Figure 12:
Elimination of the outlier.
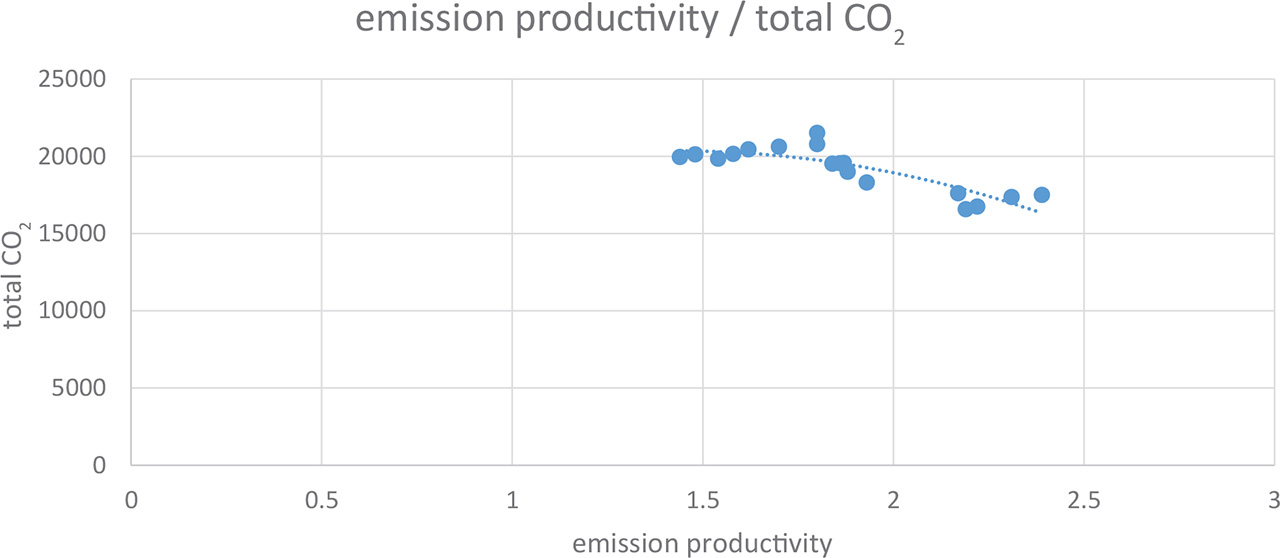
Figure 13:
Emission productivity in relation to total emissions.