
Figure 1.
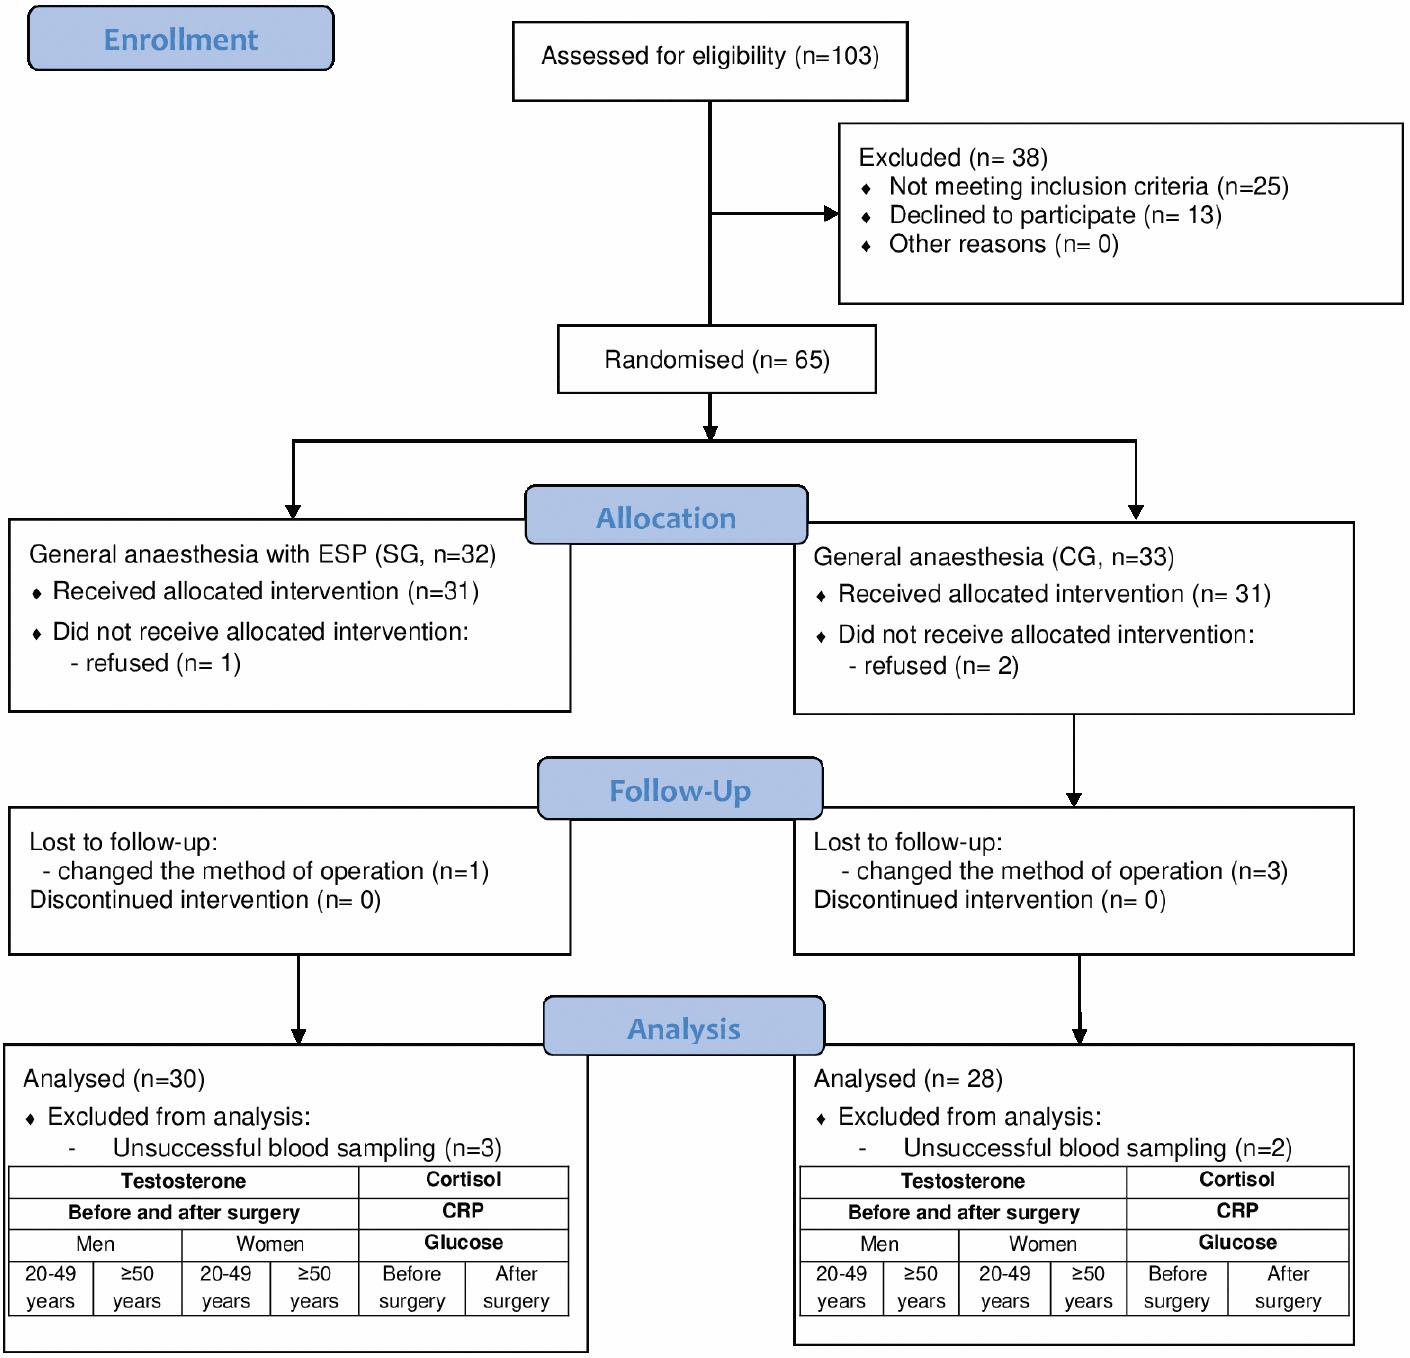
Figure 2.
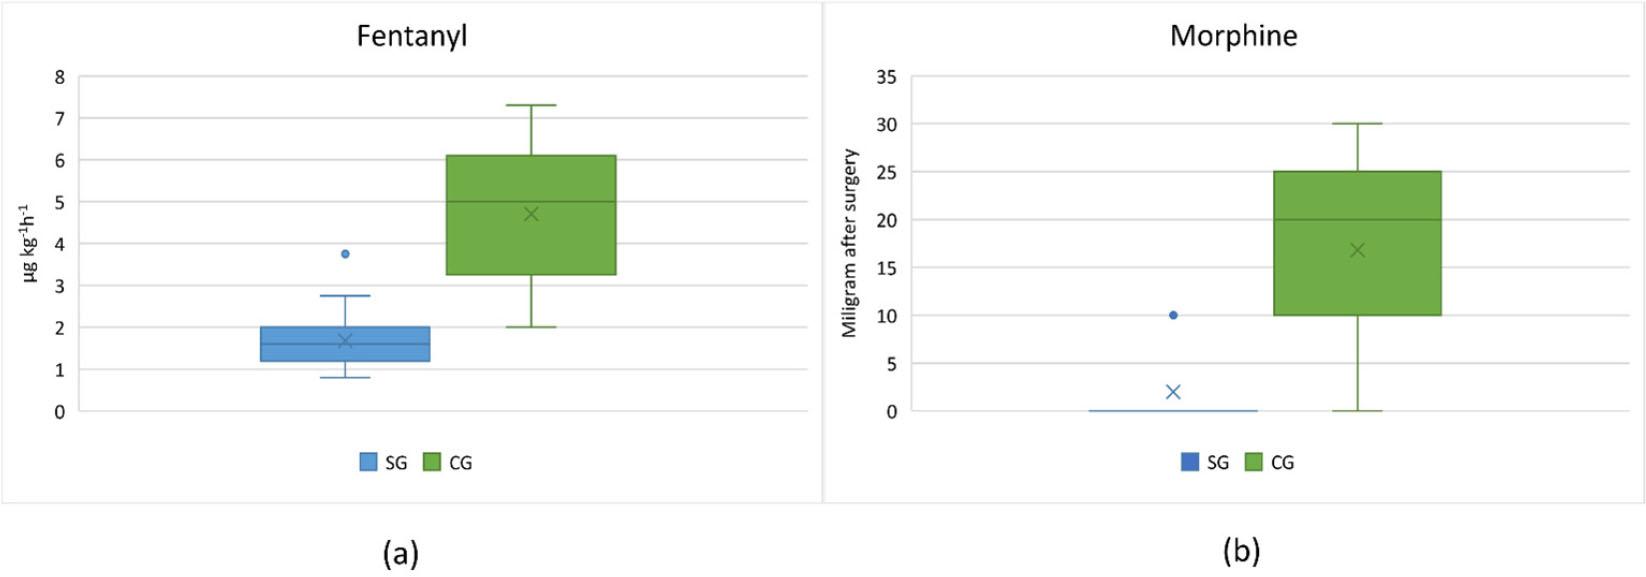
Figure 3.

Figure 4.
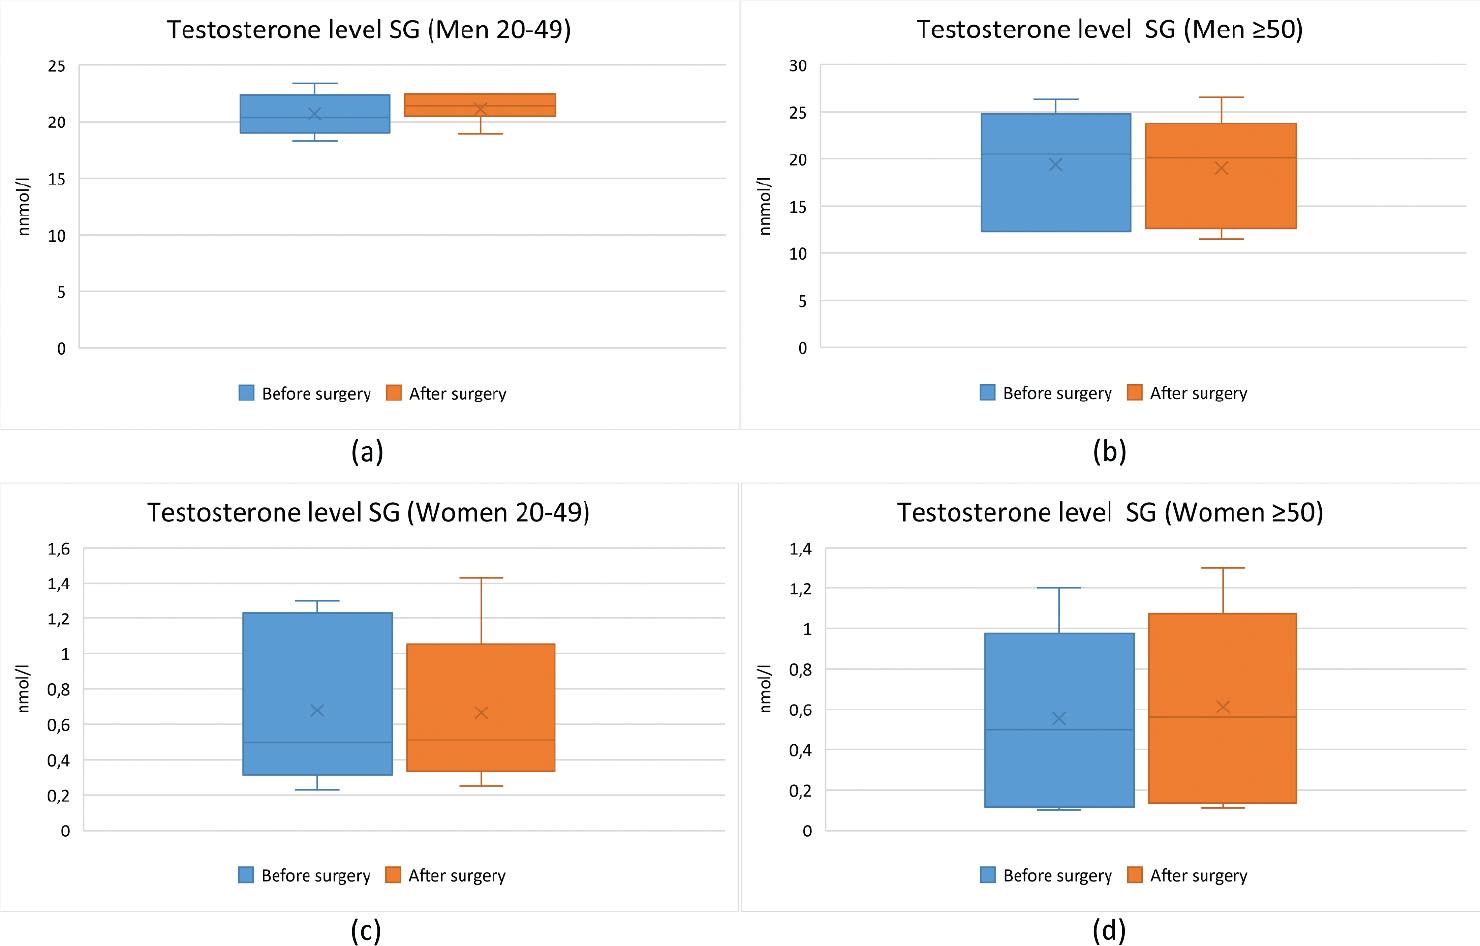
Figure 5.
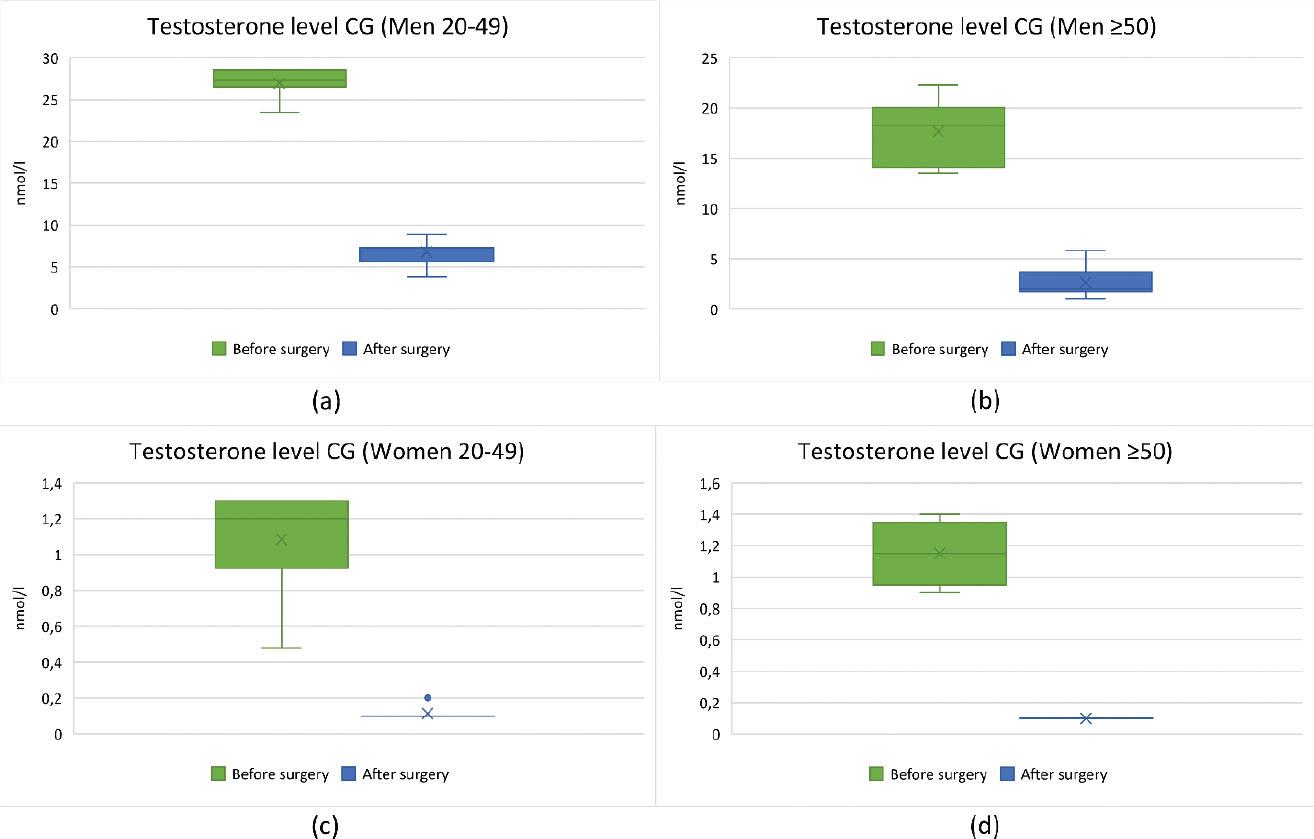
Figure 6.
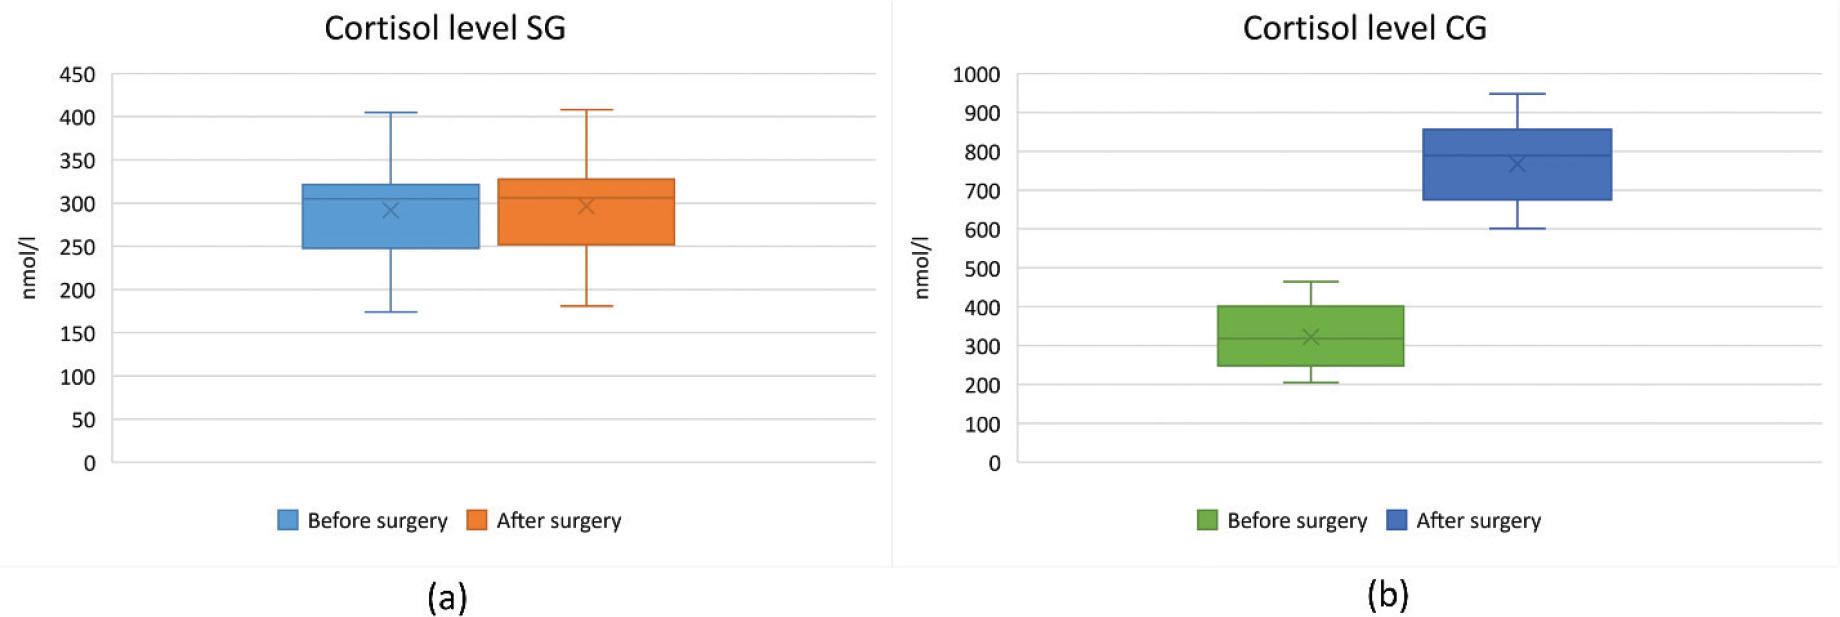
Figure 7.
The baseline characteristics of patients_
| SG (n=27) | CG (n=26) | |
|---|---|---|
| Men (n=26) | ||
| Age 20–49 years old (n) | 7 | 7 |
| Age ≥50 years old (n) | 7 | 6 |
| Women (n=24) | ||
| Age 20–49 years old (n) | 6 | 8 |
| Age ≥50 years old (n) | 7 | 5 |
| ASA | ||
| I (n) | 11 | 9 |
| II (n) | 16 | 17 |
| BMI (kg/m2) | 26.6 (CI 95% 23.4–29.7) | 26.6 (CI 95% 23.4–29.7) |
The average mechanical pain thresholds in SG and CG before surgery and after surgery_
| Before Surgery | After Surgery | |
|---|---|---|
| SG | 14.49 (95% CI 10.72–25.21) g/mm2 | 16.70 (95% CI 13.02–20.57) g/mm2 |
| CG | 21.45 (95% CI 18.80–24.10) g/mm2 | 4.75 (95% CI 4.13–5.38) g/mm2 |
Reference values of serum testosterone, cortisol C-reactive protein, and glucose levels_
| TESTOSTERONE | |
| Men 20–49 years | 8.64–29.0 nmol/l |
| Men ≥50 years | 6.68–25.7 nmol/l |
| Women 20–49 years | 0.290–1.67 nmol/l |
| Women ≥50 years | 0.101–1.42 nmol/l |
| CORTISOL | |
| AM 7:00–10:00 | 171–536 nmol/l |
| PM 16:00–20:00 | 64–327 nmol/l |
| C-REACTIVE PROTEIN | |
| <5 mg/ml | |
| GLUCOSE | |
| 4.11–6.05 mmol/l | |
The average testosterone levels in CG before surgery and after surgery_
| General anaesthesia without BESPB (CG) | ||
|---|---|---|
| Before Surgery | After Surgery | |
| Men 20–49 years old | 26.94 (95% CI 25.37–28.52) | 6.79 (95% CI 5.28–8.29) |
| Men 20–49 years old | 17.67 (95%CI 14.23–21.1) | 2.63 (95% CI 0.88–4.39) |
| Women 20–49 years old | 1.09 (95% CI 0.85–1.32) | 0.11 (95% CI 0.08–0.14) |
| Women ≥50 years old | 1.15 (95% CI 0.82–1.48) | 0.1 (95% CI 0.1–0.1) |
The average testosterone levels in SG before surgery and after surgery_
| General anaesthesia with BESPB (SG) | ||
|---|---|---|
| Before Surgery | After Surgery | |
| Men 20–49 years old | 20.73 (95% CI 19.07–22.38) | 21.11 (95% CI 20.00 –22.23) |
| Men 20–49 years old | 19.38 (95% CI 13.11–25.65) | 16.35 (95% CI 8.21–24.49) |
| Women 20–49 years old | 0.65 (95% CI 0.20–1.16) | 0.62 (95% CI 0.11–1.13) |
| Women ≥50 years old | 0.55 (95% CI 0.04–1.07) | 0.71 (95% CI 0.07–1.35) |
The average glucose levels in SG and CG before and after surgery_
| Before Surgery | After Surgery | |
|---|---|---|
| SG | 5.09 (95% CI 4.88–5.3) | 6.06 (95% CI 5.83–6.3) |
| CG | 5.2 (95% CI 4.9–5.5) | 9.23 (95% CI 8.63–9.83) |
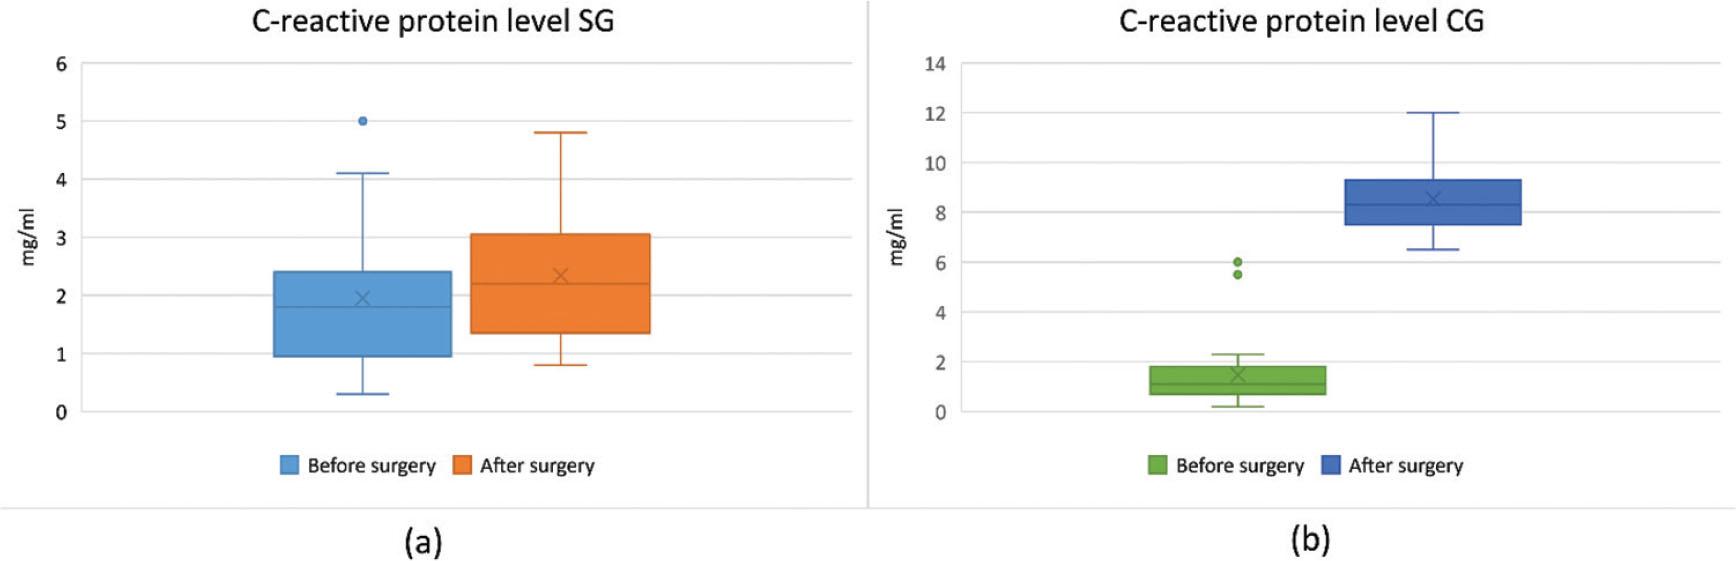
The average C-reactive protein levels in Groups 1 and 2 before and after surgery_
| Before Surgery | After Surgery | |
|---|---|---|
| SG | 1.95 (95% CI 1.48 to 2.42) | 2.34 (95% CI 1.88 to 2.81) |
| CG | 1.48 (95% CI 0.89 to 2.06) | 8.54 (95% CI 8 to 9.1) |
The average cortisol levels in Groups 1 and 2 before and after surgery_
| Before Surgery | After Surgery | |
|---|---|---|
| SG | 291.6 (95%CI 265.74–317.46) | 322 (95% CI 290.35–353.65) |
| CG | 296.4 (95% CI 270.8–567.2) | 767.24 (95% CI 720.02–814.46) |