
Figure 1
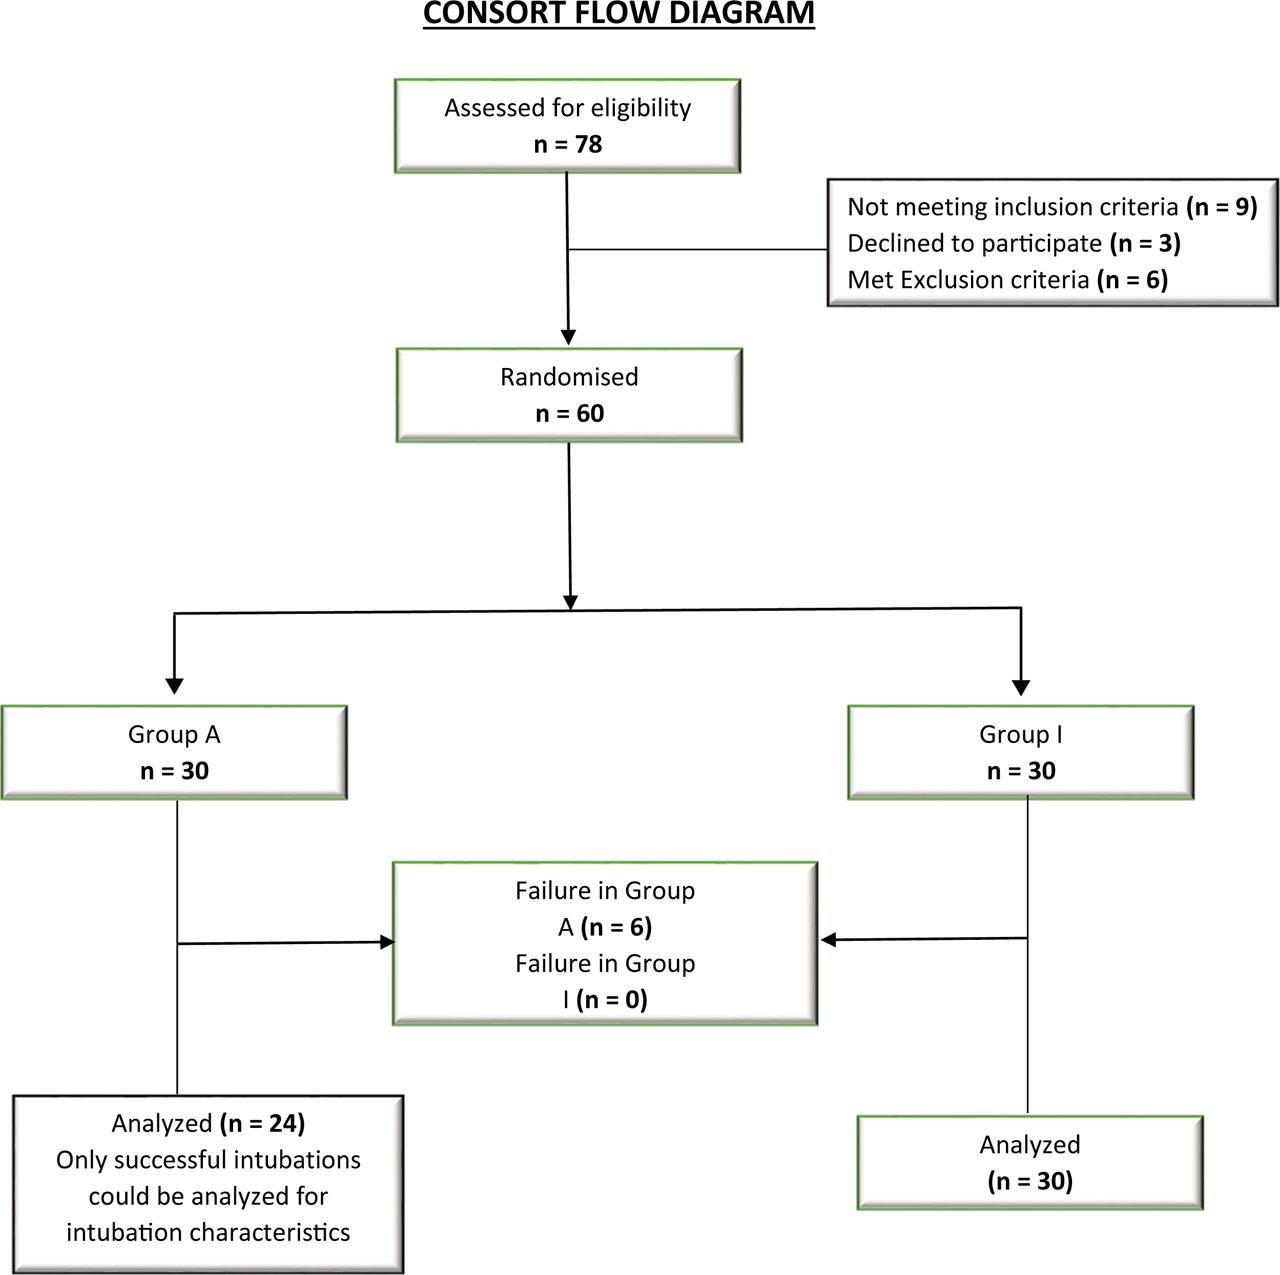
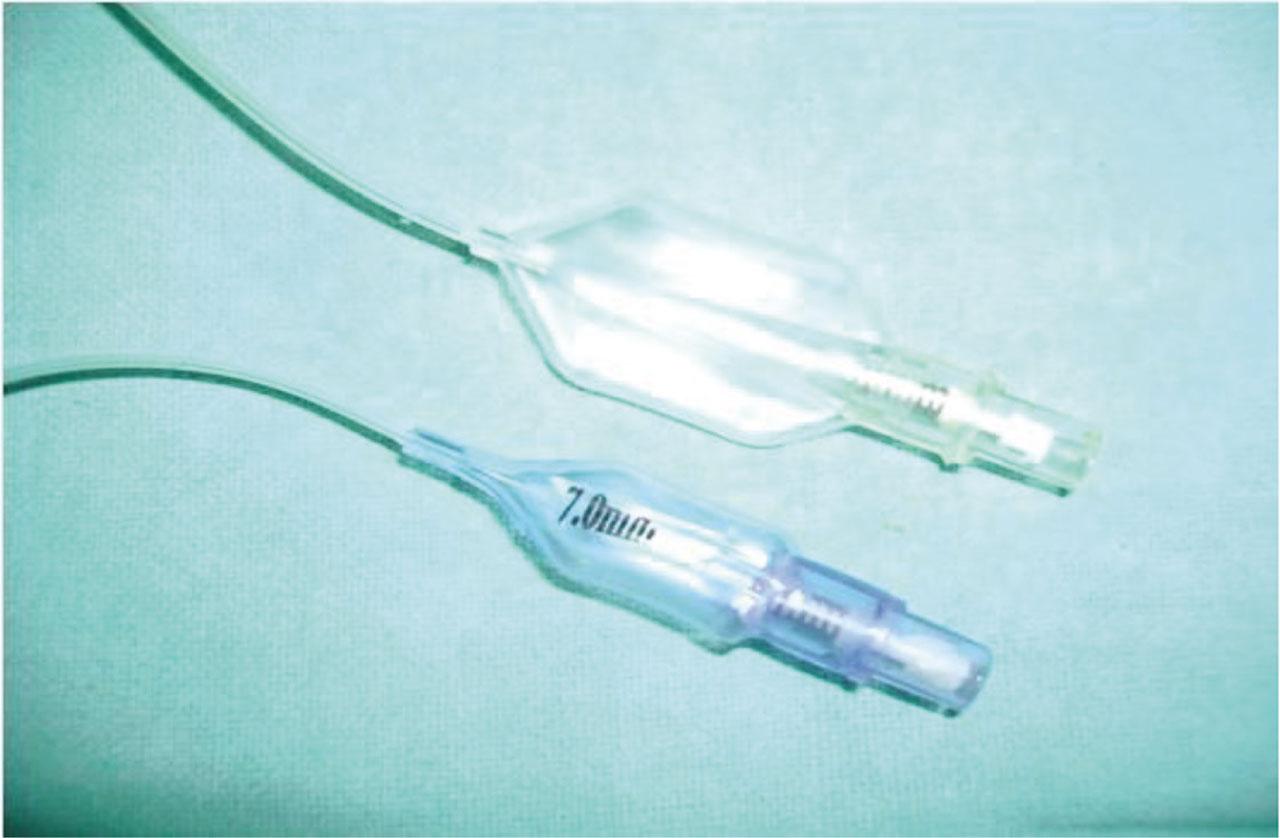
Figure 2
Comparison of demographic variables in both groups
| Patient characteristics | Group A | Group I | P value |
|---|---|---|---|
| female: male | 12:17 | 11:18 | 1.00 |
| Age (years) | 35.26 ± 11 | 35.5 ± 11 | 0.93 |
| Weight (Kg) | 57.23 ± 7.61 | 59 ± 6.91 | 0.35 |
| ASA I/II [n] | 24/6 | 23/7 | 1.00 |
| MP I/II/III/IV [n] | 16/10/4/0 | 11/12/5/2 | 0.35 |
Grading of sorethroat
| Score | Description |
|---|---|
| 0 | No complaints or evidence of sore throat or hoarseness |
| 1 | Patient complaints of minimal sore throat but observer found no hoarseness when compared with preoperative quality of voice |
| 2 | Patient complaints of moderate sore throat or observer found moderate hoarseness |
| 3 | Patient complaints of severe sore throat or observer found marked hoarseness. |
Comparison of Intubation Characteristics in successful intubations between both groups
| Parameters | A (n = 24) | I (n = 30) | P value |
|---|---|---|---|
| T in seconds (mean ±SD) | 45.37 ± 27.55 | 77.6 ± 31.85 | 0.0003 |
| T in A, T2 in I (mean±SD) | 45.37 ± 27.55 | 33.06 ± 19.07 | 0.058 |
| Ease of intubation (VAS median [IQR]) | 5 [4–6] | 5 [4–7] | 0.533 |
| Number of attempts (1/2) | 19/5 | 26/4 | 0.489 |
| Number of adjusting maneuvers (0/1/2) | 11/12/1 | 13/15/2 | 0.91 |