
Figure 1
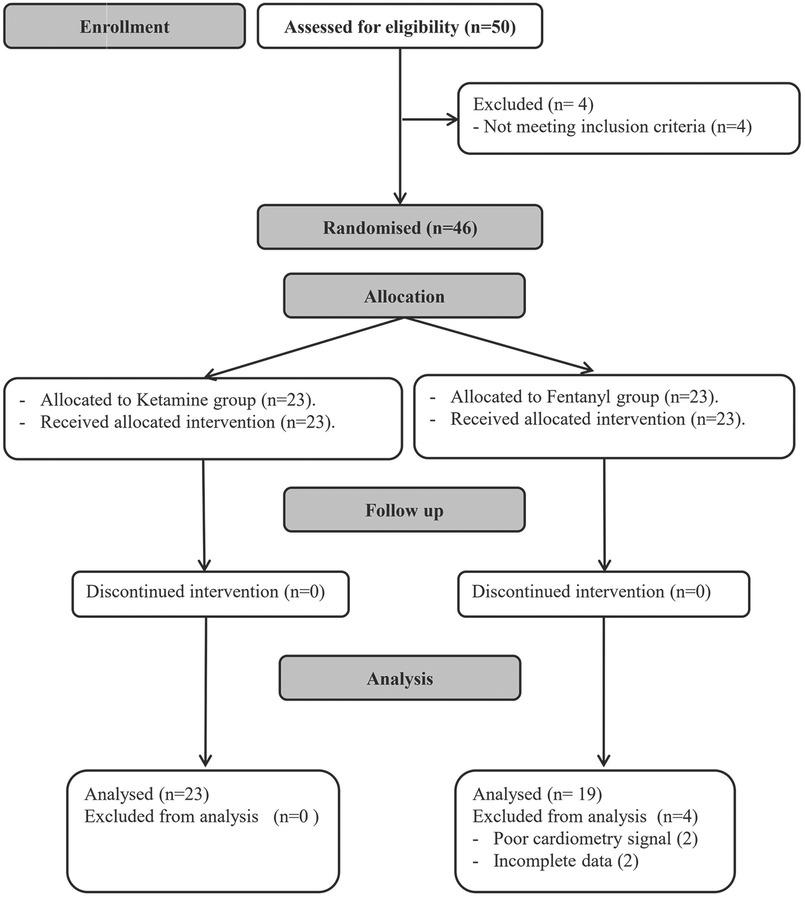
Figure 2
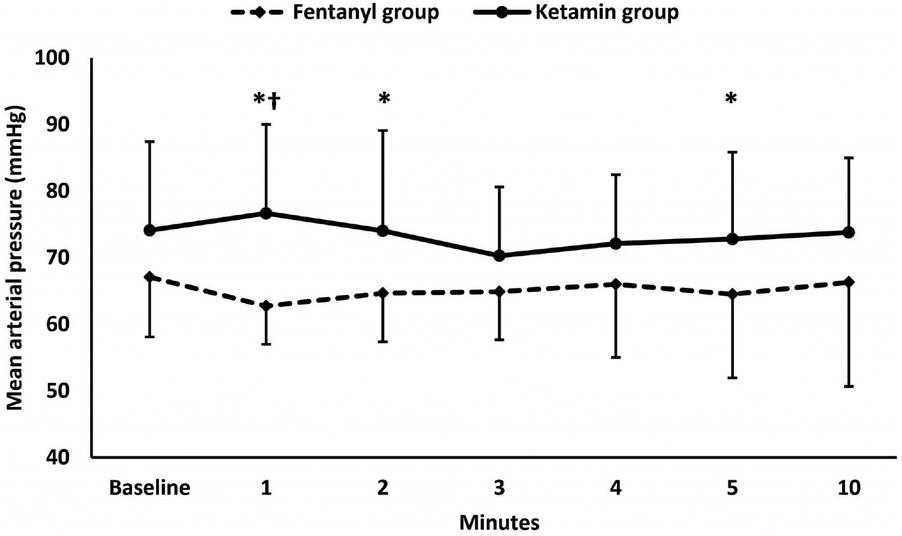
Figure 3
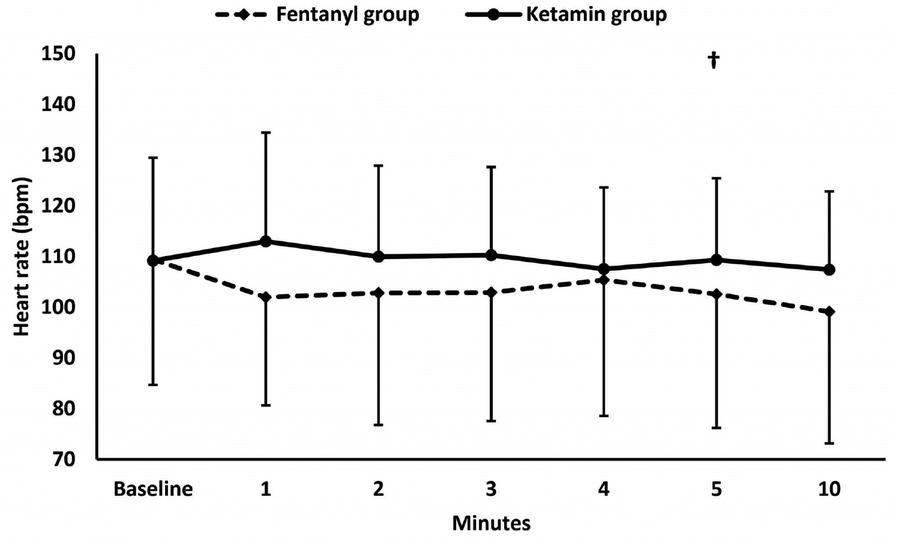
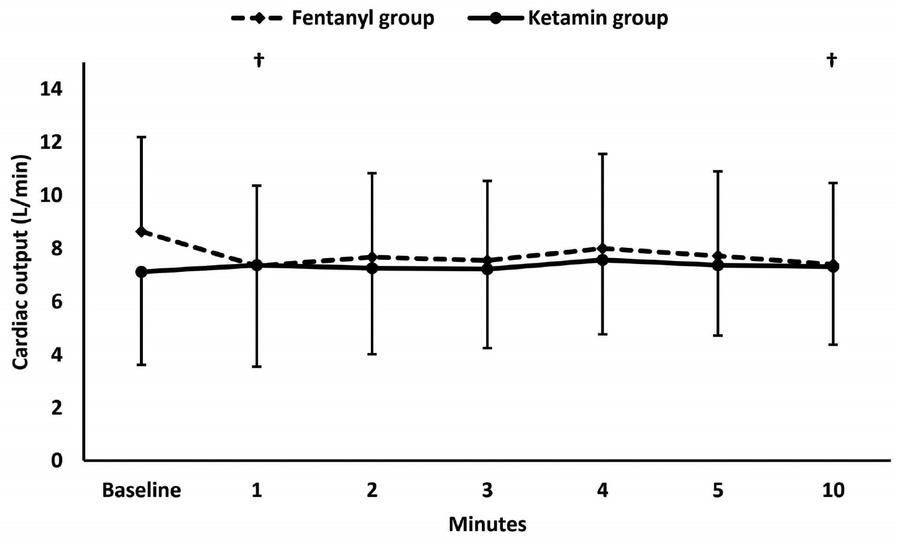
Figure 4
Demographic data and baseline characteristics_ Data are presented as mean (standard deviation), median (quartiles), and frequency (%)_
| Ketamine group (n=23) | Fentanyl group (n=19) | P-value | |
|---|---|---|---|
| Age (years) | 44 (40-60) | 56 (46-63) | 0.356 |
| Male gender (%) | 11 (47.8%) | 8 (42.1%) | 0.763 |
| Source of sepsis | |||
| • Abdominal | 17 (73.9%) | 18 (94.7%) | 0.071 |
| • Other | 6 (26.1%) | 1 (5.3%) | |
| Mean arterial pressure (mmHg) | 74 (13) | 67 (9) | 0.113 |
| Heart rate (bpm) | 111 (21) | 109 (24) | 0.837 |
| Shock index | 1.1 (0.3) | 1.2 (0.3) | 0.563 |
| Stroke volume (ml) | 63 (30) | 78 (28) | 0.114 |
| Cardiac output (L/min) | 7.1 (3.4) | 8.5 (3.5) | 0.209 |
| Systemic vascular resistance (dynes/seconds/cm5) | 821 (325) | 715 (389) | 0.350 |
| Haemoglobin (g/dL) | 10.7 (9.5, 11.7) | 10.8 (8.8, 11.5) | 0.411 |
| Prothrombin concentration (%) | 59 (18) | 58 (12) | 0.773 |
| Urea (mg/dL) | 51 (27, 113) | 49 (29, 98) | 0.889 |
| Creatinine (mg/dL) | 1.4 (1.0, 2.1) | 1.4 (1.2, 3.1) | 0.447 |
Intraoperative outcomes_ Data are presented as mean (standard deviation), median (quartiles), and frequency (%)_
| Ketamine group (n=15) | Fentanyl group (n=16) | P-value | |
|---|---|---|---|
| Mean blood pressure at 1 min (mmHg) | 77 (13) | 63 (6) | 0.001 |
| Patients with post-induction hypotension | 11 (47.8%)* | 16 (84.2%) | 0.014 |
| Serum lactate (baseline) (mmol/dL) | 3.2 (2.3, 4.1) | 2.8 (2.2, 4.3) | 0.544 |
| Serum (mmol/lactate dL) (after 15 minutes) | 2.2 (1.8, 3.4)† | 2.6 (2.2, 3.6)† | 0.471 |