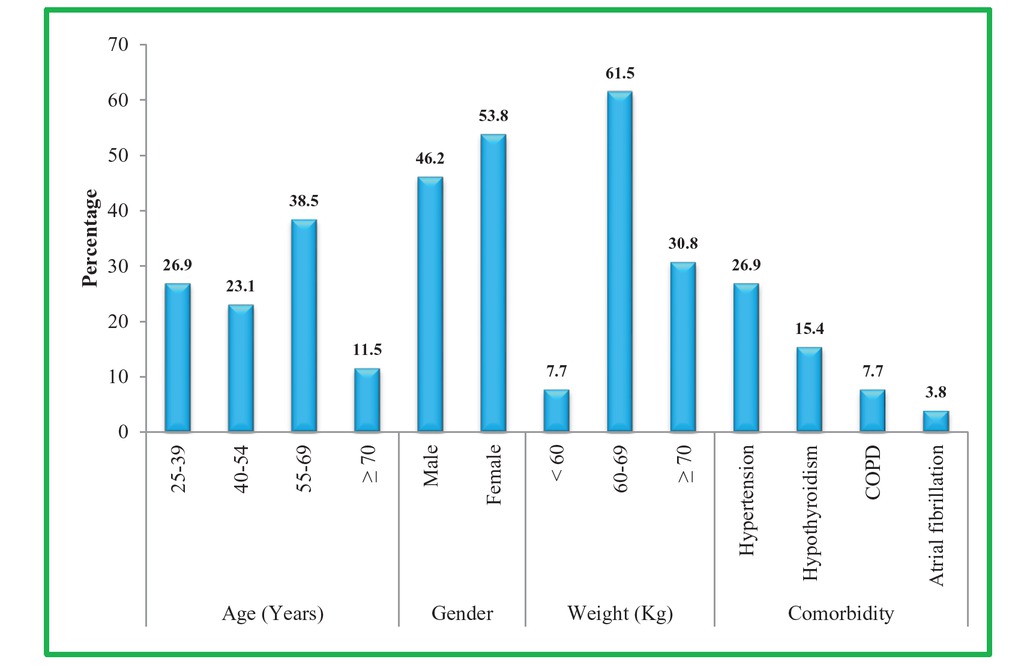
Figure 1
Demographic characteristics of study patients.
Table 1
Demographic characteristics of study patients [n = 26]
| Parameter | Frequency | Percentage | |
|---|---|---|---|
| Age (Years) | 25-39 | 7 | 26.9 |
| 40-54 | 6 | 23.1 | |
| 55-69 | 10 | 38.5 | |
| ≥70 | 3 | 11.5 | |
| Mean ± SD (Range) | 51.5 ± 14.89 | (27-80) | |
| Gender | Male | 12 | 46.2 |
| Female | 14 | 53.8 | |
| Weight (Kg) | <60 | 2 | 7.7 |
| 60-69 | 16 | 61.5 | |
| ≥70 | 8 | 30.8 | |
| Comorbidity | Hypertension | 7 | 26.9 |
| Hypothyroidism | 4 | 15.4 | |
| COPD | 2 | 7.7 | |
| Atrial fibrillation | 1 | 3.8 |
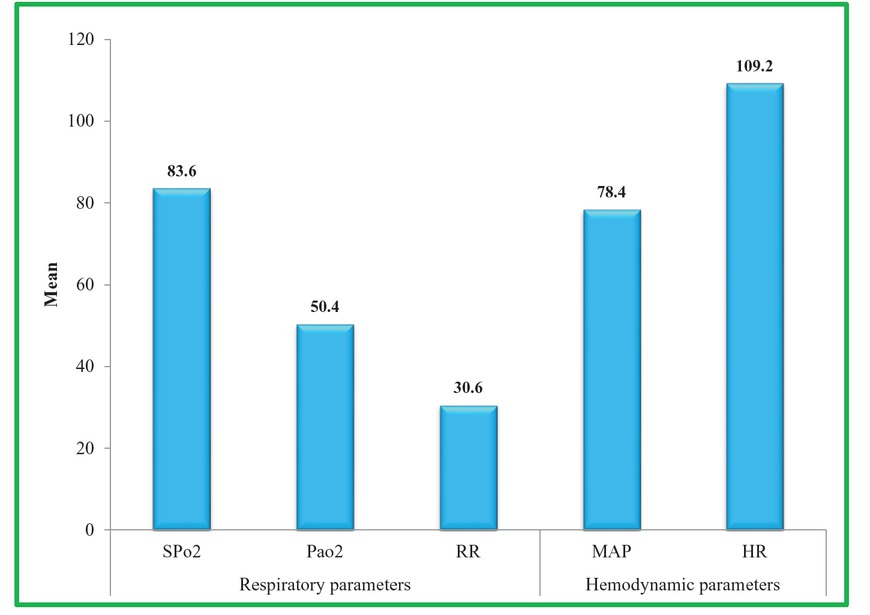
Figure 2
Respiratory and haemodynamic parameters on admission.
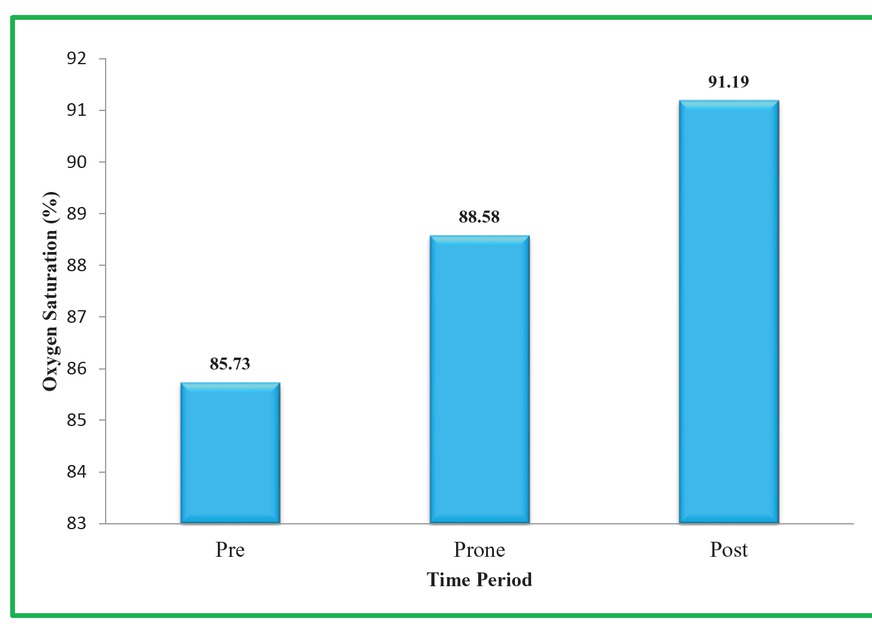
Figure 3
Oxygen saturation (%) during different study periods.
Table 2
Respiratory and haemodynamic parameters on admission
| Parameter | Mean | SD | Range | |
|---|---|---|---|---|
| Respiratory parameters | SPo2 | 83.6 | 6.13 | 60-90 |
| Pao2 | 50.4 | 6.68 | 33-62 | |
| RR | 30.6 | 2.82 | 24-36 | |
| Haemodynamic parameters | MAP | 78.4 | 9.57 | 65-108 |
| HR | 109.2 | 12.01 | 90-130 |
Table 3
Respiratory and haemodynamic parameters during different study periods
| Parameter | Pre | Prone | Post | P-value | ||||
|---|---|---|---|---|---|---|---|---|
| Mean | SD | Mean | SD | Mean | SD | Pre vs. Prone | Pre vs. Post | |
| SPo2 | 85.73 | 6.86 | 88.58 | 3.89 | 91.19 | 3.18 | 0.003* | <0.001* |
| Pao2 | 53.15 | 6.00 | 58.38 | 6.81 | 64.23 | 6.96 | <0.001* | <0.001* |
| RR | 28.58 | 3.89 | 26.27 | 4.98 | 23.15 | 5.83 | 0.002* | <0.001* |
| MAP | 76.88 | 8.02 | 78.54 | 10.77 | 77.54 | 6.53 | 0.304 | 0.672 |
| HR | 108.31 | 12.77 | 102.92 | 12.96 | 94.81 | 15.21 | 0.004* | <0.001* |
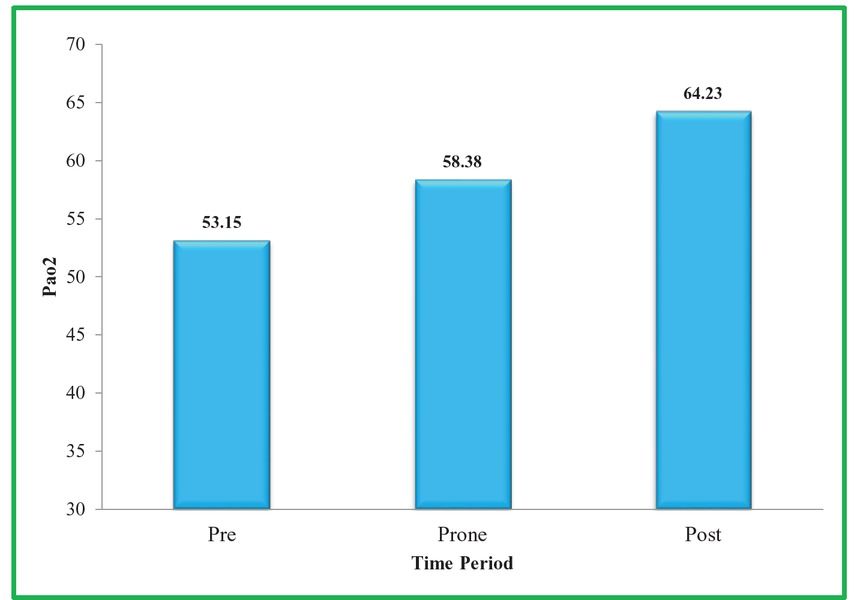
Figure 4
Pao2 during different study periods.
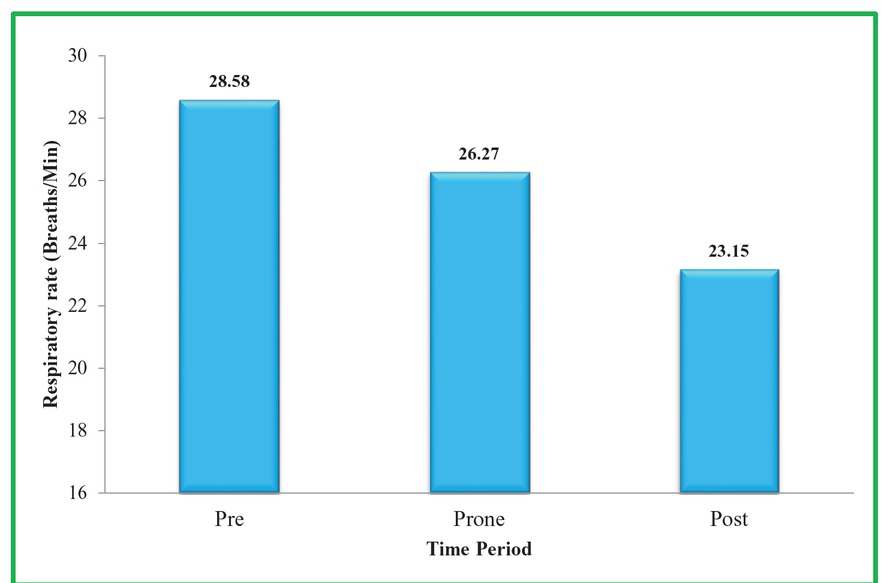
Figure 5
Respiratory rate (breaths/min) during different study periods.