
Figure 1
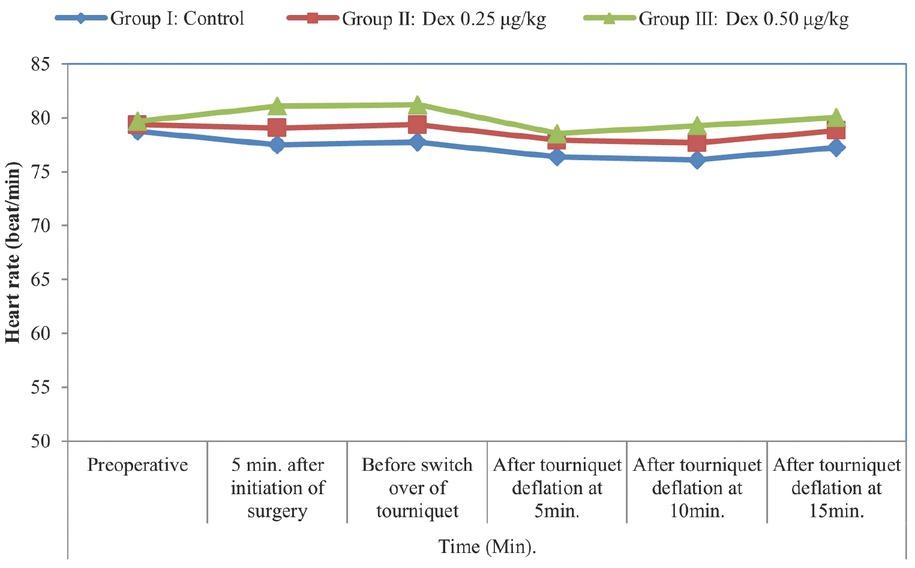
Figure 2
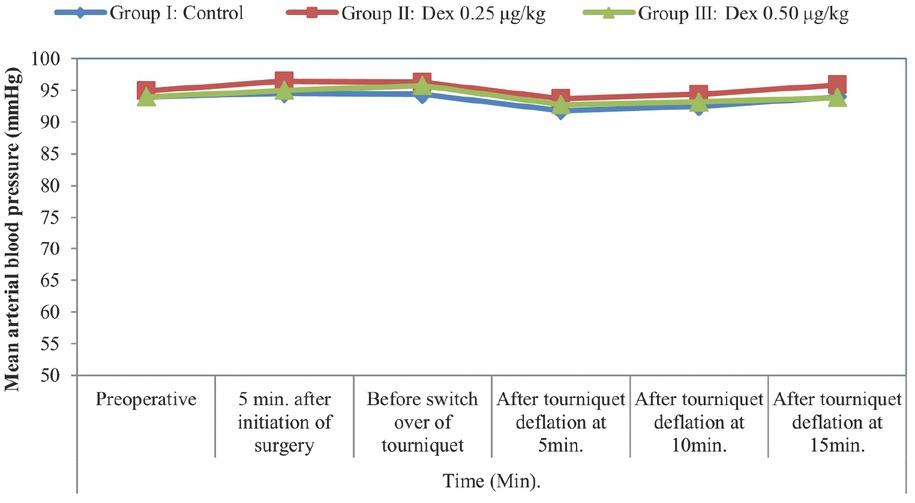
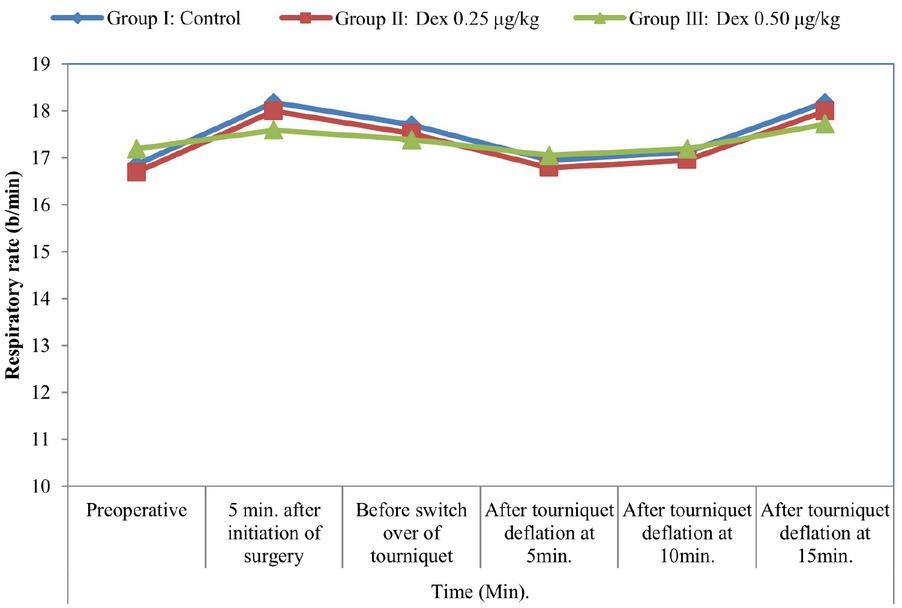
Figure 3
Comparison among groups according to demographic data_
| Demographic data | Group I: Control (n=30) | Group II: Dex 0.25 μg/kg (n=30) | Group III: Dex 0.50 μg/kg (n=30) | Test | p-value |
|---|---|---|---|---|---|
| Age (years) | |||||
| Range | 20-70 | 21-70 | 20-69 | ||
| F = 0.935 | 0.397 | ||||
| Mean ± SD | 41.54 ± 7.06 | 39.04 ± 6.92 | 40.60 ± 7.47 | ||
| Sex | |||||
| Male | 23 (76.7%) | 26 (86.7%) | 24 (80.0%) | ||
| Female | 7 (23.3%) | 4 (13.3%) | 6 (20.0%) | x2 = 1.015 | 0.602 |
| ASA | |||||
| I | 21 (70.0%) | 22 (73.3%) | 19 (63.3%) | ||
| x2 = 0.726 | 0.696 | ||||
| II | 9 (30.0%) | 8 (26.7%) | 11 (36.7%) | ||
| Duration of surgery | |||||
| (min) | |||||
| Range | 28-60 | 25-59 | 27-58 | ||
| F = 0.930 | 0.399 | ||||
| Mean ± SD | 43.84 ± 7.45 | 41.21 ± 7.30 | 42.86 ± 7.89 |
Comparison between groups in terms of block and mean duration of tourniquet time_
| Block (min) | Group I: Control (n=30) | Group II: Dex 0.25 μg/kg (n=30) | Group III: Dex 0.50 μg/kg (n=30) | Test | p-value |
|---|---|---|---|---|---|
| Onset block of (min) sensory | 4.96 ± 0.90 | 3.92 ± 0.92a | 1.06 ± 0.35ab | F = 206.345 | <0.001** |
| Onset block of (min) motor | 12.80 ± 2.16 | 10.69 ± 2.20a | 5.34 ± 1.16ab | F = 122.649 | <0.001** |
| Quality of block | |||||
| Excellent | 15 (50.0%) | 24 (80.0%) | 26 (86.7%) | ||
| Good | 8 (26.7%) | 4 (13.3%) | 3 (10.0%) | x2 = 13.219 | 0.040* |
| Fair | 5 (16.7%) | 2 (6.7%) | 1 (3.3%) | ||
| Poor | 2 (6.7%) | 0 (0.0%) | 0 (0.0%) | ||
| Mean duration of tourniquet time (min) | |||||
| Mean ± SD | 52.77 ± 4.58 | 55.06 ± 5.20 | 54.28 ± 4.82 | 1.712 | 0.187 |
Comparison between groups according to complications_
| Complications | Group I: Control (n=30) | Group II: Dex 0.25 μg/kg (n=30) | Group III: Dex 0.50 μg/kg (n=30) | x2 | p-value |
|---|---|---|---|---|---|
| Dry mouth | 1 (3.3%) | 2 (6.7%) | 3 (10.0%) | ||
| Bradycardia | 0 (0.0%) | 1 (3.3%) | 2 (6.7%) | ||
| Tinnitus | 0 (0.0%) | 1 (3.3%) | 2 (6.7%) | 8.280 | 0.407 |
| Perioral numbness | 0 (0.0%) | 1 (3.3%) | 2 (6.7%) | ||
| Nil | 29 (96.7%) | 25 (83.3%) | 21 (70.0%) |
Comparison between groups according to sedation score (after tourniquet deflation), VAS score duration of analgesia, doses needed of analgesic and total dose of ketorolac_
| Sedation score (after tourniquet deflation) | Group I: Control (n=30) | Group II: Dex 0.25 μg/ kg (n=30) | Group III: Dex 0.50 μg/ kg (n=30) | Test | p-value |
|---|---|---|---|---|---|
| After 20 min | 2 (1-4) | 2 (1-4) | 2 (1-4) | 1.713 | 0.207 |
| After 40 min | 1 (1-3) | 1 (1-3) | 1 (1-3) | 1.117 | 0.186 |
| After 60 min | 1 (1-2) | 1 (1-2) | 1 (1-2) | 1.440 | 0.173 |
| VAS score | |||||
| After 1 hr | 1 (0-3) | 1 (0-2) | 0 (0-1) | 1.679 | 0.201 |
| After 2 hrs | 3 (1-5) | 2 (1-4)a | 1 (0-2)ab | 2.338 | 0.016* |
| After 3 hrs | 5 (1-5) | 3 (1-4)a | 1 (1-2)ab | 2.189 | 0.013* |
| After 4 hrs | 4 (2-6) | 3 (2-5)a | 2 (1-4)ab | 2.099 | 0.012* |
| After 5 hrs | 5 (3-7) | 4 (3-5)a | 3 (1-4)ab | 2.015 | 0.006* |
| Duration of analgesia | F-test | ||||
| Mean ± SD | 108.27 ± 55.00 | 174.20 ± 67.08a | 331.53 ± 78.27ab | 86.746 | <0.001** |
| Doses needed of analgesic | 1.713 | 0.207 | |||
| After 40 min | 1 (1-3) | 1 (1-3) | 1 (1-3) | 1.117 | 0.186 |
| After 60 min | 1 (1-2) | 1 (1-2) | 1 (1-2) | 1.440 | 0.173 |
| VAS score | x2 | ||||
| 1st dose | 30 (100.0%) | 30 (100.0%) | 30 (100.0%) | 0.000 | 1.000 |
| 2nd dose | 30 (100.0%) | 26 (86.7%) | 17 (56.7%) | 19.291 | <0.001** |
| 3rd dose | 18 (60.0%) | 12 (40.0%) | 0 (0.0%) | 25.200 | <0.001** |
| 4th dose | 5 (16.7%) | 0 (0.0%) | 0 (0.0%) | 10.588 | 0.005* |
| Total dose (Ketorolac mg/kg) | F-test | ||||
| Mean ± SD | 83.75 ± 7.54 | 68.61 ± 6.18a | 47.42 ± 4.27ab | 264.587 | <0.001** |