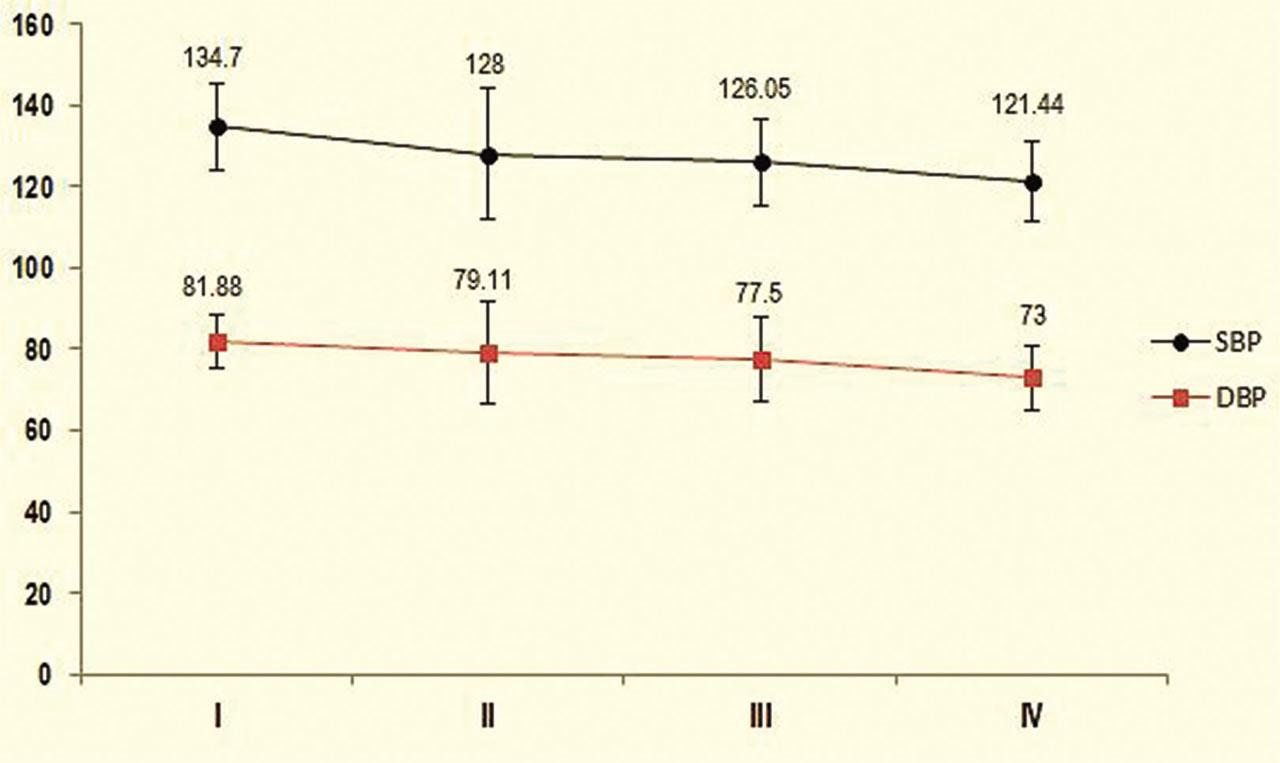
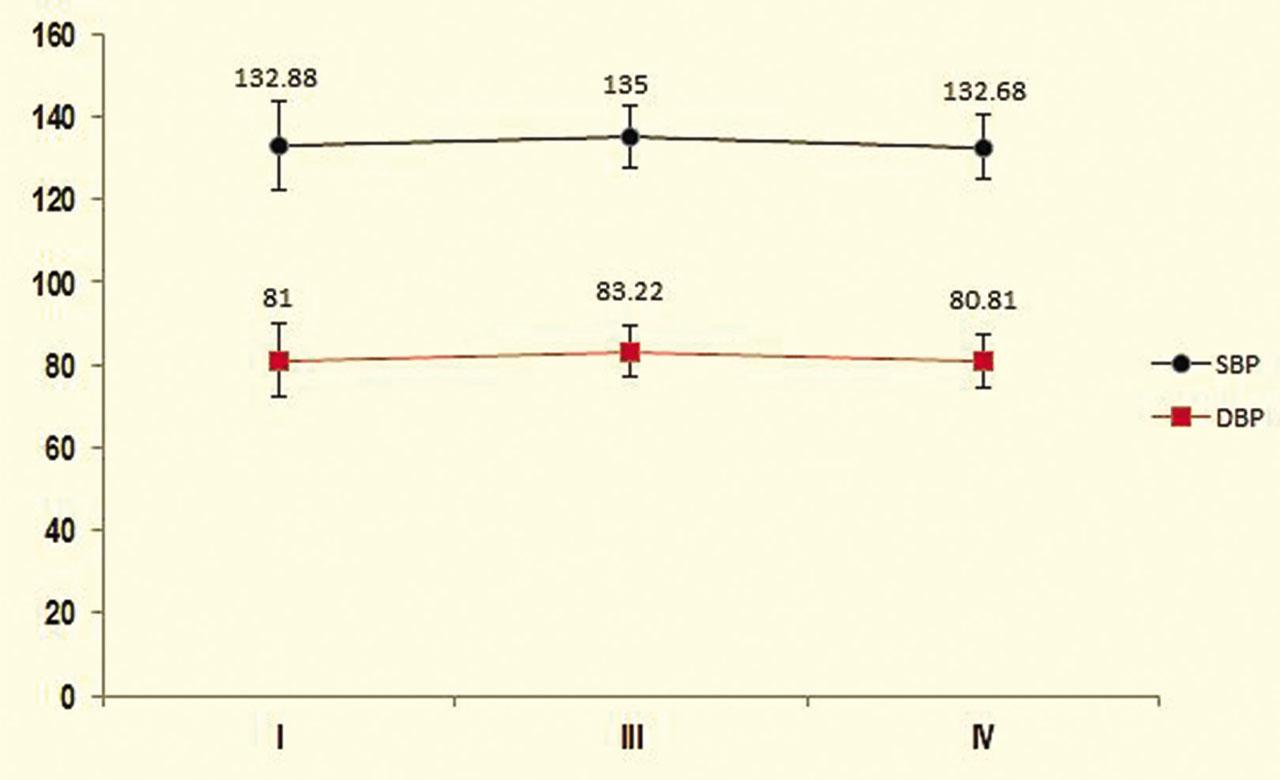
Have a personal or library account? Click to login
Evaluating the Effect of Dexmedetomidine Intravenous Infusion on Labour Pain Management in Primipara Pregnant Women: A Nonrandomised Clinical Trial Study Cover

Evaluating the Effect of Dexmedetomidine Intravenous Infusion on Labour Pain Management in Primipara Pregnant Women: A Nonrandomised Clinical Trial Study

Open Access
|Sep 2022

Figures & Tables

Figure 1

Comparison of mean systolic and diastolic blood pressure (mmHg) in the intervention group during the study.I = Primary SBP and DBP; II = during bolus dose of dexmedetomidine; III = during labour; IV = after placental expulsion.

Figure 2

Comparison of mean systolic and diastolic blood pressure (mmHg) in the control group during the study.I = Primary SBP and DBP; III = during labour; IV = after placental expulsion.

Figure 3

Comparison of the mean VAS score in the intervention group during the study.VAS1 = primary VAS; VAS2 = after bolus dose of dexmedetomidine; VAS3 = during labour; VAS4 = after placental expulsion.

Comparison of demographic characteristics between the two groups

groupsNMinimumMaximumMeanStd. Deviationp-value
Age (year)intervention20223827.90004.510.79
control26183626.53854.76

Height (cm)intervention20157170162.75004.350.94
control26147173162.61547.40

Weight (kg)intervention20598877.000013.790.2
control26519872.115411.77

Dilatation (cm)intervention20485.425.420.89
control26475.385.38

Effacement (%)intervention20309053.1553.150.87
control26308053.8453.84

Comparing mean duration of labor stages (minutes) between the two groups

groupsNMinimumMaximumMeanStd. Deviationp-value
Stage Iintervention171030081.2375.830.002
control2433402192.75120.76

Stage IIintervention17109042.4727.580.95
control24109341.9523.87

Stage IIIintervention174105.941.710.47
control244507.589.16
DOI: https://doi.org/10.2478/rjaic-2021-0002 | Journal eISSN: 2502-0307 | Journal ISSN: 2392-7518
Language: English
Page range: 10 - 18
Published on: Sep 25, 2022
Published by: Sciendo
In partnership with: Paradigm Publishing Services
Publication frequency: 2 issues per year

© 2022 Abasali Delavari, Mahdi Dehgan, Marzieh Lak, published by Sciendo
This work is licensed under the Creative Commons Attribution-NonCommercial-NoDerivatives 3.0 License.