
Figure 1
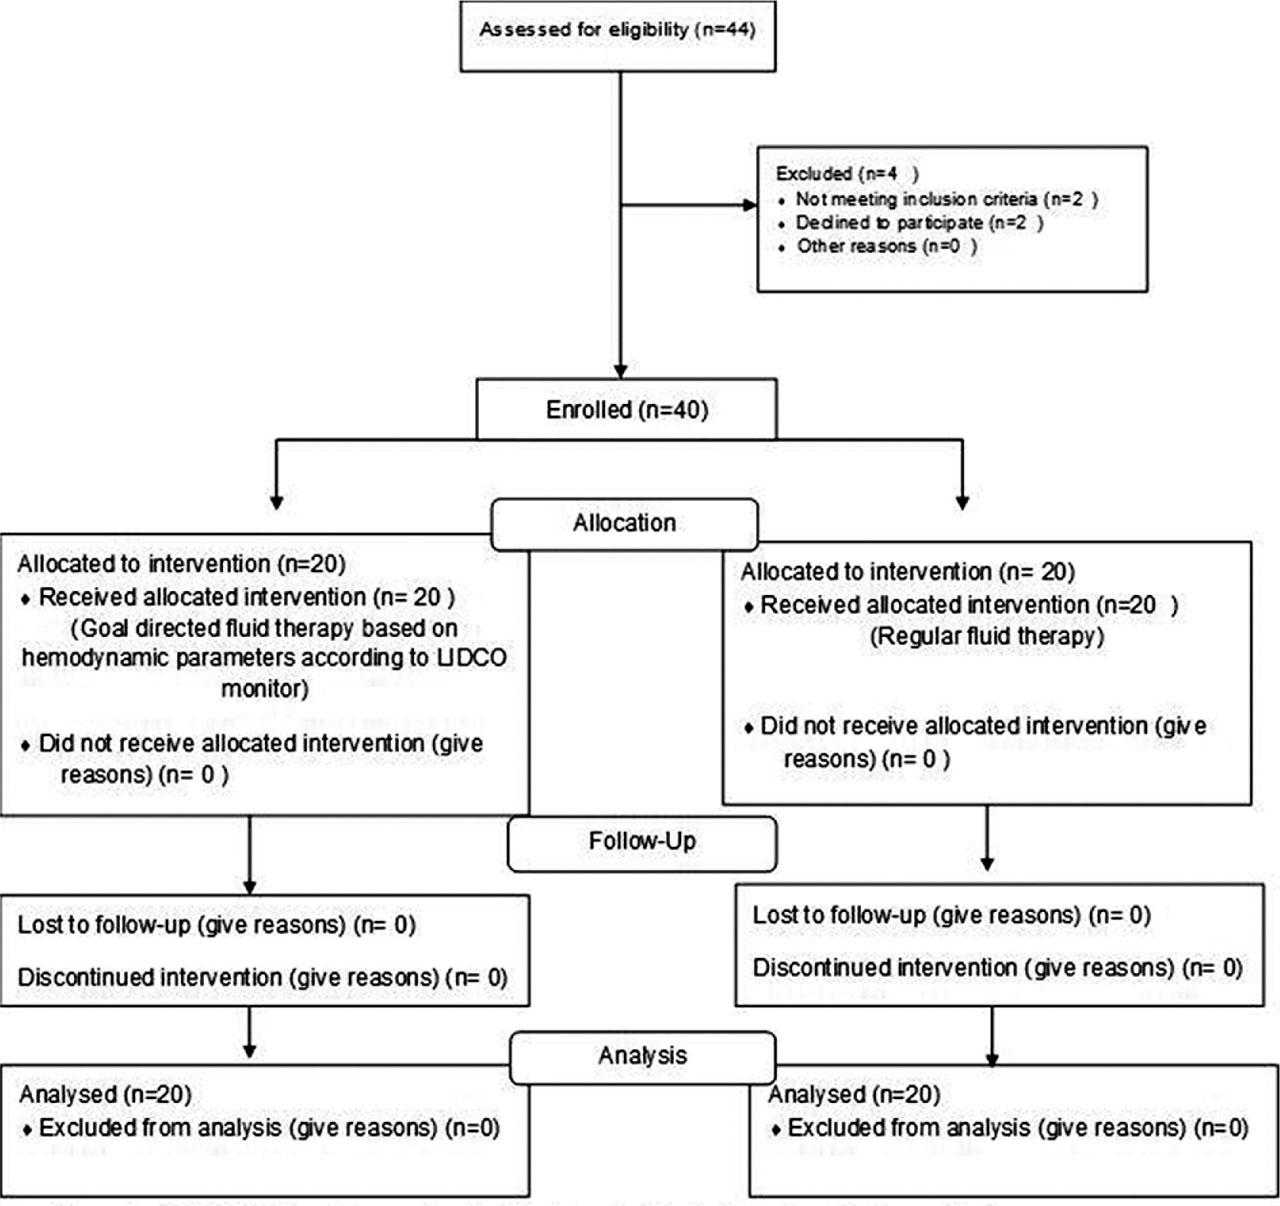
Figure 2
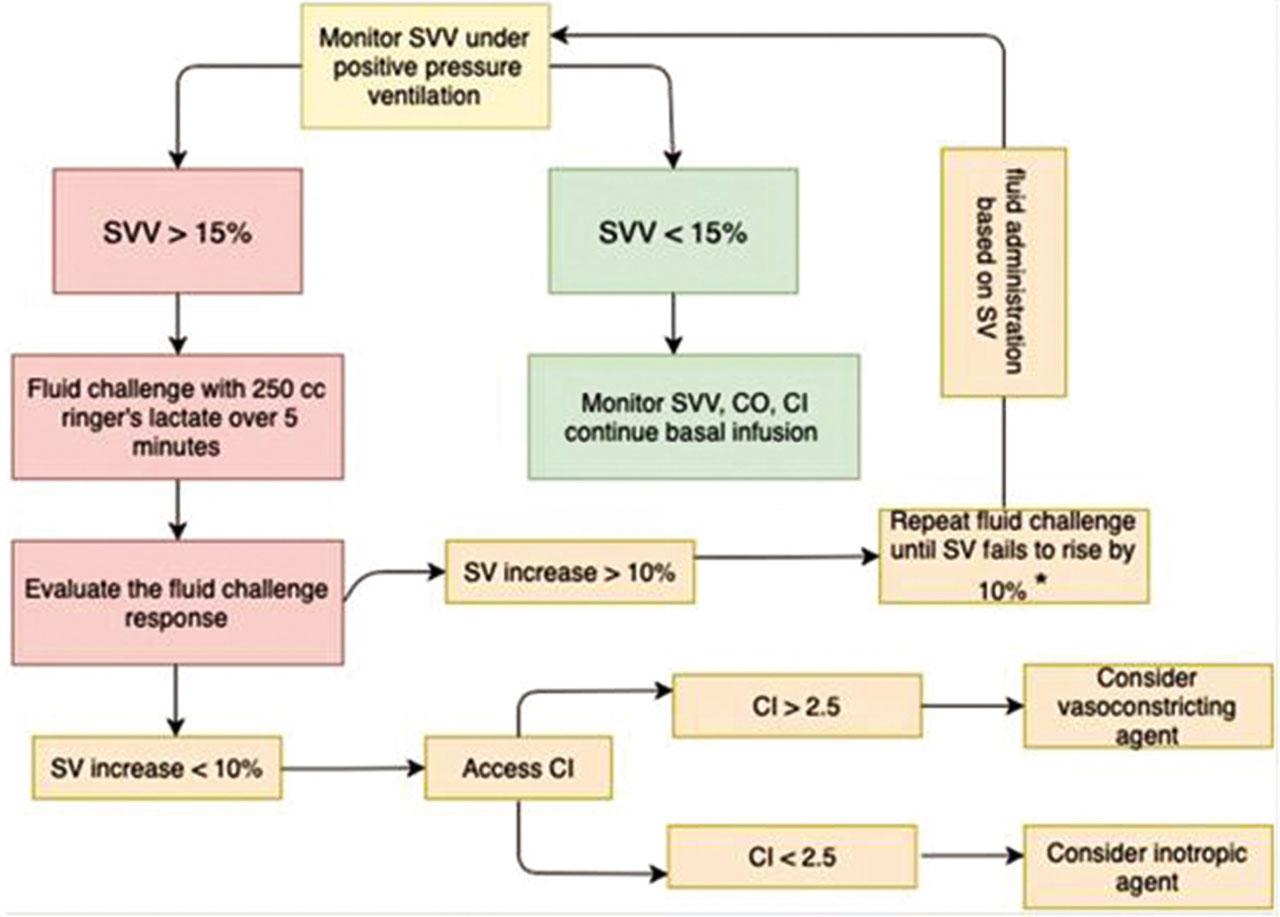
Figure 3
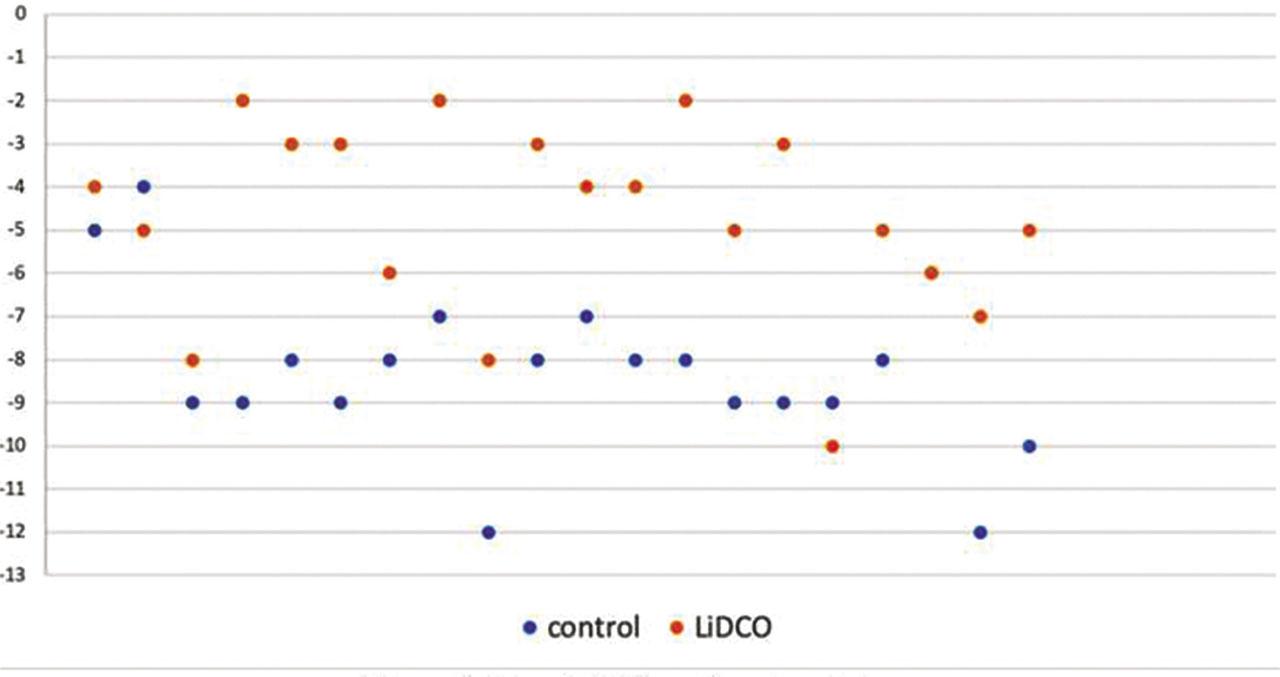
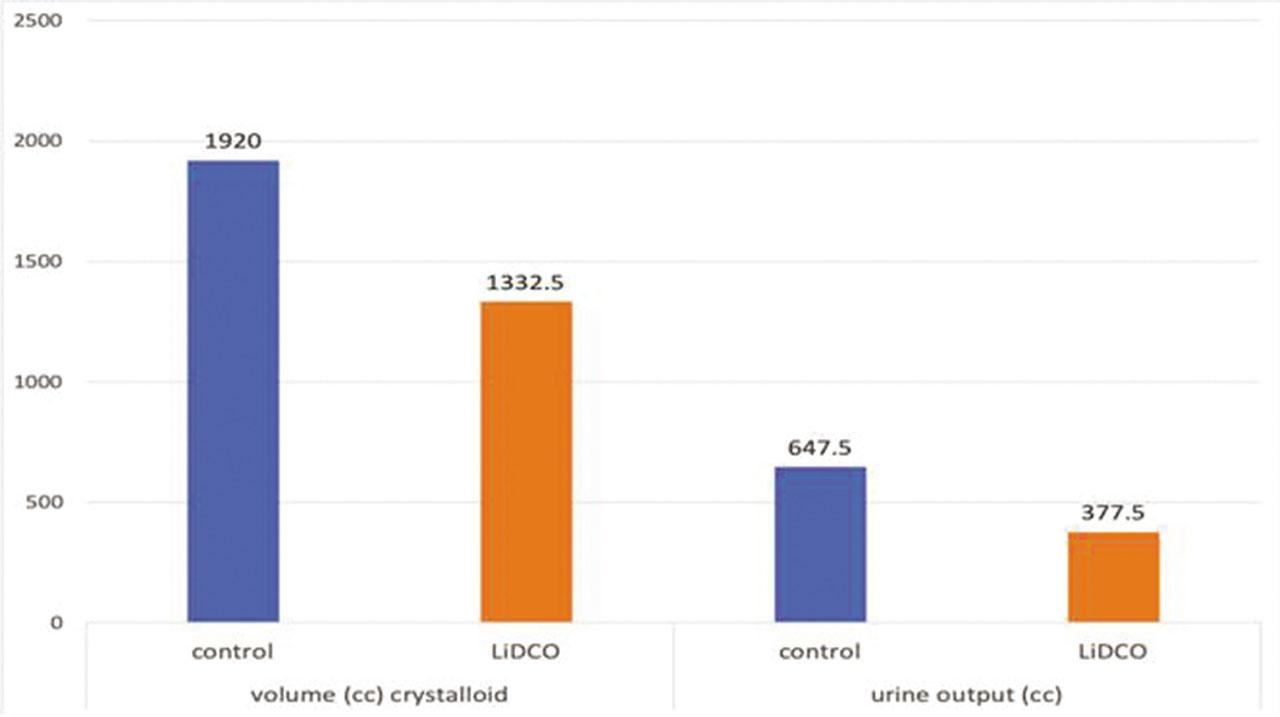
Figure 4
Comparison of peri- and postsurgical complications in two groups of patients
| Group | Control N (%) | LiDCO-Rapid N (%) | Total N (%) | Probability |
|---|---|---|---|---|
| Blood transfusion | 2 (10) | 3 (15) | 5 (12.5) | 0.633 |
| Myocardial infarction | 0 (0) | 0(0) | 0 (0) | - |
| Stroke | 0 (0) | 0 (0) | 0 (0) | - |
| Pulmonary thromboembolism | 0 (0) | 0(0) | 0 (0) | - |
| Deep vein thrombosis | 1 (5) | 0(0) | 1 (2.5) | 0.3 |
| Pneumonia | 1 (5) | 1(5) | 2 (5) | 0.100 |
| Pulmonary edema | 0 (0) | 0 (0) | 0 (0) | - |
| Urinary tract infection | 0 (0) | 0(0) | 0 (0) | 0.1000 |
| Sepsis | 0 (0) | 0 (0) | 0 (0) | - |
| Acute respiratory distress syndrome | 0 (0) | 0 (0) | 0 (0) | - |
| Acute renal failure | 0 (0) | 0 (0) | 0 (0) | - |
| Postsurgical nausea and vomiting | 6 (30) | 3 (15) | 9 (22.5) | 0.256 |
| Reintubation | 0 (0) | 0 (0) | 0 (0) | - |
| Lower extremity nerve defect | 0 (0) | 0 (0) | 0 (0) | - |
| Total complications | 11 (55) | 6 (30) | 17 (42.5) | 0.110 |
Comparing the peri- and postsurgical quantitative variables in two groups
| Group | N | Mean | Standard deviation | Median | IQR | Probability | |
|---|---|---|---|---|---|---|---|
| Bleeding (cc) | control | 20 | 527.00 | 273.90 | - | - | 0.916 |
| LiDCO | 20 | 517.50 | 290.47 | - | - | ||
| Base excess (mEq/L) | control | 20 | −8.25 | 1.94 | - | - | <0.001 |
| LiDCO | 20 | −4.75 | 2.22 | - | - | ||
| Volume (cc) crystalloid | control | 20 | 1920.00 | 584.53 | - | - | 0.001 |
| LiDCO | 20 | 1332.50 | 409.19 | - | - | ||
| Urine output (cc) | control | 20 | 647.50 | 211.18 | - | - | <0.001 |
| LiDCO | 20 | 377.50 | 105.72 | - | - | ||
| Hospitalization (day) | control | 20 | - | - | 2 | 2–3 | 0.027* |
| LiDCO | 20 | - | - | 2 | 1–2 | ||
| ICU admission (day) | control | 10 | - | - | 0.5 | 0–1 | 0.087* |
| LiDCO | 6 | - | - | 0 | 0–0.75 | ||
| Starting solids (hour) | control | 20 | - | - | 10 | 8–12 | <0.001* |
| LiDCO | 20 | - | - | 7 | 6–7.5 |
Preoperative characteristics of patients divided into two groups
| Group | Control N (%) | LiDCO-Rapid N (%) | Total N (%) | Probability | |
|---|---|---|---|---|---|
| Sex | Female | 11 (55) | 11(55) | 22 (55) | 0.624 |
| Male | 9 (45) | 9 (45) | 18 (45) | ||
| ASA | I | 5 (25) | 6 (30) | 11 (27.5) | 0.500 |
| II | 15 (75) | 14 (70) | 29 (72.5) | ||
| Hypertension | 10 (50) | 6 (30) | 16 (40) | 0.167 | |
| Hyperlipidemia | 2 (10) | 0 (0) | 2 (5) | 0.244 | |
| Diabetes mellitus | 5 (25) | 2 (10) | 7 (17.5) | 0.204 | |
| Ischemic heart disease | 4 (20) | 3 (15) | 7 (17.5) | 0.500 | |
| Mitral valve prolapse | 0 (0) | 1 (5) | 1 (2.5) | 0.500 | |
| Chronic obstructive pulmonary disease | 1 (5) | 1(5) | 2(5) | 1.000 | |