
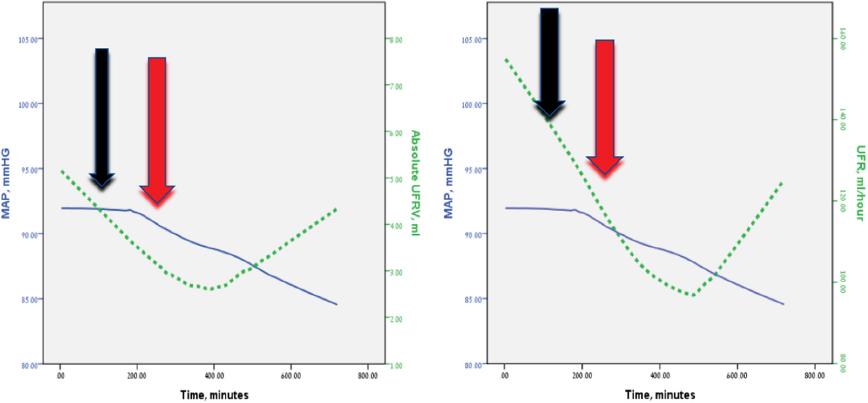
Figure 1
Laboratory and clinical data of the 50 study group patients (mean ± SD)_
| TIME1 TIME1 – vital signs during the 3 hours following admission to the ICU; TIME2 – vital signs 9 hours after the septic event. | TIME2 TIME1 – vital signs during the 3 hours following admission to the ICU; TIME2 – vital signs 9 hours after the septic event. | p value A p value of less than 0.05 is considered to be statistically significant. | |
|---|---|---|---|
| Mean arterial blood pressure (mmHg) | 94.53 ± 14.84 | 88.21 ± 13.62 | 0.06 |
| Heart rate (beat/min) | 105.48 ±19.38 | 108.05 ± 20.50 | 0.06 |
| Urine output per hour (mL) | 147.56 ± 28.1 | 87.53 ± 15.8 | <0.001 |
| Minute-to-minute urine flow rate Minute-to-minute urine flow rate is denoted as mL/hour urine volume as measured every minute by the URINFO 2000™ urinometer. | 146.65 ± 117.30 | 106.65±72.0 | <0.001 |
| Urine flow rate variability (mean, mL) | 5.18 ± 9.40 | 2.63 ± 3.35 | <0.001 |
| Hemoglobin (g\dL) | 9.43 ± 1.16 | 9.03 ± 0.12 | 0.2 |
| White blood cell count (k/ mm3) | 9.9 ± 3.4 | 15.9±1.45 | 0.01 |
| Bicarbonate arterial blood (mEq/L) | 26.3 ± 4.35 | 20.3 ± 1.35 | 0.03 |
| pH arterial blood | 7.41 ± 0.01 | 7.31 ± 0.03 | 0.06 |
| Arterial blood lactate (mmol/L) | 1.19 ± 0.70 | 2.5 ± 1.4 | 0.04 |
| Urea (mg/dL) | 54 ± 15.5 | 74 ± 7.2 | 0.06 |
| Creatinine (mg/dL) | 0.8 ± 0.03 | 0.9 ± 0.1 | 0.08 |
| Body temperature (°C) | 36.08 ± 0.05 | 38.98 ± 0.05 | 0.03 |
Demographic data and APACHE IIAcute Physiology and Chronic Health Evaluation II_ scores on admission_
| Septic critically ill patients (n = 50) | 58.80 ± 19.74 |
|---|---|
| Age, years (mean ± SD) | 58.80 ± 19.74 |
| Gender (male) | 31 (61%) |
| Weight, kg (mean ± SD) | 84.19 ± 22.64 |
| APACHE II score (units, mean ± SD) | 21.68 ± 4.9 |